Introduction: Why AI Agents Matter Now More Than Ever
Artificial Intelligence is no longer limited to static models that simply respond to prompts. We are entering an era where AI systems can act, decide, and execute tasks autonomously—these are known as AI agents. Unlike traditional AI tools, agents are designed to operate in dynamic environments, interact with tools, and complete multi-step objectives with minimal human intervention.
From automating business workflows to building intelligent assistants and autonomous decision-makers, AI agents are rapidly becoming one of the most valuable skills in the modern tech landscape. This course-style article will guide you through a structured journey—starting from foundational concepts, progressing to intermediate architectures, and finally reaching production-level deployment.
Phase 1: Beginner — Understanding the Foundations of AI Agents
At the beginner level, the goal is to grasp what an AI agent is and how it differs from a simple AI model.
An AI agent is essentially a system that:
Perceives input (text, data, environment)
Makes decisions based on reasoning
Takes actions using tools or outputs
The simplest form of an agent consists of:
A language model (LLM) as the brain
A prompt or instruction defining behavior
A loop mechanism to iterate over tasks
For example, a basic agent might:
Receive a user request
Break it into smaller tasks
Execute each step sequentially
At this stage, you should focus on:
Understanding prompt engineering
Learning how LLMs generate outputs
Building simple task-based agents
Example Use Case: A basic AI agent that summarizes articles and extracts key insights.
Key Beginner Takeaways:
Agents are goal-driven systems, not just responders
Prompt design is critical for behavior control
Simplicity is powerful—start small before scaling
Phase 2: Intermediate — Building Smarter and More Capable Agents
Once you understand the basics, the next step is to make your agents more intelligent, flexible, and autonomous.
At this stage, agents evolve into systems that can:
Use external tools (APIs, databases, calculators)
Maintain memory (short-term and long-term)
Plan multi-step workflows
Core Components of Intermediate Agents
1. Tool Usage Agents can call external functions such as:
Web search
Data retrieval
Code execution
2. Memory Systems Memory allows agents to:
Remember past interactions
Maintain context across sessions
3. Planning & Reasoning Instead of reacting instantly, agents can:
Break down complex goals
Evaluate multiple strategies
Choose optimal actions
Example Use Case: A business assistant agent that:
Reads emails
Extracts tasks
Schedules meetings automatically
Key Intermediate Takeaways:
Tools transform agents from “smart” to “useful”
Memory enables personalization and continuity
Planning introduces real autonomy
Advertisements
Phase 3: Advanced — Multi-Agent Systems and Orchestration
At the advanced level, you move beyond single agents into ecosystems of agents working together.
Multi-Agent Systems
Instead of one agent doing everything, you can design:
A research agent to gather information
A planner agent to organize tasks
An executor agent to perform actions
These agents collaborate, similar to a team in a company.
Orchestration Layers
To manage multiple agents, you need:
Task routing systems
Communication protocols between agents
Error handling mechanisms
Example Use Case: An AI content pipeline where:
One agent researches topics
Another writes content
A third edits and optimizes SEO
Key Advanced Takeaways:
Specialization improves performance
Coordination is more important than intelligence
Systems thinking becomes essential
Phase 4: Production — Deploying Real-World AI Agents
Building an agent is one thing—deploying it reliably is another.
Production-level agents must handle:
Scalability
Security
Cost efficiency
Monitoring and logging
Key Production Considerations
1. Infrastructure
Cloud platforms (AWS, GCP, Azure)
Containerization (Docker)
Serverless architectures
2. Performance Optimization
Reduce API calls
Cache responses
Optimize prompt length
3. Safety & Guardrails
Prevent harmful outputs
Add validation layers
Monitor behavior
4. Observability
Track agent decisions
Log failures
Improve iteratively
Example Use Case: A customer support AI agent that handles thousands of users daily with real-time responses.
Key Production Takeaways:
Reliability matters more than raw intelligence
Monitoring is non-negotiable
Cost control is critical for scaling
Real-World Applications of AI Agents
AI agents are already transforming industries in practical ways:
E-commerce: Automated customer support and recommendations
Marketing: Content generation and campaign optimization
Finance: Risk analysis and reporting automation
Healthcare: Data analysis and patient assistance systems
These applications demonstrate that AI agents are not just experimental—they are operational tools delivering measurable value.
Conclusion: Your Roadmap to Mastering AI Agents
The journey from beginner to production-ready AI agent developer is not about memorizing tools—it’s about understanding systems.
You will position yourself at the forefront of one of the most impactful technological shifts of this decade.
The real opportunity lies not just in using AI—but in building systems that use AI autonomously.
Advertisements
إتقان وكلاء الذكاء الاصطناعي: من الصفر إلى أنظمة جاهزة للإنتاج
Advertisements
مقدمة: لماذا يُعدّ وكلاء الذكاء الاصطناعي أكثر أهمية من أي وقت مضى؟
لم يعد الذكاء الاصطناعي مقتصراً على نماذج ثابتة تستجيب فقط للمُدخلات. نحن ندخل عصراً تستطيع فيه أنظمة الذكاء الاصطناعي التصرّف واتخاذ القرارات وتنفيذ المهام بشكل مستقل – تُعرف هذه الأنظمة بوكلاء الذكاء الاصطناعي. على عكس أدوات الذكاء الاصطناعي التقليدية، صُممت هذه الوكلاء للعمل في بيئات ديناميكية، والتفاعل مع الأدوات، وإنجاز مهام متعددة الخطوات بأقل قدر من التدخل البشري
من أتمتة سير العمل في الشركات إلى بناء مساعدين أذكياء وصانعي قرارات مستقلين، تُصبح وكلاء الذكاء الاصطناعي بسرعة واحدة من أهم المهارات في المشهد التقني الحديث، ستُرشدك هذه المقالة، المصممة على شكل دورة تدريبية، خلال رحلة منظمة – بدءاً من المفاهيم الأساسية، مروراً بالبنى المتوسطة، وصولاً إلى النشر على مستوى الإنتاج
المرحلة الأولى: المبتدئ – فهم أساسيات وكلاء الذكاء الاصطناعي
في مستوى المبتدئين، الهدف هو فهم ماهية وكيل الذكاء الاصطناعي وكيف يختلف عن نموذج الذكاء الاصطناعي البسيط
:وكيل الذكاء الاصطناعي هو نظام يقوم أساساً بما يلي
يستقبل المدخلات (نصوص، بيانات، بيئة) •
يتخذ قرارات بناءً على المنطق •
ينفذ إجراءات باستخدام أدوات أو مخرجات •
:يتكون أبسط شكل للوكيل من
بمثابة الدماغ LLM نموذج لغوي •
موجه أو تعليمات تحدد السلوك •
آلية تكرار لتنفيذ المهام •
: على سبيل المثال، قد يقوم وكيل أساسي بما يلي
1. استقبال طلب المستخدم
2. تقسيمه إلى مهام أصغر
3. تنفيذ كل خطوة بالتسلسل
:في هذه المرحلة، ينبغي التركيز على
فهم هندسة الموجهات •
تعلم كيفية توليد نماذج اللغة للمخرجات •
بناء وكلاء بسيطين قائمين على المهام •
:مثال على حالة استخدام
وكيل ذكاء اصطناعي أساسي يلخص المقالات ويستخلص الأفكار الرئيسية
:أهم النقاط للمبتدئين
الأنظمة الذكية هي أنظمة موجهة نحو تحقيق الأهداف، وليست مجرد أنظمة استجابة •
تصميم التنبيهات أمر بالغ الأهمية للتحكم في السلوك •
البساطة قوة – ابدأ بخطوات صغيرة قبل التوسع •
المرحلة الثانية: المستوى المتوسط - بناء أنظمة ذكية أكثر ذكاءً وكفاءة
بعد فهم الأساسيات، تتمثل الخطوة التالية في جعل أنظمتك الذكية أكثر ذكاءً ومرونة واستقلالية
:في هذه المرحلة، تتطور الأنظمة الذكية إلى أنظمة قادرة على
استخدام أدوات خارجية (واجهات برمجة التطبيقات، قواعد البيانات، الآلات الحاسبة) •
الاحتفاظ بالذاكرة (قصيرة المدى وطويلة المدى) •
تخطيط سير العمل متعدد الخطوات •
:المكونات الأساسية للأنظمة الذكية الوسيطة
1. استخدام الأدوات
: يمكن للأنظمة الذكية استدعاء وظائف خارجية مثل
البحث على الويب •
استرجاع البيانات •
تنفيذ التعليمات البرمجية •
2. أنظمة الذاكرة
: تتيح الذاكرة للأنظمة الذكية ما يلي
تذكر التفاعلات السابقة •
الحفاظ على السياق بين الجلسات •
3. التخطيط والاستدلال
: بدلاً من الاستجابة الفورية، يمكن للأنظمة الذكية ما يلي
تحليل الأهداف المعقدة •
تقييم استراتيجيات متعددة •
اختيار الإجراءات المثلى •
:مثال على حالة استخدام
:مساعد أعمال ذكي يقوم بما يلي
قراءة رسائل البريد الإلكتروني •
استخراج المهام •
جدولة الاجتماعات تلقائياً •
: النقاط الرئيسية للأنظمة الذكية الوسيطة
الأدوات تحول الأنظمة الذكية من “ذكية” إلى “مفيدة” •
الذاكرة تُمكّن من التخصيص والاستمرارية •
التخطيط يُضفي استقلالية حقيقية •
Advertisements
المرحلة الثالثة: المستوى المتقدم – أنظمة متعددة الوكلاء والتنسيق
في المستوى المتقدم، تتجاوز مفهوم الوكلاء المنفردين إلى بيئات متكاملة من الوكلاء الذين يعملون معاً
أنظمة متعددة الوكلاء
: بدلاً من أن يقوم وكيل واحد بكل شيء، يمكنك تصميم ما يلي
وكيل بحث لجمع المعلومات •
وكيل تخطيط لتنظيم المهام •
وكيل تنفيذ لتنفيذ الإجراءات •
يتعاون هؤلاء الوكلاء، تماماً كما هو الحال في فريق عمل داخل شركة
طبقات التنسيق
: لإدارة عدة وكلاء، أنت بحاجة إلى
أنظمة توجيه المهام •
بروتوكولات اتصال بين الوكلاء •
آليات معالجة الأخطاء •
:مثال عملي
: خط أنابيب محتوى ذكاء اصطناعي حيث
وكيل يبحث في المواضيع •
وكيل آخر يكتب المحتوى •
وكيل ثالث يحرر المحتوى ويحسنه لمحركات البحث •
:النقاط الرئيسية للمستوى المتقدم
التخصص يحسن الأداء •
التنسيق أهم من الذكاء •
التفكير النظمي ضروري •
المرحلة الرابعة: الإنتاج – نشر وكلاء ذكاء اصطناعي في العالم الحقيقي
بناء وكيل شيء، ونشره بشكل موثوق شيء آخر
:يجب أن تراعي أنظمة الذكاء الاصطناعي المستخدمة في بيئة الإنتاج ما يلي
قابلية التوسع •
الأمان •
كفاءة التكلفة •
المراقبة والتسجيل •
اعتبارات الإنتاج الرئيسية
1. البنية التحتية
(AWS، GCP، Azure) منصات الحوسبة السحابية •
(Docker) الحاويات •
البنى غير الخادمة •
2. تحسين الأداء
(API) تقليل استدعاءات واجهة برمجة التطبيقات •
تخزين الاستجابات مؤقتاً •
تحسين طول موجه الأوامر •
3. السلامة والضوابط
منع المخرجات الضارة •
إضافة طبقات التحقق •
مراقبة السلوك •
4. إمكانية المراقبة
تتبع قرارات النظام •
تسجيل حالات الفشل •
التحسين المستمر •
:مثال على حالة استخدام
نظام ذكاء اصطناعي لدعم العملاء يتعامل مع آلاف المستخدمين يومياً باستجابات فورية
:أهم النقاط الرئيسية في بيئة الإنتاج
الموثوقية أهم من الذكاء الخام •
المراقبة ضرورية •
التحكم في التكلفة أمر بالغ الأهمية للتوسع •
تطبيقات الذكاء الاصطناعي في العالم الحقيقي
: يُحدث الذكاء الاصطناعي تحولاً جذرياً في مختلف القطاعات بطرق عملية، منها
التجارة الإلكترونية: دعم العملاء والتوصيات الآلية
التسويق: إنشاء المحتوى وتحسين الحملات التسويقية
التمويل: تحليل المخاطر وأتمتة إعداد التقارير
الرعاية الصحية: تحليل البيانات وأنظمة مساعدة المرضى تُبرهن هذه التطبيقات أن الذكاء الاصطناعي ليس مجرد أدوات تجريبية، بل هو أدوات تشغيلية تُقدم قيمة ملموسة
الخلاصة: خارطة طريقك لإتقان الذكاء الاصطناعي
لا يقتصر الانتقال من مبتدئ إلى مطور ذكاء اصطناعي جاهز للإنتاج على حفظ الأدوات، بل على فهم الأنظمة
ابدأ ببساطة. ابنِ باستمرار. وسّع بذكاء
: إذا اتبعت هذا التدرج
تعلم الأساسيات •
أضف الأدوات والذاكرة •
صمم أنظمة متعددة الوكلاء •
انشر بثقة •
ستكون في طليعة أحد أهم التحولات التكنولوجية في هذا العقد
لا تكمن الفرصة الحقيقية في استخدام الذكاء الاصطناعي فحسب، بل في بناء أنظمة تستخدمه بشكل مستقل
In today’s hyper-connected world, cybersecurity is more than just a buzzword; it’s a necessity. As data scientists, we deal with sensitive information on a daily basis, whether it’s user data, financial records, or intellectual property. But the ever-growing threat of data theft looms large, with hackers constantly evolving their methods and tools to gain unauthorized access to valuable information. While sophisticated cyberattacks often grab headlines, one of the most effective methods of stealing data happens through physical hacking devices. These devices are simple, easy to use, and, in many cases, nearly undetectable. In this article, we explore the eight most dangerous hacking devices that data scientists need to be aware of, shedding light on how they work and the real-world risks they pose.
1. USB Rubber Ducky: A Small, Yet Mighty Intruder
Among the most infamous hacking tools used by cybercriminals is the USB Rubber Ducky. A seemingly innocuous USB flash drive, this device is actually a high-tech keyboard emulator. When plugged into a computer, the Rubber Ducky mimics the behavior of a keyboard, sending keystrokes that can open backdoors, steal passwords, or even execute malicious code on the infected machine. Despite its relatively simple design, the Rubber Ducky’s effectiveness lies in its ability to bypass security measures like firewalls and antivirus programs by exploiting the trusted connection between a keyboard and the computer.
A real-life example of this tool being used comes from the famous 2010 attack on a United States military base in the Middle East. Hackers used a USB Rubber Ducky to infiltrate the military network and introduce a sophisticated malware called “Stuxnet,” which then went on to sabotage Iran’s nuclear program. While this case involved highly advanced malware, it illustrates just how easy it is for attackers to use small devices like the Rubber Ducky to gain control of vital systems. As data scientists, we should be aware that these devices can even be used in corporate environments to exfiltrate sensitive data from company computers.
2. Wi-Fi Pineapple: The Perfect Tool for Man-in-the-Middle Attacks
Wi-Fi Pineapple is a tool designed for penetration testing but has found its way into the hands of malicious hackers. It’s essentially a portable device that creates rogue Wi-Fi networks that unsuspecting users connect to, thinking they are legitimate hotspots. Once connected, hackers can monitor and manipulate all data transmitted between the user and the network, making it a powerful tool for executing man-in-the-middle (MITM) attacks. Wi-Fi Pineapple can intercept login credentials, banking information, and any other sensitive data being transmitted over the network.
The infamous “DigiNotar breach” in 2011 highlights the dangerous potential of MITM attacks. Hackers used a compromised digital certificate authority to conduct a series of MITM attacks, redirecting users to phishing websites that collected login credentials. In the context of a Wi-Fi Pineapple attack, a hacker could easily launch a similar attack, especially in public places like cafes, airports, and hotels where users are likely to connect to untrusted networks. For data scientists working with cloud-based or internet-of-things (IoT) data, Wi-Fi Pineapple represents a significant threat to data integrity.
3. Keylogger Devices: Stealthy and Persistent
Keylogger devices are some of the most insidious hacking tools available. These devices, which are often the size of a small USB stick or a circuit board, are designed to silently record every keystroke made on a computer or mobile device. The data collected can then be transferred to a hacker, often without the victim’s knowledge. Keyloggers can be installed on public machines, employee workstations, or even smartphones through malicious apps or physical access.
One notorious example occurred in 2005 when cybercriminals used a combination of hardware and software keyloggers to steal millions of dollars from unsuspecting victims’ bank accounts. The hackers were able to monitor keystrokes, capture usernames, passwords, and banking details, and eventually access accounts directly. As data scientists, we often rely on the security of the devices we work with to safeguard sensitive data, and the reality of keylogger attacks reminds us how easily information can be compromised through simple physical devices.
4. RATs (Remote Access Trojans): Full Control, Full Data Theft
Remote Access Trojans (RATs) are software-based malware that give hackers complete control over an infected system. While they typically need to be installed through phishing emails or malicious downloads, the installation can often happen through physical devices as well, such as a USB drive. Once a RAT is deployed, hackers can access everything on a computer—files, browsing history, passwords, and even live webcam and microphone feeds. This level of access makes RATs one of the most potent tools for data theft.
A case that demonstrates the effectiveness of RATs comes from the 2014 cyber espionage attack on Sony Pictures. Hackers used a variant of a RAT to gain full access to the company’s internal network, eventually stealing sensitive emails, unreleased films, and employee data. The attack had wide-reaching consequences, both financially and reputationally, for Sony. For data scientists working in the realm of sensitive information, understanding the risks associated with RATs is critical, as these tools can be used to steal intellectual property or exfiltrate proprietary algorithms and data models.
Advertisements
5. Bluetooth Sniffers: Silent Eavesdroppers
Bluetooth sniffers are hacking devices used to intercept communications between Bluetooth-enabled devices, such as smartphones, laptops, and even medical equipment. These devices can be used to steal sensitive data, such as personal information, credit card details, and even passwords, by exploiting weak or poorly configured Bluetooth security protocols. Bluetooth sniffing is particularly dangerous in environments like offices, airports, and coffee shops, where many devices may be connected to public Bluetooth networks.
In 2018, researchers demonstrated how a Bluetooth sniffer could be used to steal data from the Bluetooth-enabled locks on hotel room doors. Hackers could listen in on the communication between the hotel’s Bluetooth systems and gain unauthorized access to the rooms. This incident highlights just how vulnerable Bluetooth connections can be, especially when not properly encrypted. For data scientists working on projects involving IoT or connected devices, Bluetooth sniffers represent a key risk to the integrity and privacy of the data being transmitted.
6. Evil Maid Attacks: Physical Access, Digital Consequences
Evil Maid attacks are a type of attack where the hacker gains physical access to a device (often a laptop) and installs malicious software or exploits vulnerabilities to compromise the system. This could happen in an office setting or a hotel room, where an attacker steals a brief opportunity to tamper with the device. Once the software is installed, it may give the attacker remote access to the device, making it possible for them to steal data, spy on communications, or even monitor the device’s user.
One well-known case of an Evil Maid attack was the 2016 breach of a United States-based cybersecurity expert’s laptop. The attacker gained physical access to the machine, installed malicious software, and later exfiltrated valuable intellectual property and classified data. The “Evil Maid” name stems from a scenario where an attacker, posing as a hotel maid, takes advantage of the brief period while the owner of the laptop is away. This attack underscores the importance of physical security when handling sensitive data, particularly when using portable devices.
7. SIM Card Cloning: Hijacking Communication Channels
SIM card cloning involves copying the unique identifiers of a mobile device’s SIM card, allowing hackers to intercept calls, messages, and data sent to and from the phone. This attack is particularly dangerous because it gives the attacker control over the victim’s communication, including the ability to bypass two-factor authentication (2FA) systems that rely on SMS. The attack can be carried out with simple, off-the-shelf equipment, and is commonly used in targeted attacks against individuals or organizations.
A high-profile example of SIM card cloning occurred in 2014, when hackers used the technique to hijack the mobile phones of high-profile targets, including journalists and politicians. This attack compromised the security of sensitive communications and even enabled hackers to impersonate victims in fraudulent transactions. For data scientists, SIM card cloning represents a risk, especially for mobile applications that store sensitive user data or rely on mobile authentication systems.
8. RFID Skimmers: Stealing Data from a Distance
Radio Frequency Identification (RFID) skimmers are devices used to intercept signals from RFID-enabled cards, such as credit cards, identification cards, and access control cards. These skimmers can read data from a distance without physical contact with the card, making them ideal for stealthily stealing information. RFID skimming is especially dangerous in public spaces, such as airports or shopping malls, where many people carry RFID-enabled devices.
In 2017, a group of hackers used RFID skimmers to steal millions of dollars from unsuspecting victims at a major European airport. The skimmers were able to collect data from passengers’ RFID-enabled credit and debit cards, which the attackers later used to make fraudulent transactions. As a data scientist, understanding the vulnerabilities of RFID technology and how easily it can be exploited is critical, especially when designing secure data storage and authentication systems.
Advertisements
الجانب المظلم للتكنولوجيا – 8 أجهزة اختراق يمكنها سرقة بياناتك
Advertisements
في عالم اليوم فائق الترابط، لم يعد الأمن السيبراني مجرد مصطلح رائج فحسب، بل أصبح ضرورة ملحة. وبصفتنا علماء بيانات، فإننا نتعامل مع معلومات حساسة بشكل يومي، سواء كانت بيانات مستخدمين، أو سجلات مالية، أو ملكية فكرية. غير أن شبح سرقة البيانات، الذي يتنامى تهديده باستمرار، يلوح في الأفق بقوة؛ إذ يعمل المخترقون بلا كلل على تطوير أساليبهم وأدواتهم للوصول غير المصرح به إلى المعلومات القيمة. وفي حين أن الهجمات السيبرانية المتطورة غالباً ما تتصدر عناوين الأخبار، إلا أن إحدى أكثر الطرق فعالية لسرقة البيانات تتم من خلال أجهزة الاختراق المادية. وتتميز هذه الأجهزة بالبساطة وسهولة الاستخدام، وفي كثير من الحالات، تكون غير قابلة للكشف تقريباً. في هذا المقال، نستكشف أخطر ثمانية أجهزة اختراق يجب على علماء البيانات أن يكونوا على دراية بها، مسلطين الضوء على آلية عملها والمخاطر الواقعية التي تشكلها
1. USB Rubber Ducky: متسلل صغير الحجم، عظيم التأثير
“USB Rubber Ducky” يُعد جهاز
واحداً من أكثر أدوات الاختراق شهرة وسوء سمعة بين تلك التي يستخدمها مجرمو الإنترنت، ورغم أنه يبدو للوهلة الأولى
محمول (فلاش ميموري) غير ضار “USB” وكأنه محرك أقراص
إلا أن هذا الجهاز في الواقع عبارة عن محاكي لوحة مفاتيح عالي التقنية، فعند توصيله بجهاز الكمبيوتر
سلوك لوحة المفاتيح “Rubber Ducky” يحاكي جهاز
مرسلاً سلسلة من ضغطات المفاتيح القادرة
للوصول غير المصرح به (Backdoors) على فتح أبواب خلفية
أو سرقة كلمات المرور، أو حتى تنفيذ تعليمات برمجية خبيثة على الجهاز المخترق، ورغم تصميمه البسيط نسبياً
في قدرته على تجاوز التدابير الأمنية “Rubber Ducky” تكمن فعالية جهاز
مثل جدران الحماية وبرامج مكافحة الفيروسات – وذلك من خلال استغلال الاتصال الموثوق به القائم بين لوحة المفاتيح وجهاز الكمبيوتر
ومن الأمثلة الواقعية على استخدام هذه الأداة ما حدث في الهجوم الشهير الذي وقع عام 2010 على إحدى القواعد العسكرية الأمريكية في منطقة الشرق الأوسط
“USB Rubber Ducky” حيث استخدم المخترقون جهاز
لاختراق الشبكة العسكرية وزرع برمجية خبيثة متطورة
والتي نجحت لاحقاً في تخريب البرنامج النووي الإيراني “Stuxnet” تُدعى
ورغم أن هذه الحادثة تضمنت استخدام برمجيات خبيثة بالغة التطور، إلا أنها توضح مدى السهولة التي يمكن بها للمهاجمين استخدام أجهزة صغيرة الحجم
“Rubber Ducky” مثل
للسيطرة على الأنظمة الحيوية. وبصفتنا علماء بيانات، ينبغي علينا أن ندرك أن هذه الأجهزة قد تُستخدم أيضاً داخل بيئات العمل المؤسسية لسرقة البيانات الحساسة واستخراجها خلسةً من أجهزة الكمبيوتر الخاصة بالشركات
2. الأداة المثالية لهجمات الرجل في المنتصف:Wi-Fi Pineapple
أداةً صُممت في الأصل لأغراض اختبار الاختراق Wi-Fi Pineapple تُعد أداة
إلا أنها شقت طريقها لتستقر في أيدي القراصنة ذوي النوايا الخبيثة
Wi-Fi وهي في جوهرها جهاز محمول يقوم بإنشاء شبكات
وهمية (أو مارقة) يتصل بها المستخدمون غير المرتابين، ظناً منهم أنها نقاط اتصال شرعية وآمنة. وبمجرد إتمام الاتصال، يتمكن القراصنة من مراقبة كافة البيانات المُرسلة بين المستخدم والشبكة، بل والتلاعب بها أيضاً؛ مما يجعلها أداةً بالغة القوة
(MITM) لتنفيذ هجمات “الرجل في المنتصف
اعتراض بيانات تسجيل الدخول Wi-Fi Pineapple وتستطيع أداة
والمعلومات المصرفية، وأي بيانات حساسة أخرى يجري تداولها عبر الشبكة
سيئ السمعة DigiNotar ويُبرز حادث “اختراق
2011 الذي وقع في عام
مدى الخطورة الكامنة في هجمات “الرجل في المنتصف”، ففي ذلك الحادث، استغل القراصنة هيئة إصدار شهادات رقمية تم اختراقها
حيث قاموا بإعادة توجيه المستخدمين MITM لتنفيذ سلسلة من هجمات
(Phishing) نحو مواقع إلكترونية احتيالية
عملت على جمع بيانات تسجيل الدخول الخاصة بهم
Wi-Fi Pineapple وفي سياق الهجوم باستخدام أداة
يمكن للقراصنة شن هجوم مماثل بكل سهولة، لا سيما في الأماكن العامة مثل المقاهي، والمطارات، والفنادق؛ حيث يزداد احتمال اتصال المستخدمين بشبكات غير موثوقة، وبالنسبة لعلماء البيانات الذين يتعاملون مع البيانات المخزنة سحابياً
(IoT) أو تلك المرتبطة بـ “إنترنت الأشياء”
تهديداً جسيماً لسلامة البيانات وموثوقيتها Wi-Fi Pineapple تُمثل أداة
3. : خفية ومستمرة(Keyloggers)أجهزة تسجيل ضربات المفاتيح
(Keyloggers) تُعد أجهزة تسجيل ضربات المفاتيح
من أكثر أدوات الاختراق مكراً وخبثاً المتاحة حالياً
USB صُممت هذه الأجهزة – التي غالباً ما تكون بحجم وحدة تخزين
صغيرة أو لوحة دوائر إلكترونية – لتسجيل كل ضربة مفتاح يتم إجراؤها على جهاز الكمبيوتر أو الهاتف المحمول بصمت ودون أن يلحظها أحد، ويمكن بعد ذلك نقل البيانات التي تم جمعها إلى المخترق، وغالباً ما يتم ذلك دون علم الضحية. ويمكن تثبيت أجهزة تسجيل ضربات المفاتيح على الأجهزة العامة، أو محطات عمل الموظفين، أو حتى الهواتف الذكية؛ سواء كان ذلك عبر تطبيقات خبيثة أو من خلال الوصول المادي المباشر للجهاز
ومن الأمثلة السيئة السمعة على ذلك ما حدث في عام 2005، حين استخدم مجرمو الإنترنت مزيجاً من أجهزة وبرمجيات تسجيل ضربات المفاتيح لسرقة ملايين الدولارات من الحسابات المصرفية لضحايا لم يساورهم أي شك. وقد تمكن المخترقون من مراقبة ضربات المفاتيح، والتقاط أسماء المستخدمين، وكلمات المرور، والتفاصيل المصرفية، وصولاً في النهاية إلى الدخول المباشر إلى الحسابات. وبصفتنا علماء بيانات، فإننا غالباً ما نعتمد على أمن الأجهزة التي نعمل عليها لحماية البيانات الحساسة؛ غير أن واقع هجمات تسجيل ضربات المفاتيح يذكرنا بمدى السهولة التي يمكن بها تعريض المعلومات للخطر من خلال أجهزة مادية بسيطة
سيطرة وسرقة بيانات كاملة:(RATs)٤. برامج التجسس عن بُعد
(RATs) برامج التجسس عن بُعد
هي برامج خبيثة تمنح المخترقين سيطرة كاملة على النظام المصاب، على الرغم من أن تثبيتها يتم عادةً عبر رسائل البريد الإلكتروني التصيدية أو التنزيلات الخبيثة، إلا أنه يمكن تثبيتها أيضًا عبر أجهزة مادية
USB مثل ذاكرة
فبمجرد تثبيت برنامج التجسس عن بُعد، يستطيع المخترقون الوصول إلى كل شيء على جهاز الكمبيوتر – الملفات، وسجل التصفح، وكلمات المرور، وحتى البث المباشر من كاميرا الويب والميكروفون. هذا المستوى من الوصول يجعل برامج التجسس عن بُعد من أقوى أدوات سرقة البيانات
من الأمثلة التي تُظهر فعالية برامج التجسس عن بُعد، هجوم التجسس الإلكتروني الذي استهدف شركة سوني بيكتشرز عام ٢٠١٤، استخدم المخترقون نوعاً مختلفاً من برامج التجسس عن بُعد للوصول الكامل إلى الشبكة الداخلية للشركة، وتمكنوا في النهاية من سرقة رسائل بريد إلكتروني حساسة، وأفلام لم تُعرض بعد، وبيانات الموظفين، كان للهجوم عواقب وخيمة على سوني، سواءً من الناحية المالية أو من حيث السمعة، بالنسبة لعلماء البيانات العاملين في مجال المعلومات الحساسة، يُعدّ فهم المخاطر المرتبطة بتقنيات الوصول عن بُعد أمراً بالغ الأهمية، إذ يُمكن استخدام هذه الأدوات لسرقة الملكية الفكرية أو استخراج الخوارزميات ونماذج البيانات الخاصة
Advertisements
5. أجهزة التجسس عبر البلوتوث: أجهزة تنصت صامتة
أجهزة التجسس عبر البلوتوث هي أجهزة اختراق تُستخدم لاعتراض الاتصالات بين الأجهزة التي تدعم تقنية البلوتوث، مثل الهواتف الذكية وأجهزة الكمبيوتر المحمولة وحتى المعدات الطبية. يُمكن استخدام هذه الأجهزة لسرقة البيانات الحساسة، مثل المعلومات الشخصية وتفاصيل بطاقات الائتمان وحتى كلمات المرور، من خلال استغلال بروتوكولات أمان البلوتوث الضعيفة أو غير المُهيأة بشكل صحيح. يُعدّ التجسس عبر البلوتوث خطيراً بشكل خاص في بيئات مثل المكاتب والمطارات والمقاهي، حيث قد تكون العديد من الأجهزة متصلة بشبكات بلوتوث عامة في عام 2018، أظهر باحثون كيف يُمكن استخدام جهاز تجسس عبر البلوتوث لسرقة البيانات من أقفال أبواب غرف الفنادق التي تدعم تقنية البلوتوث. إذ يُمكن للمخترقين التنصت على الاتصالات بين أنظمة البلوتوث في الفندق والوصول غير المصرح به إلى الغرف. تُبرز هذه الحادثة مدى هشاشة اتصالات البلوتوث، خاصةً عند عدم تشفيرها بشكل صحيح. بالنسبة لعلماء البيانات العاملين على مشاريع تتعلق بإنترنت الأشياء أو الأجهزة المتصلة، تُمثل برامج التجسس على البلوتوث خطراً كبيراً على سلامة البيانات المنقولة وخصوصيتها
6. (Evil Maid):هجمات “الخادمة الشريرة”
تُعد هجمات “الخادمة الشريرة” نوعاً من الهجمات التي يتمكن فيها المخترق من الوصول مادياً إلى جهازٍ ما (غالباً ما يكون جهاز كمبيوتر محمول)، ليقوم بعد ذلك بتثبيت برمجيات خبيثة أو استغلال الثغرات الأمنية بهدف اختراق النظام. وقد يحدث هذا النوع من الهجمات في بيئة العمل المكتبية أو داخل غرف الفنادق، حيث ينتهز المهاجم فرصة وجيزة للتلاعب بالجهاز. وبمجرد تثبيت البرمجيات الخبيثة، قد تمنح المهاجم إمكانية الوصول عن بُعد إلى الجهاز، مما يتيح له سرقة البيانات، أو التجسس على الاتصالات، أو حتى مراقبة تحركات مستخدم الجهاز
ومن أبرز الأمثلة المعروفة على هجمات “الخادمة الشريرة” حادثة الاختراق التي وقعت في عام 2016، واستهدفت جهاز الكمبيوتر المحمول الخاص بخبير في الأمن السيبراني مقيم في الولايات المتحدة. إذ تمكن المهاجم من الوصول مادياً إلى الجهاز، وقام بتثبيت برمجيات خبيثة، ومن ثم نجح لاحقاً في استخراج ملكية فكرية قيّمة وبيانات مصنفة على أنها سرية. ويستمد اسم “الخادمة الشريرة” أصله من سيناريو يقوم فيه المهاجم – متظاهراً بأنه خادمة في فندق – باستغلال الفترة الوجيزة التي يغيب فيها مالك الجهاز المحمول عن المكان. ويُبرز هذا الهجوم مدى أهمية الأمن المادي عند التعامل مع البيانات الحساسة، لا سيما عند استخدام الأجهزة المحمولة
7. اختطاف قنوات الاتصال:SIMاستنساخ بطاقات
SIM تتضمن عملية استنساخ بطاقات
نسخ المعرفات الفريدة الخاصة ببطاقة الاتصال الموجودة في جهاز الهاتف المحمول، مما يتيح للمخترقين اعتراض المكالمات والرسائل والبيانات الصادرة من الهاتف أو الواردة إليه، ويُعد هذا الهجوم خطيراً للغاية؛ لأنه يمنح المهاجم سيطرة كاملة على اتصالات الضحية، بما في ذلك القدرة
(2FA) على تجاوز أنظمة المصادقة الثنائية
SMS التي تعتمد في عملها على الرسائل النصية القصيرة
ويمكن تنفيذ هذا الهجوم باستخدام معدات بسيطة ومتاحة تجارياً، وغالباً ما يُستخدم في الهجمات الموجهة ضد أفراد بعينهم أو مؤسسات محددة.
SIM ومن الأمثلة البارزة على حوادث استنساخ بطاقات
ما حدث في عام 2014، حين استخدم مخترقون هذه التقنية لاختطاف الهواتف المحمولة الخاصة بشخصيات بارزة، بمن فيهم صحفيون وسياسيون. وقد أدى هذا الهجوم إلى تعريض أمن الاتصالات الحساسة للخطر، بل ومكّن المخترقين من انتحال شخصيات الضحايا لتنفيذ معاملات احتيالية. وبالنسبة لعلماء البيانات
خطراً حقيقياً SIM يمثل استنساخ بطاقات
لا سيما فيما يتعلق بتطبيقات الهاتف المحمول التي تقوم بتخزين بيانات المستخدمين الحساسة، أو تلك التي تعتمد على أنظمة المصادقة عبر الهاتف المحمول
8. سرقة البيانات عن بُعد:RFIDأجهزة قشط بيانات
RFID Skimmers تُعرف أجهزة قشط بيانات تحديد الهوية بموجات الراديو
بأنها أجهزة تُستخدم لاعتراض الإشارات الصادرة عن البطاقات
RFID التي تدعم تقنية
مثل بطاقات الائتمان، وبطاقات الهوية الشخصية، وبطاقات التحكم في الدخول. بإمكان أجهزة القشط هذه قراءة البيانات عن بُعد دون الحاجة إلى أي اتصال مادي بالبطاقة، مما يجعلها أداة مثالية لسرقة المعلومات خلسةً
RFID ويُعد قشط بيانات تقنية تحديد الهوية بموجات الراديو
خطيراً للغاية في الأماكن العامة، مثل المطارات أو مراكز التسوق، حيث يحمل الكثير من الأشخاص أجهزة تدعم هذه التقنية
وفي عام 2017
RFID استخدمت مجموعة من المتسللين أجهزة قشط
لسرقة ملايين الدولارات من ضحايا غير مدركين للخطر في أحد المطارات الأوروبية الكبرى؛ إذ تمكنت تلك الأجهزة من جمع البيانات من بطاقات الائتمان والخصم الخاصة بالمسافرين
RFID والمزودة بتقنية
وهي البيانات التي استغلها المهاجمون لاحقاً لتنفيذ معاملات احتيالية، وبصفتي عالماً في مجال البيانات
RFID فإن إدراك نقاط الضعف الكامنة في تقنية
ومدى سهولة استغلالها يُعد أمراً بالغ الأهمية، لا سيما عند تصميم أنظمة آمنة لتخزين البيانات والمصادقة عليها
For local business owners and SMB team leads, data often lives in too many places, spreadsheets, sales tools, inboxes, and business data processing turns into a weekly scramble. The core tension is simple: decisions need to move fast, but the numbers feel inconsistent, incomplete, or hard to trust. AI-driven data transformation can bring order to that mess, and machine learning applications can help spot patterns worth acting on without requiring a data science background. With the right foundation, these capabilities can shift data work from reactive cleanup to steady digital business innovation.
Understanding the Skill Path Behind AI Results
At the heart of using AI for better business decisions is a simple sequence: learn the basics, connect them to your day-to-day work, then build skills in a steady order. Start with an artificial intelligence definition so “smart tools” feel less mysterious, then learn how machine learning turns data into predictions.
This matters because AI projects fail less from “bad math” and more from shaky fundamentals like messy data, unclear goals, and inconsistent processes. When you map which IT basics support your use case, you can pick a certification-aligned course path that builds real capability, not random tips.
Think of it like upgrading a kitchen. You do not buy every gadget first; you learn knife skills, organize ingredients, then follow recipes. AI works the same way: data handling first, models second, smarter decisions last.
With that roadmap in mind, a few friendly definitions will make the rest feel jargon-free, and information technology courses online can help you put those fundamentals in a steady order.
Key AI and ML Terms, Plainly Explained
These definitions help you read AI and machine learning guidance without getting stuck on vocabulary. Once you know what each term means, you can make practical choices about data, tools, and next steps with more confidence.
Supervised learning: A method where a model learns from a labeled dataset, which matters because it powers predictions like churn risk or sales forecasts.
Unsupervised learning: A method that finds patterns in unlabeled data, useful for discovering customer groups or unusual behavior when you do not know categories upfront.
Neural network: A machine learning architecture that recognizes patterns, important when problems involve complex signals like text, images, or many interacting factors.
Data preprocessing: The steps that clean and standardize raw data, critical because messy inputs can lead to misleading outputs.
Feature engineering: Turning raw fields into useful signals, important because better features often improve results more than fancier algorithms.
Model training: The process of fitting a model to past examples, essential for turning historical data into a usable decision tool.
Algorithm accuracy: A measure of how often predictions are correct, helpful for quick checks but incomplete without looking at errors and business impact.
A Simple Rhythm for AI Projects That Stick
This workflow turns AI and machine learning from “interesting ideas” into a repeatable business habit. You will move from a clear question, to reliable data, to a model you can trust, and finally to monitoring that keeps results useful as conditions change. Use it for forecasting, segmentation, anomaly checks, or decision support without reinventing the process each time.
Stage
Action
Goal
Frame the question
Define decision, metric, and constraints with stakeholders
Choose approach, split data, train baseline then iterate
A working model with documented choices
Validate and monitor
Test errors, check drift, track outcomes, set review cadence
Performance that stays aligned to business needs
Each stage feeds the next, and monitoring loops you back to refining data and features. Keep the cadence lightweight: small improvements, logged decisions, and regular check-ins beat one big “perfect” build.
Advertisements
Start Using AI in Your Data Work: 7 Beginner-Safe Practices
You don’t need a big “AI transformation” to get value. Start with small, repeatable habits that fit the basic project rhythm you already know: clean data, choose a simple model, validate, deploy, and monitor.
Pick one decision and one metric to improve: Choose a single business decision (reorder stock, follow up leads, flag late invoices) and tie it to one metric you can track weekly. This keeps your AI work grounded in outcomes, not novelty. Write a simple success rule like “reduce stockouts by 10%” or “cut response time by 1 hour,” then build your data collection and cleaning around that.
Create a “minimum clean dataset” before you model anything: Start with 20–50 rows you trust and a short data dictionary that defines each field (what it means, allowed values, and where it comes from). This prevents common AI pitfalls like training on inconsistent labels, duplicate customers, or dates in mixed formats. If the sample looks messy, fix the process upstream before you scale the model.
Make real-time data analysis “near real-time” first: If you’re new, aim for updates every 15 minutes, hourly, or daily rather than true streaming. Set a simple refresh schedule, time-stamp every record, and track data delay (how late the data arrives). You’ll still get faster decisions without the complexity of always-on pipelines.
Start with decision support, then graduate to automated decision making: Begin by having the model recommend an action and a confidence level (e.g., “likely to churn: high/medium/low”), while a person makes the final call. Once it’s consistently right, automate only the low-risk actions, like routing a ticket or sending a reminder, while keeping approvals for high-impact steps like pricing or credit decisions.
Choose scalable AI solutions by checking your foundation early: Before you expand beyond a pilot, ask whether you have a scalable technical foundation, reliable data access, consistent identifiers, versioned datasets, and a place to log model outputs. If any of those are missing, your “successful” prototype may break the moment you add more teams, more data, or more frequent updates.
Use effective data visualization that matches the decision: Pair every model output with a visual that answers one question fast. For real-time monitoring, use a simple line chart with a clear threshold; for prioritization, use a ranked bar chart; for diagnostics, use a confusion-matrix-style table. Add a “what changed since yesterday?” view so people can spot drift or sudden spikes without hunting.
Build a lightweight monitoring loop to avoid silent failures: Set two weekly checks: (1) data health (missing values, unusual spikes, delay) and (2) model health (accuracy on recent cases, rate of “unknown” outputs). Keep a short log of changes, new marketing campaigns, pricing changes, new form fields, so you can connect performance dips to real business events. This makes retraining and validation feel routine instead of reactive.
Turn AI and Machine Learning Into Better Business Decisions
It’s easy to feel stuck between wanting smarter decisions and worrying that AI and machine learning are too complex or risky to trust. A practical path is to focus on one clear AI business impact, build thoughtful machine learning adoption around reliable data and simple feedback loops, and keep judgment in the process. Done well, that becomes a data-driven competitive advantage because teams spend less time guessing and more time acting on what the data shows. Start small, stay responsible, and let results earn the right to scale. Pick one business question this week and test a lightweight AI-assisted workflow around it, tracking outcomes you already care about. A continuous learning mindset matters because the future of AI in business will keep shifting, and steady capability builds resilience.
Written by: virginia cooper
Advertisements
كيفية استخدام الذكاء الاصطناعي والتعلم الآلي لتعزيز مهاراتك في إدارة بيانات الأعمال
Advertisements
بالنسبة لأصحاب الأعمال المحلية وقادة فرق الشركات الصغيرة والمتوسطة، غالباً ما تتناثر البيانات في أماكن متعددة، من جداول البيانات وأدوات المبيعات إلى صناديق البريد الإلكتروني، مما يجعل معالجة بيانات الأعمال مهمة شاقة أسبوعياً. يكمن التحدي الأساسي في ضرورة اتخاذ القرارات بسرعة، لكن الأرقام تبدو غير متسقة أو ناقصة أو يصعب الوثوق بها. يمكن لتحويل البيانات المدعوم بالذكاء الاصطناعي أن يُرتب هذه الفوضى، كما يمكن لتطبيقات التعلم الآلي أن تساعد في رصد الأنماط التي تستحق اتخاذ إجراءات بشأنها دون الحاجة إلى خلفية في علم البيانات. مع الأساس الصحيح، يمكن لهذه القدرات أن تُحوّل العمل على البيانات من مجرد تنظيف تفاعلي إلى ابتكار رقمي مستدام في الأعمال
فهم مسار المهارات وراء نتائج الذكاء الاصطناعي
يكمن جوهر استخدام الذكاء الاصطناعي لاتخاذ قرارات أعمال أفضل في تسلسل بسيط: تعلم الأساسيات، وربطها بعملك اليومي، ثم بناء المهارات بشكل تدريجي. ابدأ بتعريف الذكاء الاصطناعي حتى تبدو “الأدوات الذكية” أقل غموضاً، ثم تعلم كيف يُحوّل التعلم الآلي البيانات إلى تنبؤات
هذا الأمر بالغ الأهمية لأن مشاريع الذكاء الاصطناعي لا تفشل عادةً بسبب “الحسابات الخاطئة”، بل بسبب ضعف الأسس، مثل البيانات غير المنظمة، والأهداف غير الواضحة، والعمليات غير المتسقة. عندما تحدد أساسيات تكنولوجيا المعلومات التي تدعم حالة استخدامك، يمكنك اختيار مسار دراسي متوافق مع الشهادات، يُنمّي قدرات حقيقية، لا مجرد نصائح عشوائية
تخيل الأمر كتحديث مطبخك. أنت لا تشتري كل الأدوات أولاً؛ بل تتعلم مهارات استخدام السكين، وتُنظم المكونات، ثم تتبع الوصفات. يعمل الذكاء الاصطناعي بنفس الطريقة: معالجة البيانات أولاً، ثم النماذج ثانياً، وأخيراً اتخاذ قرارات أكثر ذكاءً
مع وضع هذه الخطة في الاعتبار، ستجعل بعض التعريفات البسيطة بقية المصطلحات تبدو سهلة الفهم، ويمكن لدورات تكنولوجيا المعلومات عبر الإنترنت مساعدتك في ترتيب هذه الأساسيات بشكل منطقي
مصطلحات الذكاء الاصطناعي والتعلم الآلي الرئيسية، شرح مبسط
تساعدك هذه التعريفات على قراءة إرشادات الذكاء الاصطناعي والتعلم الآلي دون التشتت بالمصطلحات. بمجرد معرفة معنى كل مصطلح، يمكنك اتخاذ خيارات عملية بشأن البيانات والأدوات والخطوات التالية بثقة أكبر
التعلم الخاضع للإشراف: أسلوبٌ يتعلم فيه النموذج من مجموعة بيانات مصنفة، وهو أمرٌ بالغ الأهمية لأنه يُسهم في التنبؤات، مثل مخاطر فقدان العملاء أو توقعات المبيعات
التعلم غير الخاضع للإشراف: أسلوبٌ يكتشف الأنماط في البيانات غير المصنفة، وهو مفيدٌ لاكتشاف مجموعات العملاء أو السلوكيات غير المعتادة عندما لا تكون التصنيفات معروفة مسبقاً
الشبكة العصبية: بنيةٌ للتعلم الآلي تتعرف على الأنماط، وهي مهمةٌ عندما تتضمن المشكلات إشاراتٍ معقدةً مثل النصوص أو الصور أو العديد من العوامل المتفاعلة
معالجة البيانات الأولية: خطواتٌ لتنظيف البيانات الأولية وتوحيدها، وهي بالغة الأهمية لأن المدخلات غير المنظمة قد تؤدي إلى مخرجاتٍ مضللة
هندسة الميزات: تحويل الحقول الأولية إلى إشاراتٍ مفيدة، وهي مهمةٌ لأن الميزات الأفضل غالباً ما تُحسّن النتائج أكثر من الخوارزميات الأكثر تعقيداً
تدريب النموذج: عملية ملاءمة النموذج مع الأمثلة السابقة، وهي ضروريةٌ لتحويل البيانات التاريخية إلى أداةٍ فعّالةٍ لاتخاذ القرارات
دقة الخوارزمية: مقياس لمدى صحة التنبؤات، مفيد للتحقق السريع، ولكنه غير مكتمل دون النظر إلى الأخطاء وتأثيرها على العمل
منهجية بسيطة لمشاريع الذكاء الاصطناعي الناجحة
تحوّل هذه المنهجية الذكاء الاصطناعي والتعلم الآلي من مجرد “أفكار مثيرة للاهتمام” إلى عادة عمل متكررة. ستنتقل من سؤال واضح، إلى بيانات موثوقة، إلى نموذج جدير بالثقة، وأخيراً إلى نظام مراقبة يحافظ على فائدة النتائج مع تغير الظروف. استخدمها للتنبؤ، وتقسيم السوق، والتحقق من الحالات الشاذة، أو دعم اتخاذ القرارات دون الحاجة إلى إعادة ابتكار العملية في كل مرة
الهدف
الإجراء
المرحلة
حالة استخدام مركزة مع معايير النجاح
حدد القرار والمعيار والقيود مع أصحاب المصلحة
صياغة السؤال
بيانات يمكنك تحليلها دون مفاجآت
جمع المصادر، وتصحيح القيم المفقودة، وتوحيد التنسيقات
الجمع والتنظيف
إشارات قوية تعكس واقع الأعمال
إنشاء مدخلات ذات مغزى، وتشفير الفئات، وتجميع السجلات
بناء الميزات
نموذج عملي مع خيارات موثقة
اختر المنهجية، قسّم البيانات، درّب النموذج الأساسي ثم كرّر العملية.
الاختيار والتدريب
أداء يتماشى مع احتياجات العمل
اختبار الأخطاء، والتحقق من الانحراف، وتتبع النتائج، وتحديد وتيرة المراجعة
التحقق والمراقبة
تُغذي كل مرحلة المرحلة التي تليها، وتُساعدك عملية المراقبة على تحسين البيانات والميزات باستمرار. حافظ على وتيرة عمل بسيطة: فالتحسينات الصغيرة، والقرارات المُسجلة، والمتابعات الدورية أفضل من بناء مشروع “مثالي” ضخم
Advertisements
ابدأ باستخدام الذكاء الاصطناعي في عملك على البيانات: 7 ممارسات آمنة للمبتدئين
لست بحاجة إلى “تحول جذري” في مجال الذكاء الاصطناعي لتحقيق قيمة مضافة. ابدأ بعادات صغيرة قابلة للتكرار تتناسب مع وتيرة المشروع الأساسية التي تعرفها: تنظيف البيانات، واختيار نموذج بسيط، والتحقق من صحته، ونشره، ومراقبته
1.
اختر قرارًا واحدًا ومقياسًا واحدًا للتحسين: اختر قرارًا تجاريًا واحدًا (إعادة طلب المخزون، ومتابعة العملاء المحتملين، والإبلاغ عن الفواتير المتأخرة) واربطه بمقياس واحد يمكنك تتبعه أسبوعيًا. هذا يُبقي عملك في مجال الذكاء الاصطناعي مُرتكزًا على النتائج، وليس على التجديد. اكتب قاعدة نجاح بسيطة مثل “تقليل نفاد المخزون بنسبة 10%” أو “تقليل وقت الاستجابة بساعة واحدة”، ثم ابنِ عملية جمع البيانات وتنظيفها حول هذه القاعدة
اكتب قاعدة نجاح بسيطة مثل “تقليل نفاد المخزون بنسبة 10%” أو “تقليل وقت الاستجابة بساعة واحدة”، ثم ابنِ عملية جمع البيانات وتنظيفها حول هذه القاعدة
2.
أنشئ مجموعة بيانات أساسية نظيفة قبل البدء في أي نموذج: ابدأ بـ ٢٠ إلى ٥٠ صفًا موثوقًا بها وقاموس بيانات مختصر يُعرّف كل حقل (معناه، والقيم المسموح بها، ومصدره). هذا يمنع الوقوع في أخطاء شائعة في الذكاء الاصطناعي، مثل التدريب على تصنيفات غير متناسقة، أو بيانات عملاء مكررة، أو تواريخ بتنسيقات مختلطة. إذا بدت العينة غير منظمة، فقم بتصحيح العملية في المراحل الأولى قبل توسيع نطاق النموذج
3.
اجعل تحليل البيانات في الوقت الفعلي “شبه فوري” أولًا: إذا كنت مبتدئًا، فاستهدف التحديثات كل ١٥ دقيقة، أو كل ساعة، أو يوميًا بدلًا من البث المباشر للبيانات. حدد جدول تحديث بسيط، وقم بتسجيل وقت كل سجل، وتتبع تأخير البيانات (مدى تأخر وصولها). ستحصل على قرارات أسرع دون تعقيدات خطوط المعالجة المستمرة. ستظل تحصل على قرارات أسرع دون الحاجة إلى خطوط معالجة بيانات تعمل باستمرار
4.
ابدأ بدعم اتخاذ القرار، ثم انتقل تدريجيًا إلى اتخاذ القرار الآلي: ابدأ بجعل النموذج يُوصي بإجراء ومستوى ثقة (مثل: “احتمالية التخلي عن الخدمة: عالية/متوسطة/منخفضة”)، بينما يتخذ شخص القرار النهائي. بمجرد أن يصبح النموذج صحيحًا باستمرار، قم بأتمتة الإجراءات منخفضة المخاطر فقط، مثل توجيه تذكرة أو إرسال تذكير، مع الإبقاء على الموافقات للخطوات عالية التأثير مثل قرارات التسعير أو الائتمان
5.
اختر حلول الذكاء الاصطناعي القابلة للتطوير من خلال التحقق من بنيتك التحتية مبكرًا: قبل التوسع إلى ما بعد المرحلة التجريبية، اسأل نفسك ما إذا كانت لديك بنية تحتية تقنية قابلة للتطوير، وإمكانية وصول موثوقة إلى البيانات، ومعرّفات متسقة، ومجموعات بيانات مُؤرشفة، ومكان لتسجيل مخرجات النموذج. إذا كان أي من هذه العناصر مفقودًا، فقد يتعطل نموذجك الأولي “الناجح” بمجرد إضافة المزيد من الفرق أو المزيد من البيانات أو التحديثات المتكررة
6.
استخدم تصورًا فعالًا للبيانات يتناسب مع القرار: اربط كل مخرج من مخرجات النموذج بتصور يُجيب على سؤال واحد بسرعة. للمراقبة في الوقت الفعلي، استخدم مخططًا خطيًا بسيطًا بعتبة واضحة. لتحديد الأولويات، استخدم مخططًا شريطيًا مُرتبًا؛ وللتشخيص، استخدم جدولًا على غرار مصفوفة الارتباك. أضف عرضًا بعنوان “ما الذي تغير منذ الأمس؟” ليتمكن المستخدمون من رصد أي انحرافات أو ارتفاعات مفاجئة دون الحاجة إلى البحث المُطوّل
7.
أنشئ حلقة مراقبة بسيطة لتجنب الأعطال الصامتة: حدد فحصين أسبوعيين: (1) سلامة البيانات (القيم المفقودة، الارتفاعات غير المعتادة، التأخير) و(2) سلامة النموذج (الدقة في الحالات الحديثة، معدل المخرجات “غير المعروفة”). احتفظ بسجل مختصر للتغييرات، والحملات التسويقية الجديدة، وتغييرات الأسعار، وحقول النماذج الجديدة، لتتمكن من ربط انخفاضات الأداء بأحداث العمل الحقيقية. هذا يجعل إعادة التدريب والتحقق عملية روتينية وليست رد فعلية
حوّل الذكاء الاصطناعي والتعلم الآلي إلى قرارات أعمال أفضل
من السهل الشعور بالحيرة بين الرغبة في اتخاذ قرارات أكثر ذكاءً والقلق من أن الذكاء الاصطناعي والتعلم الآلي معقدان للغاية أو ينطويان على مخاطر كبيرة. يتمثل المسار العملي في التركيز على تأثير واضح للذكاء الاصطناعي على الأعمال، وبناء تبني مدروس للتعلم الآلي قائم على بيانات موثوقة وحلقات تغذية راجعة بسيطة، مع الحفاظ على التقدير السليم في هذه العملية. إذا أُحسِنَ تنفيذ ذلك، فإنه يُصبح ميزة تنافسية قائمة على البيانات، لأن الفرق تُقلل من وقت التخمين وتُركز أكثر على العمل بناءً على ما تُظهره البيانات. ابدأ بخطوات صغيرة، وتحمّل المسؤولية، ودع النتائج تُؤهلك للتوسع. اختر سؤالًا تجاريًا واحدًا هذا الأسبوع، واختبر سير عمل بسيطًا مدعومًا بالذكاء الاصطناعي، مع تتبع النتائج التي تهمك بالفعل. إن عقلية التعلم المستمر مهمة لأن مستقبل الذكاء الاصطناعي في الأعمال التجارية سيظل متغيّرًا، والقدرة الثابتة تُعزز المرونة
Introduction: The Great Transformation of Intelligent Work
The job market for AI and data scientists in 2026 represents one of the most significant workforce transformations in modern history. Unlike previous technological revolutions that primarily replaced manual labor, artificial intelligence is reshaping cognitive and analytical professions. This has created a paradoxical reality: while AI automates many analytical tasks that data scientists once performed manually, it simultaneously increases demand for professionals capable of designing, controlling, and optimizing intelligent systems. The result is not a collapse of opportunity, but a restructuring of value, where shallow technical knowledge is becoming obsolete while deep expertise is becoming exponentially more valuable.
Organizations today no longer treat data science as an experimental function or an optional innovation layer. Instead, AI has become foundational infrastructure, comparable to electricity or the internet. Companies that fail to integrate AI into their operations face measurable competitive disadvantages, which has forced entire industries to aggressively recruit AI-capable professionals. This structural shift has elevated AI and data science careers into some of the most strategically important roles in the global economy.
This transformation is driven by several irreversible technological and economic forces:
The exponential growth of global data volume
The widespread adoption of machine learning across industries
Competitive pressure forcing companies to automate decision-making
The emergence of generative AI as a productivity multiplier
The Demand Explosion: Why AI and Data Science Jobs Continue to Grow
Despite fears of automation, the demand for AI and data science professionals has not decreased. Instead, it has accelerated significantly. The key reason lies in the distinction between using AI and building AI. While AI tools can automate routine analysis, organizations still require highly skilled professionals to design models, ensure reliability, manage infrastructure, and align AI systems with business objectives.
In 2026, virtually every technology-driven company is transitioning into an AI-first organization. This means AI is no longer confined to research labs or specialized departments. It now powers core operational functions, including customer interaction, logistics optimization, fraud detection, and strategic forecasting. This universal adoption has created sustained demand across multiple industries, making AI expertise one of the most resilient career paths available.
What makes this demand particularly durable is that AI systems require continuous monitoring, retraining, optimization, and integration. Unlike traditional software, AI systems degrade over time as real-world data evolves. This creates permanent demand for skilled professionals rather than temporary hiring waves.
The strongest drivers of job demand include:
Enterprise-wide AI adoption across all sectors
Continuous need to retrain and maintain machine learning models
Growing dependence on predictive analytics for business strategy
Expansion of AI-powered automation systems
The Role Evolution: From Data Analyst to AI Architect
The role of the data scientist has undergone a profound transformation. In the past, data scientists primarily focused on analyzing historical data and generating reports. In 2026, the role has evolved toward designing intelligent systems that actively influence real-time decision-making. This shift represents a transition from passive analysis to active system design.
Modern data professionals are increasingly responsible for building production-grade machine learning pipelines, deploying models into cloud environments, and integrating AI into live business processes. This requires a deeper understanding of software engineering, cloud architecture, and distributed computing. The modern AI professional is no longer just an analyst but an architect of intelligent infrastructure.
This evolution has produced several specialized roles that reflect increasing technical complexity:
AI Engineer focused on building and deploying intelligent systems
Machine Learning Engineer responsible for production model pipelines
LLM Engineer specializing in large language model integration
AI Infrastructure Engineer managing large-scale model deployment
Applied AI Scientist focused on solving domain-specific problems
Advertisements
The Entry-Level Reality: Higher Barriers, Greater Rewards
One of the most misunderstood aspects of the 2026 job market is the perceived saturation of entry-level roles. While it is true that entry-level hiring has become more competitive, this does not reflect reduced demand. Instead, it reflects increased expectations. Employers now expect candidates to demonstrate practical, real-world capability rather than purely academic knowledge.
This shift has occurred because AI tools themselves can perform many basic tasks that junior data scientists once handled. Tasks such as exploratory data analysis, basic model training, and simple visualizations can now be partially automated. As a result, employers place greater emphasis on candidates who can design complete solutions rather than perform isolated technical tasks.
Candidates who successfully enter the field typically demonstrate:
Hands-on project experience with real datasets
Understanding of machine learning deployment workflows
Ability to integrate AI into real applications
Strong programming and system design skills
Salary Trends: Why AI Professionals Remain Among the Highest-Paid Workers
The salary structure of AI and data science careers reflects a fundamental economic imbalance between supply and demand. There are significantly fewer qualified AI professionals than the market requires. This talent shortage has created intense competition among employers, resulting in exceptionally high compensation levels.
Unlike many professions where salaries plateau, AI professionals often see continuous salary growth as their expertise deepens. This is because advanced AI work requires years of accumulated technical and practical experience that cannot be easily replaced or automated.
The highest-earning professionals typically possess expertise in:
Machine learning system design and deployment
Cloud computing and distributed infrastructure
Large language model integration
Applied AI problem-solving in real industries
The Most Valuable Skills in the 2026 Market
The defining characteristic of successful AI professionals in 2026 is not tool familiarity, but systems thinking. Employers prioritize individuals who understand how AI systems function end-to-end rather than those who only understand isolated components. This includes data ingestion, model training, evaluation, deployment, monitoring, and optimization.
Programming remains a foundational skill, but it is no longer sufficient on its own. The highest-value professionals combine programming expertise with mathematical understanding, engineering discipline, and business awareness. This multidisciplinary capability allows them to design systems that create measurable organizational value.
The most critical skills include:
Python programming and software engineering principles
Machine learning model development and optimization
Cloud platforms such as AWS, Azure, and Google Cloud
Large language model integration and prompt engineering
Data engineering and pipeline construction
Industry-Wide Adoption: AI Is No Longer Limited to Tech Companies
One of the most important developments in the 2026 job market is the expansion of AI beyond traditional technology companies. Healthcare organizations use AI to detect disease earlier, financial institutions use AI to prevent fraud, and manufacturing companies use AI to predict equipment failures before they occur.
This widespread adoption has diversified career opportunities, allowing AI professionals to work in virtually any industry. This also increases career stability, as demand is no longer tied to the health of a single sector.
Industries with the strongest AI hiring demand include:
Healthcare and biotechnology
Financial services and banking
E-commerce and retail
Manufacturing and logistics
Cybersecurity and defense
The Future Outlook: Why AI Careers Will Remain Dominant Through 2030
The long-term outlook for AI and data science careers remains exceptionally strong because AI adoption is still in its early stages. Most organizations have only implemented basic AI capabilities, leaving significant room for expansion. As AI systems become more sophisticated, the need for skilled professionals will continue to grow.
The future of AI careers will increasingly favor professionals who can build scalable, reliable, and efficient intelligent systems. The ability to design AI infrastructure will become one of the most valuable technical skills of the decade.
Key long-term trends include:
Continued job growth and salary increases
Increasing specialization within AI roles
Greater integration of AI into everyday business operations
Rising importance of AI system design and architecture
Conclusion: A Golden Era for Those Who Adapt
The AI and data science job market in 2026 is not shrinking—it is maturing. The field is transitioning from experimental adoption to foundational infrastructure. This transition is increasing the value of deep expertise while reducing the value of superficial knowledge.
Professionals who adapt by developing strong engineering skills, real-world experience, and system-level thinking will find themselves in one of the most secure and lucrative career paths available. AI is not replacing intelligent professionals—it is amplifying their impact and increasing their importance.
The future belongs to those who build intelligence, not just use it.
Advertisements
مستقبل وظائف الذكاء الاصطناعي وعلوم البيانات
الطلب والمهارات والفرص في عام 2026
Advertisements
مقدمة: التحول الكبير في العمل الذكي
يمثل سوق العمل لعلماء الذكاء الاصطناعي والبيانات في عام 2026 أحد أهم التحولات في القوى العاملة في التاريخ الحديث، فعلى عكس الثورات التكنولوجية السابقة التي حلت محل العمل اليدوي في المقام الأول يُعيد الذكاء الاصطناعي تشكيل المهن المعرفية والتحليلية، وقد خلق هذا واقعاً متناقضاً : فبينما يُؤتمت الذكاء الاصطناعي العديد من المهام التحليلية التي كان علماء البيانات يؤدونها يدوياً فإنه في الوقت نفسه يزيد الطلب على المتخصصين القادرين على تصميم الأنظمة الذكية والتحكم بها وتحسينها، والنتيجة ليست انهياراً للفرص بل إعادة هيكلة للقيمة حيث تصبح المعرفة التقنية السطحية قديمة الطراز بينما تزداد قيمة الخبرة العميقة بشكل كبير
لم تعد المؤسسات اليوم تتعامل مع علم البيانات كوظيفة تجريبية أو طبقة ابتكار اختيارية، بل أصبح الذكاء الاصطناعي بنية تحتية أساسية تُضاهي الكهرباء أو الإنترنت، وتواجه الشركات التي تفشل في دمج الذكاء الاصطناعي في عملياتها عيوباً تنافسية ملموسة مما أجبر قطاعات بأكملها على استقطاب متخصصين ذوي قدرات في مجال الذكاء الاصطناعي بقوة، وقد رفع هذا التحول الهيكلي من شأن وظائف الذكاء الاصطناعي وعلم البيانات لتصبح من بين أهم الأدوار الاستراتيجية في الاقتصاد العالمي
:يُعزى هذا التحول إلى عدة عوامل تكنولوجية واقتصادية
النمو الهائل لحجم البيانات العالمي •
الانتشار الواسع لتقنيات التعلم الآلي في مختلف القطاعات •
ضغوط المنافسة التي تُجبر الشركات على أتمتة عمليات اتخاذ القرار •
انفجار الطلب: لماذا تستمر وظائف الذكاء الاصطناعي وعلوم البيانات في النمو؟
على الرغم من المخاوف من الأتمتة لم يتراجع الطلب على متخصصي الذكاء الاصطناعي وعلوم البيانات بل ازداد بشكل ملحوظ، ويكمن السبب الرئيسي في الفرق بين استخدام الذكاء الاصطناعي وبنائه، فبينما تستطيع أدوات الذكاء الاصطناعي أتمتة التحليلات الروتينية لا تزال المؤسسات بحاجة إلى متخصصين ذوي مهارات عالية لتصميم النماذج وضمان موثوقيتها وإدارة البنية التحتية ومواءمة أنظمة الذكاء الاصطناعي مع أهداف العمل
في عام 2026 ستتحول جميع الشركات التقنية تقريباً إلى مؤسسات تعتمد على الذكاء الاصطناعي بشكل أساسي، وهذا يعني أن الذكاء الاصطناعي لم يعد محصوراً في مختبرات الأبحاث أو الأقسام المتخصصة بل أصبح يُشغّل وظائف تشغيلية أساسية بما في ذلك التفاعل مع العملاء وتحسين الخدمات اللوجستية وكشف الاحتيال والتنبؤ الاستراتيجي، أدى هذا التبني العالمي إلى خلق طلب مستدام في مختلف القطاعات مما جعل الخبرة في مجال الذكاء الاصطناعي من أكثر المسارات الوظيفية استدامةً
ما يزيد من استدامة هذا الطلب هو أن أنظمة الذكاء الاصطناعي تتطلب مراقبة مستمرة وإعادة تدريب وتحسين وتكامل، فعلى عكس البرامج التقليدية تتراجع أنظمة الذكاء الاصطناعي بمرور الوقت مع تطور بيانات العالم الحقيقي، وهذا يخلق طلباً دائماً على المتخصصين المهرة بدلاً من موجات التوظيف المؤقتة
:تشمل أبرز محركات الطلب على الوظائف ما يلي
تبني الذكاء الاصطناعي على مستوى المؤسسات في جميع القطاعات •
الحاجة المستمرة لإعادة تدريب نماذج التعلم الآلي وصيانتها •
الاعتماد المتزايد على التحليلات التنبؤية في استراتيجيات الأعمال •
توسع أنظمة الأتمتة المدعومة بالذكاء الاصطناعي •
تطور الدور: من محلل بيانات إلى مهندس معماري للذكاء الاصطناعي
شهد دور عالم البيانات تحولاً جذرياً، ففي الماضي كان علماء البيانات يركزون بشكل أساسي على تحليل البيانات التاريخية وإعداد التقارير، أما في عام 2026 فقد تطور دورهم نحو تصميم أنظمة ذكية تؤثر بشكل فعال على عملية صنع القرار في الوقت الفعلي، ويمثل هذا التحول انتقالاً من التحليل السلبي إلى تصميم الأنظمة الفعال
يتزايد دور متخصصي البيانات المعاصرين في بناء بنى تحتية متطورة للتعلم الآلي ونشر النماذج في بيئات الحوسبة السحابية ودمج الذكاء الاصطناعي في عمليات الأعمال الحية، ويتطلب ذلك فهماً أعمق لهندسة البرمجيات وبنية الحوسبة السحابية والحوسبة الموزعة، فلم يعد متخصص الذكاء الاصطناعي المعاصر مجرد محلل بل أصبح مهندساً معمارياً للبنية التحتية الذكية
وقد أدى هذا التطور إلى ظهور العديد من الأدوار المتخصصة التي تعكس التعقيد التقني المتزايد ومنها
مهندس ذكاء اصطناعي متخصص في بناء ونشر الأنظمة الذكية •
مهندس تعلم آلي مسؤول عن بنى تحتية النماذج الإنتاجية •
(LLM) مهندس تكامل نماذج اللغة •
متخصص في تكامل نماذج اللغة واسعة النطاق
مهندس بنية تحتية للذكاء الاصطناعي يدير نشر النماذج على نطاق واسع •
عالم ذكاء اصطناعي تطبيقي متخصص في حل المشكلات الخاصة بمجالات محددة •
واقع الوظائف المبتدئة: عوائق أكبر، مكافآت أعظم
من أكثر جوانب سوق العمل سوء فهماً في عام 2026 هو الاعتقاد السائد بتشبع الوظائف المبتدئة، فصحيح أن المنافسة على هذه الوظائف أصبحت أشد إلا أن هذا لا يعكس انخفاضاً في الطلب بل يعكس ارتفاعاً في التوقعات وعليه يتوقع أصحاب العمل الآن من المرشحين إظهار قدرات عملية واقعية بدلاً من المعرفة الأكاديمية البحتة
وقد حدث هذا التحول لأن أدوات الذكاء الاصطناعي نفسها قادرة على أداء العديد من المهام الأساسية التي كان يتولاها علماء البيانات المبتدئون، مهام مثل تحليل البيانات الاستكشافي والتدريب الأساسي للنماذج والتصورات البسيطة يمكن الآن أتمتتها جزئياً، ونتيجة لذلك يولي أصحاب العمل اهتماماً أكبر للمرشحين القادرين على تصميم حلول متكاملة بدلاً من أداء مهام تقنية منفصلة
:عادةً ما يُظهر المرشحون الناجحون في هذا المجال ما يلي
خبرة عملية في مشاريع باستخدام مجموعات بيانات حقيقية •
فهمٌ لآليات نشر تطبيقات التعلّم الآلي •
القدرة على دمج الذكاء الاصطناعي في تطبيقات عملية •
مهارات برمجة وتصميم أنظمة قوية •
اتجاهات الرواتب: لماذا يبقى متخصصو الذكاء الاصطناعي من بين الأعلى أجراً؟
يعكس هيكل رواتب وظائف الذكاء الاصطناعي وعلوم البيانات خللاً اقتصادياً جوهرياً بين العرض والطلب، يوجد عدد أقل بكثير من المتخصصين المؤهلين في مجال الذكاء الاصطناعي مقارنةً بمتطلبات السوق وقد أدى هذا النقص في الكفاءات إلى منافسة شديدة بين أصحاب العمل مما أسفر عن مستويات تعويضات مرتفعة للغاية
على عكس العديد من المهن التي تستقر فيها الرواتب غالباً ما يشهد متخصصو الذكاء الاصطناعي نمواً مستمراً في رواتبهم مع تعمّق خبراتهم، وذلك لأن العمل المتقدم في مجال الذكاء الاصطناعي يتطلب سنوات من الخبرة التقنية والعملية المتراكمة التي لا يمكن استبدالها أو أتمتتها بسهولة
:يتمتع المحترفون الأعلى دخلاً عادةً بخبرة في المجالات التالية
تصميم ونشر أنظمة التعلم الآلي •
الحوسبة السحابية والبنية التحتية الموزعة •
دمج نماذج اللغة الضخمة •
حل مشكلات الذكاء الاصطناعي التطبيقي في قطاعات حقيقية •
Advertisements
المهارات الأكثر قيمة في سوق 2026
إن السمة المميزة لمحترفي الذكاء الاصطناعي الناجحين في عام 2026 ليست الإلمام بالأدوات بل التفكير المنظومي، يُعطي أصحاب العمل الأولوية للأفراد الذين يفهمون كيفية عمل أنظمة الذكاء الاصطناعي بشكل شامل بدلاً من أولئك الذين يفهمون مكونات منفصلة فقط، يشمل ذلك استيعاب البيانات وتدريب النماذج وتقييمها ونشرها ومراقبتها وتحسينها
لا تزال البرمجة مهارة أساسية لكنها لم تعد كافية بمفردها، إذ يجمع المحترفون الأعلى قيمة بين خبرة البرمجة والفهم الرياضي والانضباط الهندسي والوعي التجاري، تُمكّنهم هذه القدرة متعددة التخصصات من تصميم أنظمة تُحقق قيمة تنظيمية ملموسة
:المهارات الأكثر قيمة تشمل أهم المهارات ما يلي
برمجة بايثون ومبادئ هندسة البرمجيات •
تطوير نماذج التعلم الآلي وتحسينها •
AWS و Azure و Google Cloud منصات الحوسبة السحابية مثل •
دمج نماذج اللغات الكبيرة وهندسة البيانات الفورية •
هندسة البيانات وبناء خطوط نقل البيانات •
انتشار واسع النطاق للذكاء الاصطناعي: لم يعد مقتصراً على شركات التكنولوجيا
يُعدّ توسّع نطاق استخدام الذكاء الاصطناعي ليشمل قطاعات أخرى غير شركات التكنولوجيا التقليدية أحد أهمّ التطورات في سوق العمل لعام 2026
تستخدم مؤسسات الرعاية الصحية الذكاء الاصطناعي للكشف المبكر عن الأمراض •
تستخدمه المؤسسات المالية لمنع الاحتيال •
تستخدمه شركات التصنيع للتنبؤ بأعطال المعدات قبل وقوعها •
وقد أدّى هذا الانتشار الواسع إلى تنويع الفرص الوظيفية ما يسمح لمتخصصي الذكاء الاصطناعي بالعمل في أيّ قطاع تقريباً كما يُعزّز هذا الاستقرار الوظيفي إذ لم يعد الطلب مرتبطاً بازدهار قطاع واحد
: تشمل القطاعات التي تشهد أعلى طلب على توظيف متخصصي الذكاء الاصطناعي ما يلي
الرعاية الصحية والتكنولوجيا الحيوية •
الخدمات المالية والمصرفية •
التجارة الإلكترونية والتجزئة •
التصنيع والخدمات اللوجستية •
الأمن السيبراني والدفاع •
التوقعات المستقبلية: لماذا ستبقى وظائف الذكاء الاصطناعي مهيمنة حتى عام 2030؟
لا تزال التوقعات طويلة الأجل لوظائف الذكاء الاصطناعي وعلوم البيانات قوية للغاية لأنّ استخدام الذكاء الاصطناعي لا يزال في مراحله الأولى، وقد طبّقت معظم المؤسسات قدرات أساسية فقط في مجال الذكاء الاصطناعي ما يترك مجالاً واسعاً للتوسّع، ومع ازدياد تطوّر أنظمة الذكاء الاصطناعي، ستستمر الحاجة إلى المتخصصين المهرة في النمو
سيُفضّل مستقبل وظائف الذكاء الاصطناعي بشكل متزايد المحترفين القادرين على بناء أنظمة ذكية قابلة للتطوير وموثوقة وفعّالة وستصبح القدرة على تصميم بنية تحتية للذكاء الاصطناعي من أهم المهارات التقنية المطلوبة في هذا العقد
: تشمل الاتجاهات الرئيسية طويلة الأجل ما يلي
استمرار نمو الوظائف وزيادة الرواتب •
تزايد التخصص في وظائف الذكاء الاصطناعي •
دمج أكبر للذكاء الاصطناعي في العمليات التجارية اليومية •
تزايد أهمية تصميم وهيكلة أنظمة الذكاء الاصطناعي •
الخلاصة: عصر ذهبي لمن يُحسن الاستعمال
سوق العمل في مجال الذكاء الاصطناعي وعلوم البيانات في عام 2026 لا يتقلص بل ينضج، ينتقل هذا المجال من مرحلة التبني التجريبي إلى مرحلة البنية التحتية الأساسية، هذا الانتقال يزيد من قيمة الخبرة المتعمقة ويقلل من قيمة المعرفة السطحية
سيجد المحترفون الذين يتكيفون من خلال تطوير مهارات هندسية قوية وخبرة عملية وتفكير على مستوى الأنظمة أنفسهم في أحد أكثر المسارات الوظيفية أماناً وربحية، لا يحل الذكاء الاصطناعي محل المحترفين الأذكياء بل يُعزز تأثيرهم ويزيد من أهميتهم
Artificial Intelligence has exploded into public consciousness with products like ChatGPT and Google Gemini, but the AI ecosystem is far larger and far more powerful than most people realize. In 2026, we’re seeing a second wave of innovation — tools that don’t just respond to text prompts, but truly augment human potential across design, engineering, creative workflows, and knowledge discovery.
If you think you’ve seen what AI can really do, think again.
In this article, we’ll dive into next-generation AI tools that are already transforming how professionals work — from automated 3D creation to real-time video synthesis, on-the-fly coding copilots, and AI companions that understand context at a level previously thought impossible. These are tools that leap beyond conversational agents and into the realm of true AI assistance.
1. Synthesia Edge — Real-Time AI Video Generation
Imagine creating full videos just by describing a scene — including dynamic camera movement, actors, and sound. That’s what Synthesia Edge offers.
Unlike typical video tools that require timelines and editing skills, Synthesia Edge lets you type: “Make a 30-second training video about workplace safety with a confident host and animated charts.” And it instantly generates a full HD video — complete with speech, expressions, and visuals tailored to your script.
Use Case: Corporate training videos in minutes, global marketing content localized instantly, personalized video ads on demand.
2. NeuralIDE — The AI Software Engineer
NeuralIDE isn’t just a code assistant — it’s a self-improving developer partner.
Give it a product spec, and it:
Writes code
Writes tests
Refactors existing code
Generates documentation
Suggests performance optimizations
It understands context across entire repositories — not just isolated snippets — which means it can fix bugs autonomously and propose architecture improvements.
Use Case: Reduce development time by 50%+ for SaaS startups, internal tooling, and DevOps automation.
3. InferVision – AI That Thinks in Context, Not Prompts
Most AI tools still struggle with context continuity — especially when a project spans dozens of tasks.
InferVision solves this by storing a persistent memory of your workspace:
Project history
File dependencies
Prior conversations and decisions
Style preferences
This memory isn’t static text — it’s a context graph that the AI uses to reason about your intentions over time.
Use Case: Writers, designers, and engineers who need deeper continuity without repeating instructions.
Advertisements
4. PolyMatter — Instant 3D Asset Generator
Traditionally, 3D modeling is a complex, time-intensive process. PolyMatter flips that on its head by letting you type descriptions like:
“Create a futuristic racing drone”
“Generate modular furniture with customizable textures”
“Produce a sci-fi city block in Blender format”
And it instantly produces fully rigged, textured, and game-ready 3D assets.
Use Case: Game design, AR/VR prototyping, architectural visualization, rapid product mockups.
5. HarmoniQ — AI Music Composer & Sound Designer
Forget generic AI music loops; HarmoniQ composes original scores based on your emotional direction:
“Energetic, rising soundtrack for a product launch”
“Calm ambient background for meditation app”
“Dramatic orchestral theme for cinematic trailer”
It even tailors the music to your video’s timing, pacing transitions, and emotional cues.
Use Case: Indie filmmakers, podcasters, app developers, and content creators.
6. QuantaMind — Automatic Data Scientist in Your Browser
QuantaMind doesn’t just generate charts — it analyzes, interprets, and narrates your data story.
Key features:
Predictive modeling with confidence intervals
Natural-language reporting
Automated anomaly detection
Data cleaning and feature suggestion
Just upload your spreadsheet and ask questions like: “What’s driving sales growth this quarter?” …and it replies in insightful, human-like explanations.
Use Case: Business analysts, founders, and researchers who need expert analytics without writing a single line of code.
7. Memora AI — Your AI Memory Assistant
Memora goes beyond note-taking — it remembers your work and decisions, organizing them semantically across weeks and months.
It can:
Recall past ideas
Resurface relevant insights at the right time
Connect themes across different projects
Ask it things like:
“What was the main feedback from my client last week?” …and it retrieves the exact context from your communications.
Use Case: Project managers, consultants, product teams.
Conclusion: Welcome to AI 2.0
The era of simple conversational AI is already behind us. What’s emerging now are purpose-built AI systems that act as partners — not tools:
Creating entire media assets automatically
Writing and optimizing software
Reasoning across complex organizational memory
Producing data insights without human scripting
If you want to stay ahead — whether as a creator, developer, entrepreneur, or executive — exploring these next-generation AI tools should be priority #1.
The question is no longer “What can AI do?” It’s now “What can you do with AI?”
Advertisements
ChatGPTوداعاً
هذه الأدوات الجديدة هي المستقبل الحقيقي للذكاء الاصطناعي
Advertisements
مقدمة: آفاق جديدة للذكاء الاصطناعي
لقد انتشر الذكاء الاصطناعي على نطاق واسع في الوعي العام
Google Geminiو ChatGPT بفضل منتجات مثل
لكن منظومة الذكاء الاصطناعي أوسع بكثير وأكثر قوة مما يدركه معظم الناس، ففي هذا العام نشهد موجة ثانية من الابتكار، أدوات لا تقتصر على الاستجابة للنصوص فحسب بل تُعزز القدرات البشرية في مجالات التصميم والهندسة وسير العمل الإبداعي واكتشاف المعرفة
إذا كنت تعتقد أنك رأيت كل ما يمكن للذكاء الاصطناعي فعله فمن الأفضل لك أن تراجع معلوماتك
في هذه المقالة سنتعمق في أدوات الجيل القادم من الذكاء الاصطناعي التي تُحدث تحولاً جذرياً في أساليب عمل المحترفين بدءاً من إنشاء النماذج ثلاثية الأبعاد المؤتمتة مروراً بتوليف الفيديو في الوقت الفعلي ووصولاً إلى مساعدي البرمجة الفوريين ورفقاء الذكاء الاصطناعي الذين يفهمون السياق بمستوى كان يُعتقد سابقاً أنه مستحيل، هذه أدوات تتجاوز مفهوم وكلاء المحادثة لتُصبح بمثابة مساعدة حقيقية للذكاء الاصطناعي
1. إنشاء فيديوهات بتقنية الذكاء الاصطناعي في الوقت الفعلي – Synthesia Edge
تخيل إنشاء فيديوهات كاملة بمجرد وصف مشهد بما في ذلك حركة الكاميرا الديناميكية والممثلين والصوت، هذا ما توفره لك هذه الأداة
:على عكس أدوات الفيديو التقليدية التي تتطلب جداول زمنية ومهارات تحرير فتتيح لك هذه الأداة كتابة
“أنشئ فيديو تدريبياً مدته ٣٠ ثانية حول السلامة في مكان العمل مع مقدم واثق ورسوم بيانية متحركة”
وسيقوم البرنامج فوراً بإنشاء فيديو عالي الدقة بالكامل مع الكلام والتعبيرات والصور المصممة خصيصاً لنصك
: حالة الاستخدام
فيديوهات تدريبية للشركات في دقائق ومحتوى تسويقي عالمي مُترجم فورياً وإعلانات فيديو مخصصة عند الطلب
٢. NeuralIDE – مهندس برمجيات الذكاء الاصطناعي
ليس مجرد مساعد كتابة أكواد بل هو شريك تطوير ذاتي
: أعطه مواصفات المنتج، وسيقوم بما يلي
كتابة التعليمات البرمجية •
كتابة الاختبارات •
إعادة هيكلة التعليمات البرمجية الحالية •
إنشاء الوثائق •
اقتراح تحسينات على الأداء •
يفهم السياق عبر المستودعات بأكملها – وليس مجرد أجزاء معزولة – مما يعني أنه يستطيع إصلاح الأخطاء تلقائياً واقتراح تحسينات على بنية النظام
: حالة الاستخدام
تقليل وقت التطوير بنسبة 50% أو أكثر للشركات الناشئة
(SaaS) في مجال البرمجيات كخدمة
(DevOps) والأدوات الداخلية وأتمتة عمليات التطوير والنشر
3. InferVision – ذكاء اصطناعي يفكر في السياق لا في التعليمات
لا تزال معظم أدوات الذكاء الاصطناعي تعاني من مشكلة استمرارية السياق – خاصةً عندما يمتد المشروع على عشرات المهام
تحل هذه الأداة المشكلة المذكورة من خلال تخزين ذاكرة دائمة لمساحة عملك
سجل المشروع •
تبعيات الملفات •
المحادثات والقرارات السابقة •
تفضيلات الأسلوب •
هذه الذاكرة ليست نصاً ثابتاً – إنها رسم بياني للسياق يستخدمه الذكاء الاصطناعي لفهم نواياك بمرور الوقت
: حالة الاستخدام
الكتّاب والمصممون والمهندسون الذين يحتاجون إلى استمرارية أعمق دون تكرار التعليمات
Advertisements
٤. PolyMatter – مولد أصول ثلاثية الأبعاد فوري
عادةً ما يكون تصميم النماذج ثلاثية الأبعاد عملية معقدة وتستغرق وقتاً طويلاً، وهنا يأتي دور هذه الأداة لتُغيّر هذه المعادلة تماماً إذ تُتيح لك كتابة أوصاف مثل
“أنشئ طائرة سباق مستقبلية بدون طيار “
“أنشئ أثاثاً معيارياً بنسيج قابل للتخصيص “
“أنتج مبنى سكنياً خيالياً علمياً بصيغة بلندر “
ويُنتج على الفور أصولاً ثلاثية الأبعاد جاهزة تماماً للألعاب مع هيكل عظمي ونسيج مناسب
: حالات الاستخدام
تصميم الألعاب، النماذج الأولية للواقع المعزز/الواقع الافتراضي، التصور المعماري، نماذج المنتجات السريعة
٥. HarmoniQ – مُلحّن موسيقى ومصمم صوت يعمل بالذكاء الاصطناعي
انسَ حلقات الموسيقى العامة التي تعمل بالذكاء الاصطناعي، إذ تُؤلّف هذه الأداة موسيقى تصويرية أصلية بناءً على توجهك العاطفي
“موسيقى تصويرية حيوية ومتصاعدة لإطلاق منتج”
“موسيقى خلفية هادئة لتطبيق تأمل”
“موسيقى أوركسترالية مؤثرة لعرض دعائي سينمائي”
بل إنه يُخصّص الموسيقى لتتناسب مع توقيت الفيديو وإيقاع الانتقالات والإشارات العاطفية
: حالات الاستخدام
صانعو الأفلام المستقلون ومنتجو البودكاست ومطورو التطبيقات ومنشئو المحتوى
6. QuantaMind – عالم بيانات آلي في متصفحك
لا يقتصر دور هذه الأداة على إنشاء الرسوم البيانية فحسب بل يُحلّل بياناتك ويُفسّرها ويُقدّمها بأسلوب سردي
:الميزات الرئيسية
نمذجة تنبؤية مع فترات ثقة •
تقارير بلغة طبيعية •
كشف تلقائي للحالات الشاذة •
تنظيف البيانات واقتراح الميزات •
: ما عليك سوى تحميل جدول البيانات الخاص بك وطرح أسئلة مثل
“ما الذي يُحفّز نمو المبيعات هذا الربع؟”
وسيُجيبك بتفسيرات ثاقبة تُشبه التفسيرات البشرية
: حالة الاستخدام
محللو الأعمال، والمؤسسون، والباحثون الذين يحتاجون إلى تحليلات متخصصة دون كتابة سطر واحد من التعليمات البرمجية
7. Memora AI – مساعدك الذكي للذاكرة
يتجاوز ميمورا مجرد تدوين الملاحظات فهو يتذكر عملك وقراراتك وينظمها دلالياً على مدار الأسابيع والأشهر
: إمكانياته
استرجاع الأفكار السابقة •
إعادة إبراز الأفكار المهمة في الوقت المناسب •
ربط المواضيع بين المشاريع المختلفة •
:اسأله أسئلة مثل
“ما هي أبرز ملاحظات عميلي الأسبوع الماضي؟”
وسيسترجع السياق الدقيق من اتصالاتك
: حالة الاستخدام
مديرو المشاريع، والمستشارون، وفرق المنتجات
: الخلاصة
مرحباً بكم في الجيل الثاني من الذكاء الاصطناعي
لقد ولّى زمن الذكاء الاصطناعي التفاعلي البسيط، فما يتبلور الآن هو أنظمة ذكاء اصطناعي مصممة خصيصاً لتكون شريكة لا مجرد أداة
إنشاء محتوى إعلامي كامل تلقائياً •
كتابة البرامج وتحسينها •
تحليل البيانات المعقدة في المؤسسات •
استخلاص رؤى قيّمة من البيانات دون الحاجة إلى تدخل بشري •
إذا كنت ترغب في البقاء في الصدارة – سواء كنت مبدعاً أو مطوراً أو رائد أعمال أو مديراً تنفيذياً فإن استكشاف أدوات الذكاء الاصطناعي من الجيل التالي يجب أن يكون على رأس أولوياتك
لم يعد السؤال ” ما الذي يمكن للذكاء الاصطناعي فعله؟”
Most people open ChatGPT and type whatever comes to mind — a quick caption, a short email, maybe an idea for a blog post. I did the same at first. It felt useful, efficient, even impressive. But it wasn’t profitable. The turning point came when I stopped treating AI as a convenience tool and started treating it as a production engine. Instead of asking random questions, I engineered one precise, strategic prompt designed to create something monetizable. That single shift in thinking — from consumption to asset creation — is what allowed me to generate hundreds of dollars in side income from one structured instruction. The tool didn’t change. My approach did.
The Prompt That Changed Everything
The prompt itself was not magical. It was intentional. Instead of asking for generic “business ideas,” I instructed ChatGPT to act as a business consultant and design a digital offer targeted at a clearly defined audience with a measurable pain point. The key was specificity. I defined the niche, the problem, the expected outcome, and the delivery format. That forced the AI to produce structured output instead of surface-level suggestions. What I received wasn’t just an idea — it was a miniature business blueprint. It included positioning, pricing logic, and execution steps that could realistically be implemented within days.
The real insight here is that a high-quality prompt functions like strategic leverage. When designed properly, it compresses ideation time, clarifies positioning, and eliminates guesswork. That’s when I realized the opportunity wasn’t in “using AI.” It was in designing prompts that generate ready-to-sell assets.
Turning AI Output Into a Marketable Product
Raw AI output is not a product. It is draft material. The transformation happens during refinement. I took the structured idea and began iterating — asking follow-up prompts to improve tone, sharpen differentiation, and tailor the offer to specific industries. For example, I repackaged the framework into done-for-you Instagram caption bundles for local restaurants, real estate listing templates for agents, and email response systems for service-based businesses.
Each version was customized, formatted professionally, and aligned with real client pain points. That layer of human editing and contextual adaptation dramatically increased perceived value. Instead of selling “AI-generated text,” I sold packaged solutions that saved business owners time and improved their marketing consistency. This distinction alone is what allowed me to charge meaningful rates instead of commodity pricing.
Why Clients Paid — And Why They Didn’t Care About AI
One of the biggest misconceptions about monetizing AI is assuming buyers care how the product is created. They don’t. Clients care about outcomes. They want engagement, leads, conversions, clarity, and saved time. Once I reframed my offer around those outcomes, conversations shifted. I positioned the service as a content system — not as AI writing assistance.
This psychological repositioning changed everything. When you sell transformation instead of tools, pricing becomes flexible. Offers between $50 and $150 per bundle became realistic and repeatable. A few clients later, the total crossed into the hundreds of dollars. Not because the work was complex, but because it solved defined problems efficiently.
The Strategic Framework Behind the Income
The income did not come from luck or virality. It came from a structured execution model:
Define a niche with a clear commercial problem.
Use a strategic prompt to generate a structured solution.
Refine and adapt the output through iterative prompting.
Package the result professionally.
Position it around outcomes, not AI usage.
This framework turns one prompt into a reusable production system. Once built, it can be applied to multiple industries. That scalability is where the long-term potential lies. The first few hundred dollars were proof of concept. The real value is in repeatability.
Advertisements
A Real Example of Practical Application
Consider a small local tailoring or clothing repair shop. Many such businesses struggle with consistent social media engagement. Using a refined prompt, I generated a 30-day content system: storytelling posts, promotional hooks, educational captions, and brand voice guidelines. After editing and formatting, it became a cohesive marketing bundle.
To the business owner, this was not “AI content.” It was a structured marketing solution they did not have time to create themselves. The value was clarity and execution, not technology. This is a crucial distinction for anyone looking to monetize AI tools.
Why This Model Is Even More Powerful in 2026
As AI platforms evolve — particularly tools developed by organizations like OpenAI — access is no longer a competitive advantage. Everyone has access. The differentiator now is structured thinking. Those who understand how to design prompts that generate assets, package outputs into offers, and align them with market demand will consistently create income streams.
The barrier to entry is low. The barrier to structured execution is not. That gap is where opportunity lives.
The Deeper Lesson: Think in Systems, Not Tasks
The most important realization from this experience was conceptual. I stopped thinking in tasks (“write captions”) and started thinking in systems (“build a repeatable content asset for a defined niche”). That mental shift transforms AI from a convenience tool into a leverage mechanism.
One prompt became the foundation of a small but meaningful income stream. But more importantly, it became proof that structured AI utilization can generate predictable, scalable opportunities. Hundreds of dollars were only the beginning.
Conclusion: The Prompt Is a Lever — If You Design It Correctly
If you open ChatGPT today and type something random, you will get something usable. But if you engineer a prompt with intention, specificity, and commercial awareness, you can generate something monetizable.
The difference is strategic depth.
One carefully designed prompt generated hundreds of dollars for me. The next one might generate thousands — not because the tool changed, but because the framework improved.
Now the real question is not whether AI can make money. It is whether you are designing prompts as assets or treating them as casual instructions.
If this sparked an idea for you, share your niche in the comments. I’ll help you think through how to structure the monetizable prompt.
Advertisements
ChatGPTكيف حولت برومبت واحد إلى مشروع بمئات الدولارات مع
Advertisements
اليوم الذي توقفت فيه عن استخدام الذكاء الاصطناعي بشكل عشوائي
ChatGPT يفتح معظم الناس برنامج
ويكتبون ما يخطر ببالهم ( تعليق سريع، بريد إلكتروني قصير، أو ربما فكرة لمقال مدونة) فعلتُ الشيء نفسه في البداية، شعرتُ أنه مفيد وفعّال بل ومثير للإعجاب، لكنه لم يكن مربحاً
جاءت نقطة التحول عندما توقفتُ عن التعامل مع الذكاء الاصطناعي كأداة مساعدة وبدأتُ في استخدامه كمحرك إنتاج، فبدلاً من طرح أسئلة عشوائية صممتُ سؤالاً واحداً دقيقاً واستراتيجياً يهدف إلى إنشاء شيء قابل للربح، هذا التحول البسيط في التفكير – من الاستهلاك إلى إنشاء الأصول – هو ما سمح لي بتحقيق مئات الدولارات كدخل إضافي من خلال تعليمات منظمة واحدة، فلم تتغير الأداة بل تغيرت طريقتي
السؤال الذي غيّر كل شيء
لم يكن السؤال بحد ذاته سحرياً بل كان مقصوداً، فبدلاً من طلب “أفكار تجارية” عامة
للعمل كمستشار أعمال ChatGPT وجهتُ
وتصميم عرض رقمي يستهدف جمهوراً محدداً بوضوح ولديه مشكلة قابلة للقياس، فكان المفتاح هو التحديد بحيث حددتُ المجال والمشكلة والنتيجة المتوقعة وطريقة التقديم، أجبر ذلك الذكاء الاصطناعي على إنتاج مخرجات منظمة بدلاً من مجرد اقتراحات سطحية، لم تكن النتيجة مجرد فكرة بل كانت مخططاً مصغراً للأعمال بحيث تضمَّن المخطط تحديد الموقع ومنطق التسعير وخطوات التنفيذ التي يمكن تطبيقها عملياً في غضون أيام
يكمن جوهر الفكرة هنا في أن التوجيه عالي الجودة يعمل كرافعة استراتيجية، فعند تصميمه بشكل صحيح يُقلل وقت توليد الأفكار ويُوضح الموقع ويُزيل التخمين، عندها أدركت أن الفرصة لا تكمن في “استخدام الذكاء الاصطناعي” فحسب بل في تصميم توجيهات تُنتج أصولاً جاهزة للبيع
تحويل مخرجات الذكاء الاصطناعي إلى منتج قابل للتسويق
مخرجات الذكاء الاصطناعي الخام ليست منتجاً بل هي مسودة، بحيث يحدث التحول أثناء التحسين لذا أخذت الفكرة المنظمة وبدأت في تطويرها من خلال طلب توجيهات متابعة لتحسين الأسلوب وتعزيز التميّز وتخصيص العرض لقطاعات محددة، فعلى سبيل المثال قمت بإعادة صياغة الإطار في حزم جاهزة لتعليقات إنستغرام للمطاعم المحلية وقوالب قوائم عقارية للوكلاء وأنظمة استجابة للبريد الإلكتروني للشركات الخدمية
تم تخصيص كل نسخة وتنسيقها باحترافية ومواءمتها مع التحديات الحقيقية التي يواجهها العملاء، وقد ساهمت هذه اللمسة من التحرير البشري والتكييف السياقي في رفع القيمة المُدركة بشكل كبير، فبدلاً من بيع “نصوص مُولّدة بواسطة الذكاء الاصطناعي” كنتُ أبيع حلولاً متكاملة توفر لأصحاب الأعمال الوقت وتُحسّن من اتساق استراتيجياتهم التسويقية، هذا التميّز وحده هو ما سمح لي بتقديم أسعار مُجزية بدلاً من أسعار السلع الأساسية
لماذا دفع العملاء – ولماذا لم يهتموا بالذكاء الاصطناعي؟
من أكبر المفاهيم الخاطئة حول تحقيق الربح من الذكاء الاصطناعي هو افتراض أن المشترين يهتمون بكيفية إنشاء المنتج، هذا غير صحيح إذ يهتم العملاء بالنتائج، فهم يريدون تفاعلاً وعملاء محتملين وتحويلات ووضوحاً وتوفيراً للوقت، فبمجرد أن ركزتُ عرضي على هذه النتائج تغيّر مسار الحوار لأني قدّمتُ الخدمة كنظام محتوى وليس كمساعدة كتابة بالذكاء الاصطناعي
أحدث هذا التغيير النفسي في التموضع كل شيء، فعندما تبيع التحول بدلاً من الأدوات تصبح الأسعار مرنة، فأصبحت العروض التي تتراوح بين 50 و150 دولاراً لكل حزمة واقعية وقابلة للتكرار، وبعد بضعة عملاء تجاوز الإجمالي مئات الدولارات ليس لأن العمل كان معقداً بل لأنه حلّ مشاكل محددة بكفاءة
Advertisements
الإطار الاستراتيجي وراء الدخل
: لم يأتِ الدخل من الصدفة أو الانتشار السريع بل من نموذج تنفيذي منظم
حدد مجالاً متخصصاً بمشكلة تجارية واضحة *
استخدم مُحفزاً استراتيجياً لتوليد حل منظم *
حسّن وطوّر الناتج من خلال التكرار المستمر للمحفزات *
قدّم النتيجة بشكل احترافي *
ركّز على النتائج، لا على استخدام الذكاء الاصطناعي *
يحوّل هذا الإطار مُحفزاً واحداً إلى نظام إنتاج قابل لإعادة الاستخدام، فبمجرد بنائه يمكن تطبيقه على قطاعات متعددة، تكمن إمكاناته طويلة الأجل في قابليته للتوسع، فكانت المئات الأولى من الدولارات بمثابة إثبات للمفهوم أما القيمة الحقيقية فتكمن في إمكانية تكراره
مثال واقعي للتطبيق العملي
لنفترض وجود محل خياطة أو إصلاح ملابس صغير محلي ، تعاني العديد من هذه الشركات من صعوبة التفاعل المستمر على وسائل التواصل الاجتماعي، ولكن باستخدام نموذج مُحسّن قمتُ بإنشاء نظام محتوى لمدة 30 يوماً: منشورات سردية وعناصر ترويجية جذابة وشروحات تعليمية وإرشادات لأسلوب العلامة التجارية فبعد التحرير والتنسيق أصبح حزمة تسويقية متكاملة
بالنسبة لصاحب العمل لم يكن هذا “محتوى ذكاء اصطناعي” بل كان حلاً تسويقياً منظماً لم يكن لديه الوقت الكافي لإنشائه بنفسه، إذ تكمن القيمة في الوضوح والتنفيذ وليس في التكنولوجيا وهذا حقيقةً تمييز جوهري لأي شخص يسعى إلى تحقيق الربح من أدوات الذكاء الاصطناعي
لماذا يُعد هذا النموذج أكثر فعالية في عام 2026؟
مع تطور منصات الذكاء الاصطناعي
OpenAI وخاصة الأدوات التي طورتها منظمات مثل
لم يعد الوصول إليها ميزة تنافسية لأن الوصول أصبح متاحاً للجميع فالعامل المُميز الآن هو التفكير المنظم، أولئك الذين يفهمون كيفية تصميم نماذج تُنتج أصولاً وتجميع المخرجات في عروض ومواءمتها مع طلب السوق سيتمكنون من تحقيق مصادر دخل مستمرة
إنّ عتبة الدخول منخفضة لكنّ عتبة التنفيذ المنظم ليست كذلك، هذه الفجوة هي منبع الفرص
الدرس الأعمق: فكّر في الأنظمة لا في المهام
كان أهم ما استخلصته من مفهوم هذه التجربة هو أنني توقفتُ عن التفكير في المهام (“كتابة التعليقات”) وبدأتُ بالتفكير في الأنظمة (“بناء محتوى متكرر لفئة محددة”)، هذا التحوّل الفكري يحوّل الذكاء الاصطناعي من أداة مساعدة إلى آلية فعّالة
أصبحت إحدى الرسائل أساساً لمصدر دخل صغير ولكنه ذو قيمة، والأهم من ذلك أنها أثبتت أن الاستخدام المنظم للذكاء الاصطناعي يُمكن أن يُولّد فرصاً متوقعة وقابلة للتوسع، فمئات الدولارات لم تكن سوى البداية
الخلاصة: الرسالة أداة فعّالة – إذا صممتها بشكل صحيح
اليوم وكتبتَ شيئاً عشوائياً ChatGPT إذا فتحتَ
فستحصل على شيء قابل للاستخدام، لكن إذا صممتَ رسالةً بوعي وهدف ودقة وإدراك تجاري فستُنتج شيئاً قابلاً للربح
الفرق يكمن في العمق الاستراتيجي
رسالة واحدة مصممة بعناية حققت لي مئات الدولارات، قد يُدرّ عليك التطبيق التالي آلاف الدولارات ليس لتغيّر الأداة بل لتحسّن البنية التحتية
والآن السؤال الحقيقي ليس ما إذا كان الذكاء الاصطناعي قادراً على تحقيق الربح بل ما إذا كنت تصمم التوجيهات كأصول قيّمة أم تتعامل معها كتعليمات عابرة
إذا ألهمتك هذه الفكرة فشاركنا مجال تخصصك في التعليقات سأساعدك في التفكير بكيفية هيكلة التوجيهات القابلة للربح
Introduction — The shifting center of gravity in data careers
Data science in 2026 is no longer the same field that exploded in popularity a few years ago; it has matured, specialized, and fragmented into a more structured ecosystem where raw statistical skills, engineering depth, and AI fluency all compete for dominance, while businesses have become far more precise about what they actually want from data professionals. In earlier years, many companies hired “generic” data scientists to do everything from analytics to machine learning, but today organizations are refining roles, separating responsibilities, and expecting professionals to be deeply skilled in narrower domains rather than broadly average at everything, which has reshaped both hiring patterns and career paths across the industry.
The market reality — demand remains high, but expectations are sharper
The demand for data science talent is still strong in 2026, driven by the continued expansion of AI, automation, cloud computing, and data-driven decision-making, yet the nature of that demand has become more selective, as firms now prioritize candidates who can demonstrate real impact rather than just theoretical knowledge. Many organizations have shifted from experimenting with AI to deploying it at scale, which means they are hiring fewer entry-level generalists and more mid-to-senior specialists who can build, maintain, and productionize models reliably while collaborating closely with engineering and business teams.
Demand for data professionals is still growing.
Companies prefer proven, practical talent over beginners.
AI is moving from experimentation to real production systems.
Key roles shaping data science jobs in 2026
Instead of a single “data scientist” title, the field in 2026 is increasingly divided into roles such as Machine Learning Engineers who focus on building and deploying models, Data Analysts who concentrate on business insights and dashboards, Data Engineers who design data pipelines, and AI Engineers who work closely with large language models and automation systems. This separation has created clearer career tracks, where professionals can choose to specialize in modeling, infrastructure, or decision analytics rather than trying to master every aspect of the data stack at once.
Machine Learning Engineers focus on models in production.
Data Analysts emphasize insights and reporting.
Data Engineers build and maintain data infrastructure.
AI Engineers work with modern AI systems like LLMs.
Advertisements
Skills that define employability in 2026
Technical proficiency in Python, SQL, and cloud platforms remains foundational, but in 2026, additional skills such as MLOps, model monitoring, and AI orchestration have become just as important as traditional machine learning techniques. Employers increasingly expect data professionals to understand not only how to build a model, but also how to deploy it, track its performance, detect drift, and integrate it into real business workflows, which has blurred the line between data science and software engineering.
For example, a modern data scientist might train a model in Python like this:
But in 2026, they would also be expected to deploy it, monitor it, and maintain it in production.
Python and SQL are still essential.
Cloud platforms and MLOps are now critical.
Deployment and monitoring skills are as important as modeling.
Salaries and career progression — opportunity with responsibility
Salaries for data science roles in 2026 remain highly competitive, especially for professionals who combine strong technical depth with business understanding, but compensation increasingly depends on impact rather than job title alone. Senior professionals who can lead projects, communicate effectively with stakeholders, and bridge the gap between technical teams and business leaders tend to earn the highest salaries, while junior candidates may find the entry-level market more challenging than in previous years.
Salaries are still strong for skilled professionals.
Impact matters more than job title.
Leadership and communication boost career value.
Conclusion — what 2026 means for aspiring data professionals
Data science jobs in 2026 represent a more structured, demanding, and rewarding career landscape where success depends on specialization, continuous learning, and the ability to translate data into real business value rather than just building models in isolation. If you are entering or already in this field, focusing on depth, practical experience, and production-ready skills will position you far better than simply collecting certificates or following generic learning paths, so consider your preferred role carefully and build your expertise accordingly.
Tell me in the comments: which data science role do you see yourself pursuing in 2026, and why?
Advertisements
المشهد الجديد لوظائف علوم البيانات في عام 2026
: مقدمة – تحولات في مركز ثقل مسارات العمل في مجال البيانات
لم يعد علم البيانات في عام 2026 هو المجال الذي شهد رواجاً كبيراً قبل بضع سنوات؛ فقد نضج وتخصص وتجزأ ليصبح منظومة أكثر تنظيماً حيث تتنافس المهارات الإحصائية الأساسية والخبرة الهندسية والكفاءة في الذكاء الاصطناعي على الصدارة بينما أصبحت الشركات أكثر دقة في تحديد ما تريده من متخصصي البيانات، ففي السابق كانت العديد من الشركات توظف علماء بيانات “عامين” للقيام بكل شيء من التحليلات إلى التعلم الآلي، أما اليوم فتعمل المؤسسات على تحسين الأدوار وفصل المسؤوليات وتتوقع من المتخصصين إتقان مجالات محددة بدلاً من امتلاك مهارات متوسطة في كل شيء مما أدى إلى إعادة تشكيل أنماط التوظيف والمسارات المهنية في هذا القطاع
:واقع السوق – لا يزال الطلب مرتفعاً لكن التوقعات أكثر دقة
لا يزال الطلب على كفاءات علوم البيانات قوياً في عام ٢٠٢٦ مدفوعاً بالتوسع المستمر للذكاء الاصطناعي والأتمتة والحوسبة السحابية واتخاذ القرارات القائمة على البيانات، إلا أن طبيعة هذا الطلب أصبحت أكثر انتقائية حيث تُعطي الشركات الأولوية الآن للمرشحين القادرين على إحداث تأثير ملموس بدلاً من مجرد المعرفة النظرية، وقد تحولت العديد من المؤسسات من مرحلة تجربة الذكاء الاصطناعي إلى نشره على نطاق واسع مما يعني أنها تُوظف عدداً أقل من المبتدئين ذوي الخبرة العامة وعدداً أكبر من المتخصصين ذوي الخبرة المتوسطة إلى العليا القادرين على بناء النماذج وصيانتها وتشغيلها بكفاءة عالية مع التعاون الوثيق مع فرق الهندسة والأعمال
:وعليه نستخلص النقاط التالية
لا يزال الطلب على متخصصي البيانات في ازدياد *
تُفضل الشركات الكفاءات العملية ذات الخبرة المثبتة على المبتدئين *
ينتقل الذكاء الاصطناعي من مرحلة التجربة إلى أنظمة الإنتاج الحقيقية *
: 2026 الأدوار الرئيسية التي تُشكّل وظائف علم البيانات في عام
بدلاً من مسمى وظيفي واحد هو “عالم بيانات” ينقسم هذا المجال في عام 2026 بشكل متزايد إلى أدوار مثل مهندسي التعلم الآلي الذين يركزون على بناء النماذج ونشرها ومحللي البيانات الذين يركزون على رؤى الأعمال ولوحات المعلومات ومهندسي البيانات الذين يصممون مسارات البيانات ومهندسي الذكاء الاصطناعي الذين يعملون عن كثب مع نماذج اللغة الضخمة وأنظمة الأتمتة، وقد أدى هذا التقسيم إلى مسارات وظيفية أكثر وضوحاً حيث يمكن للمختصين اختيار التخصص في النمذجة أو البنية التحتية أو تحليلات اتخاذ القرار بدلاً من محاولة إتقان جميع جوانب بنية البيانات دفعة واحدة
: إذا ً يمكننا أن نلخص ما ذكر بالنقاط التالية
يركز مهندسو التعلم الآلي على النماذج قيد التشغيل *
يركز محللو البيانات على الرؤى والتقارير *
يقوم مهندسو البيانات ببناء وصيانة بنية البيانات التحتية *
يعمل مهندسو الذكاء الاصطناعي مع أنظمة الذكاء الاصطناعي الحديثة مثل نماذج اللغة الضخمة *
Advertisements
: 2026 المهارات التي تحدد فرص العمل في عام
SQL لا تزال الكفاءة التقنية في لغات بايثون و
ومنصات الحوسبة السحابية أساسية ولكن في عام 2026 أصبحت مهارات إضافية
(MLOps) مثل عمليات تعلم الآلة
ومراقبة النماذج وتنسيق الذكاء الاصطناعي لا تقل أهمية عن تقنيات تعلم الآلة التقليدية، كما ويتوقع أصحاب العمل بشكل متزايد من متخصصي البيانات فهم كيفية بناء النموذج وكيفية نشره وتتبع أدائه واكتشاف أي انحرافات ودمجه في سير العمل الفعلي مما أدى إلى تداخل كبير بين علم البيانات وهندسة البرمجيات
على سبيل المثال قد يقوم عالم بيانات حديث بتدريب نموذج باستخدام بايثون على النحو التالي
لكن في عام ٢٠٢٦ سيُطلب منهم أيضاً نشر النظام ومراقبته وصيانته في بيئة الإنتاج
:إذاً
أساسيتين SQL لا تزال لغتا بايثون و *
أصبحت منصات الحوسبة السحابية *
بالغة الأهمية (MLOps) وعمليات تعلم الآلة
تُعدّ مهارات النشر والمراقبة بنفس أهمية مهارات النمذجة *
لا تزال رواتب وظائف علوم البيانات في عام ٢٠٢٦ تنافسية للغاية لا سيما للمحترفين الذين يجمعون بين الخبرة التقنية العميقة والفهم التجاري ولكن يعتمد التعويض بشكل متزايد على الأثر وليس على المسمى الوظيفي وحده، يميل كبار المحترفين القادرون على قيادة المشاريع والتواصل الفعال مع أصحاب المصلحة وسد الفجوة بين الفرق التقنية وقادة الأعمال إلى الحصول على أعلى الرواتب، بينما قد يجد المرشحون المبتدئون سوق العمل أكثر صعوبة من السنوات السابقة
ملخص
لا تزال الرواتب مجزية للمحترفين المهرة *
الأثر أهم من المسمى الوظيفي *
القيادة والتواصل يعززان القيمة الوظيفية *
الخلاصة: ماذا يعني عام 2026 للمهنيين الطموحين في مجال البيانات؟
تُمثل وظائف علوم البيانات في عام 2026 مساراً وظيفياً أكثر تنظيماً وتحدياً ومكافأة، حيث يعتمد النجاح على التخصص والتعلم المستمر والقدرة على تحويل البيانات إلى قيمة تجارية حقيقية، فبدلاً من مجرد بناء نماذج بمعزل عن السياق، إذا كنتَ تدخل هذا المجال أو تعمل فيه بالفعل فإن التركيز على التعمق في المعرفة واكتساب الخبرة العملية وتطوير المهارات الجاهزة للاستخدام سيُعزز فرصك بشكل كبير مقارنةً بمجرد الحصول على الشهادات أو اتباع مسارات تعليمية عامة، لذا فكّر جيداً في الدور الذي تُفضّله وابنِ خبرتك وفقاً لذلك
شاركنا في التعليقات: ما هو دور علوم البيانات الذي تتطلع إليه في عام 2026 ولماذا؟
Python is no longer just a programming language, it is a lever. One lever that can lift you from “I know how to code” to “I build systems that generate income.” Its simplicity, ecosystem, and market demand make it one of the most profitable skills in tech today. The question is not whether you can make money with Python, but how strategically you will do it. In this article, you will see clear paths, real examples, and practical steps that transform Python from a skill into a revenue engine.
1) Freelancing: Selling Your Code Directly
The fastest entry point for most people is freelancing. Businesses constantly need automation, scripts, websites, data analysis, and integrations, and many of them prefer Python solutions.
What you can offer:
Web scraping tools
Task automation scripts
Custom business dashboards
API integrations
Bug fixing and optimization
Real-life example: A small e-commerce store hired a freelancer to build a Python script that automatically updates product prices based on competitor websites. The freelancer charged $600 for a one-week project.
Simple idea to start: Create 2–3 polished Python projects on GitHub, then offer services on Upwork, Fiverr, or LinkedIn.
2) Building Your Own Tools or SaaS
Instead of selling your time, you can sell software. Python is excellent for backend development, APIs, and automation platforms.
Popular paths:
Build a subscription-based tool
Create an AI-powered service
Develop a niche automation app
Example: A developer built a Python-based tool that helps YouTubers analyze thumbnails and titles. They charge $15 per month per user and now serve thousands of creators.
Mini code concept (Flask micro-service):
This kind of simple API can be the backbone of a paid service.
3) Data Science and Analytics (High-Paying Path)
Companies pay very well for people who can turn data into decisions using Python.
Key tools:
Pandas
NumPy
Matplotlib
Scikit-learn
Example: A marketing agency hired a Python analyst to build predictive models that improved ad targeting. The analyst earned $3,000 per month as a contractor.
If you enjoy logic, math, and problem-solving, this is one of the most lucrative Python paths.
Advertisements
4) Automation: Work Once, Earn Continuously
Many businesses still run manually, which is inefficient. Python can automate repetitive work and save companies thousands of dollars.
What you can automate:
Invoice processing
Report generation
Email workflows
File organization
Data extraction
Example: A Python script that automatically cleans and organizes thousands of PDF invoices saved an accounting firm 20 hours per week.
5) Teaching, Courses, and Content Creation
If you can explain Python clearly, you can monetize knowledge.
Options:
Create a YouTube channel
Sell online courses
Write a paid newsletter
Offer private mentoring
Given your experience in creating educational content, this aligns very well with your existing direction.
6) Creating and Selling Python Products
You can sell:
Python templates
GUI applications
Chrome extensions
Ready-made scripts
Example: A developer sells a Python-based Instagram automation tool for $49 and makes consistent passive income.
Conclusion
Python gives you options, but success comes from focus, consistency, and real-world application. Choose one path, master it deeply, and ship real projects. If you found this guide useful, tell me in the comments:
which path are you going to start with, and why?
Advertisements
الدليل الذكي للربح باستخدام بايثون
Advertisements
لم تعد بايثون مجرد لغة برمجة بل أصبحت أداةً فعّالة، أداةٌ تُمكنك من الانتقال من مجرد “أعرف كيف أبرمج” إلى “أبني أنظمةً تُدرّ دخلاً”، فبساطتها ونظامها البيئي المتكامل والطلب المتزايد عليها في السوق تجعلها من أكثر المهارات ربحيةً في مجال التقنية اليوم، فالسؤال إذا ليس ما إذا كان بإمكانك جني المال باستخدام بايثون بل كيف ستفعل ذلك بذكاء
في هذه المقالة ستجد مسارات واضحة وأمثلة واقعية وخطوات عملية تُحوّل بايثون من مجرد مهارة إلى محرك ربح
1) العمل الحر: بيع برمجياتك مباشرةً
يُعدّ العمل الحر أسرع نقطة انطلاق لمعظم الناس، إذ تحتاج الشركات باستمرار إلى الأتمتة والبرامج النصية والمواقع الإلكترونية وتحليل البيانات والتكاملات ويُفضّل الكثير منها حلول بايثون
ماذا يمكن أن يقدم لك العمل الحر؟
أدوات استخراج البيانات من مواقع الويب •
برامج نصية لأتمتة المهام •
لوحات تحكم مخصصة للأعمال •
(API) تكامل واجهات برمجة التطبيقات •
إصلاح الأخطاء وتحسين الأداء •
:مثال واقعي
استعان متجر إلكتروني صغير بمطور مستقل لكتابة برنامج بايثون يقوم بتحديث أسعار المنتجات تلقائياً بناءً على مواقع المنافسين، تقاضى المطور 600 دولار أمريكي مقابل مشروع استغرق أسبوعاً واحداً
:فكرة بسيطة للبدء
GitHub أنشئ 2-3 مشاريع بايثون متقنة على
LinkedIn أو Fiverr أو Upwork ثم قدم خدماتك على
2) (SaaS)بناء أدواتك الخاصة أو برمجياتك كخدمة
بدلاً من بيع وقتك يمكنك بيع البرمجيات، تُعد بايثون لغة ممتازة لتطوير الواجهات الخلفية وواجهات برمجة التطبيقات ومنصات الأتمتة
:مسارات شائعة
بناء أداة قائمة على الاشتراك •
إنشاء خدمة مدعومة بالذكاء الاصطناعي •
تطوير تطبيق أتمتة متخصص •
:مثال
قام مطور ببناء أداة تعتمد على بايثون لمساعدة مستخدمي يوتيوب على تحليل الصور المصغرة والعناوين، يتقاضى المطور 15 دولاراً أمريكياً شهرياً لكل مستخدم ويخدم الآن آلافاً من صناع المحتوى وقام مطور بإنشاء أداة تعتمد على بايثون لمساعدة مستخدمي يوتيوب على تحليل الصور المصغرة والعناوين
(المصغرة : Flask مفهوم الكود المصغر (خدمة
يمكن أن يشكل هذا النوع من واجهات برمجة التطبيقات البسيطة أساساً لخدمة مدفوعة
3) علم البيانات والتحليلات (مسار ذو دخل مرتفع)
تدفع الشركات مبالغ مجزية للمختصين القادرين على تحويل البيانات إلى قرارات باستخدام لغة بايثون
:الأدوات الرئيسية
Pandas •
NumPy •
Matplotlib •
Scikit-learn •
:مثال
استعانت وكالة تسويق بمحلل بايثون لبناء نماذج تنبؤية لتحسين استهداف الإعلانات، حصل المحلل على 3000 دولار شهرياً كمقاول
إذا كنت تستمتع بالمنطق والرياضيات وحل المشكلات فهذا أحد أكثر مسارات بايثون ربحية
Advertisements
4) الأتمتة: اعمل مرة واحدة واربح باستمرار
لا تزال العديد من الشركات تعمل يدوياً وهو أمر غير فعال، ولكن يمكن لبايثون أتمتة الأعمال المتكررة وتوفير آلاف الدولارات للشركات
:ما يمكنك أتمتته
معالجة الفواتير •
إنشاء التقارير •
سير عمل البريد الإلكتروني •
تنظيم الملفات •
استخراج البيانات •
مثال: وفّر برنامج بايثون يقوم تلقائياً
PDF بتنظيف وتنظيم آلاف فواتير
لشركة محاسبة 20 ساعة أسبوعياً
5) التدريس والدورات وإنشاء المحتوى
إذا كنت تجيد شرح لغة بايثون بوضوح يمكنك تحقيق الربح من خلال استثمار خبرتك ومعرفتك
:خيارات
إنشاء قناة على يوتيوب •
بيع دورات تدريبية عبر الإنترنت •
كتابة نشرة إخبارية مدفوعة •
تقديم جلسات إرشاد خاصة •
بالنظر إلى خبرتك في إنشاء محتوى تعليمي يتوافق هذا تماماً مع توجهك الحالي
6) إنشاء وبيع منتجات بايثون
: يمكنك بيع
قوالب بايثون •
تطبيقات بواجهة رسومية •
إضافات لمتصفح كروم •
برامج نصية جاهزة •
مثال: يبيع مطور أداة أتمتة لإنستغرام مبنية على بايثون مقابل 49 دولاراً ويحقق دخلاً سلبياً ثابتاً
: الخلاصة
تمنحك بايثون خيارات متعددة ولكن النجاح يعتمد على التركيز والمثابرة والتطبيق العملي، لذا اختر مساراً واحداً وأتقنه تماماً وأنجز مشاريع حقيقية
إذا وجدت هذا الدليل مفيداً أخبرني في التعليقات: ما المسار الذي ستختاره للبدء به ولماذا؟
Artificial intelligence is no longer niche—it has become an essential part of nearly every workflow in business, creativity, research, and everyday life. In 2026, the landscape of AI tools has matured into a vibrant ecosystem of powerful platforms, each designed to help users automate tasks, generate content, analyze data, and boost productivity. Here’s a comprehensive look at the top AI tools shaping this year across major categories.
1. ChatGPT (OpenAI) – All-Purpose AI Assistant
Best For: Writing, brainstorming, planning, research, coding, and multimodal tasks. ChatGPT remains the most versatile and widely used AI, powering everything from content creation to business automation. In 2026 it’s evolved beyond simple text generation into a multitasking AI capable of handling images, video analysis, and complex workflows.
2. Google Gemini Ultra – Knowledge & Workflow Powerhouse
Best For: Research, analytics, productivity, and search integration. Gemini leverages Google’s massive data ecosystem to deliver context-rich answers, research synthesis, and productivity features deeply integrated with Workspace apps like Docs, Sheets, Slides, and Gmail.
3. Anthropic Claude – Deep Thinking & Reasoning AI
Best For: Long-form writing, document review, and structured logic. Claude is highly regarded for reasoning, analysis, and ethical alignment. It’s particularly effective in professional settings such as legal work, technical documentation, and research summarization.
4. Microsoft Copilot – AI for Productivity
Best For: Daily office tasks, automation inside Microsoft 365. Copilot now powers Word, Excel, Outlook, Teams, and PowerPoint with generative capabilities—writing text, generating summaries, automating spreadsheets, and supporting collaboration.
5. Jasper AI – Content Creation Engine
Best For: Marketers, writers, and brand-focused content. Jasper AI shines for SEO-optimized blogging, ad copy, social content, and customized voice generation—ideal for agencies and content teams.
6. Midjourney 6 – Next-Gen Visual Creativity
Best For: Artists, designers, and visual storytellers. This advanced image generation tool produces ultra-realistic graphics, illustrations, and concept art with style presets and integration into design tools like Figma and Photoshop.
Advertisements
7. Runway AI & Synthesia – AI Video Creation
Best For: Marketing videos, training content, social media clips. Runway’s Gen-2/Gen-3 tools create cinematic-quality video with text prompts, motion effects, and editing automation. Synthesia focuses on avatar-driven video creation with voice cloning and multilingual narration.
8. Notion AI – Smart Productivity Companion
Best For: Notes, planning, documentation, team collaboration. Notion AI brings intelligent summaries, meeting insights, and project management automation into one unified workspace.
9. Perplexity AI – Research & Fact Checking
Best For: Research, information retrieval, citation-based answers. Unlike many general AIs, Perplexity blends conversational AI with real-time web search, delivering credible, cited responses that are invaluable for academia, journalism, and deep research tasks.
10. Zapier AI Agents – Workflow Automation
Best For: Task automation, cross-app processes. Zapier’s AI Agents can design and optimize workflows autonomously, connecting apps and data without coding—great for freeing teams from repetitive tasks.
11. Emerging & Specialized Tools to Watch
2026 isn’t just about the mainstream platforms—several specialist tools are gaining traction:
Cursor AI – AI-assisted code editor for real-time coding flow and collaboration.
Perplexity AI – Research engine with web citations.
ElevenLabs – Industry-leading AI voice generation.
Framer AI – AI website builder for rapid web design.
Runway Gen-2/Gen-3 – AI video & skilled editing platform.
Sora AI – Full scene video generation from text prompts.
Key Trends in AI for 2026
🔹 Agentic AI
AI agents are becoming autonomous helpers that execute tasks across desktop and web environments, not just chat responses.
🔹 Multimodal Intelligence
Tools now handle text, images, audio, and video seamlessly—transforming creativity and productivity workflows.
🔹 Integration With Workflows
The biggest impact comes from tools embedded in everyday software like Office, Workspace, and design platforms.
🔹 Democratized AI Creation
Open-source tools and APIs let developers build customized AI assistants or integrate intelligence directly into apps.
Conclusion
2026’s AI landscape is rich, dynamic, and incredibly practical. From universal assistants like ChatGPT and Gemini to specialized creative tools like Midjourney and Runway, AI is reshaping how we solve problems, create content, and optimize work. Whether you’re a creator, analyst, marketer, or business leader, incorporating the right mix of these tools can dramatically accelerate your output and reduce routine workload.
Advertisements
أهم أدوات الذكاء الاصطناعي التي يجب عليك استخدامها في عام 2026
Advertisements
لم يعد الذكاء الاصطناعي مجالاً متخصصاً بل أصبح جزءاً أساسياً من جميع مجالات العمل تقريباً في الأعمال التجارية والإبداع والبحث والحياة اليومية، وفي عام 2026 نضجت أدوات الذكاء الاصطناعي لتتحول إلى نظام بيئي حيوي من المنصات القوية المصممة لمساعدة المستخدمين على أتمتة المهام وإنشاء المحتوى وتحليل البيانات وتعزيز الإنتاجية
إليكم نظرة شاملة على أفضل أدوات الذكاء الاصطناعي التي تُشكل هذا العام في الفئات الرئيسية
1. ChatGPT (OpenAI) – مساعد ذكاء اصطناعي متعدد الأغراض
الأفضل لـ: الكتابة والعصف الذهني والتخطيط والبحث والبرمجة والمهام متعددة الوسائط
أكثر أدوات الذكاء الاصطناعي تنوعاً واستخداماً ChatGPT يظل
على نطاق واسع، حيث يدعم كل شيء بدءاً من إنشاء المحتوى وصولاً إلى أتمتة الأعمال، في عام 2026 تطور ليصبح أكثر من مجرد أداة لتوليد النصوص ليصبح ذكاءً اصطناعياً متعدد المهام قادراً على التعامل مع الصور وتحليل الفيديو وسير العمل المعقدة
2. Google Gemini Ultra – مركز قوة المعرفة وسير العمل
الأفضل لـ: البحث والتحليلات والإنتاجية وتكامل البحث
الضخم Google من نظام بيانات Gemini يستفيد
لتقديم إجابات غنية بالسياق وتجميع نتائج البحث وميزات إنتاجية متكاملة بعمق
Docs و Sheets و Slides و Gmail مثل Workspace مع تطبيقات
3. Anthropic Claude – ذكاء اصطناعي للتفكير والمنطق العميق
الأفضل لـ: الكتابة المطولة ومراجعة المستندات والمنطق المنظم
بتقدير كبير لقدراته على الاستنتاج Claude يُحظى
والتحليل والالتزام بالمعايير الأخلاقية وهو فعال بشكل خاص في البيئات المهنية مثل العمل القانوني والتوثيق التقني وتلخيص الأبحاث
4. Microsoft Copilot – ذكاء اصطناعي للإنتاجية
Microsoft 365 الأفضل لـ: مهام المكتب اليومية، الأتمتة داخل
الآن تطبيقات Copilot يدعم
Word و Excel و Outlook و Teams و PowerPoint
بقدرات توليدية – كتابة النصوص وإنشاء الملخصات وأتمتة جداول البيانات ودعم التعاون
5. Jasper AI – محرك إنشاء المحتوى
الأفضل لـ: المسوقين والكتاب ومحتوى العلامات التجارية
في كتابة المدونات المحسّنة لمحركات البحث Jasper AI يتألق
ونصوص الإعلانات ومحتوى وسائل التواصل الاجتماعي وإنشاء الصوت المخصص – وهو مثالي للوكالات وفرق المحتوى
6. Midjourney 6 – إبداع بصري من الجيل التالي
الأفضل لـ: الفنانين والمصممين ورواة القصص المرئية
تُنتج هذه الأداة المتقدمة لتوليد الصور رسومات وتوضيحات وفنوناً مفاهيمية فائقة الواقعية مع قوالب أنماط مسبقة
Figma و Photoshop وتكامل مع أدوات التصميم مثل
7.Runway AI & Synthesia – إنشاء مقاطع فيديو بالذكاء الاصطناعي
الأفضل لـ: فيديوهات التسويق والمحتوى التدريبي ومقاطع الفيديو لوسائل التواصل الاجتماعي
Runway من Gen-2/Gen-3 تُتيح أدوات
إنشاء فيديوهات بجودة سينمائية باستخدام أوامر نصية وتأثيرات حركية وأتمتة التحرير، بينما تُركز سينثيسيا على إنشاء فيديوهات باستخدام شخصيات افتراضية مع استنساخ الصوت والتعليق الصوتي متعدد اللغات
أصبحت وكلاء الذكاء الاصطناعي مساعدين مستقلين ينفذون المهام عبر بيئات سطح المكتب والويب وليس مجرد تقديم ردود في الدردشة
الذكاء متعدد الوسائط •
تتعامل الأدوات الآن مع النصوص والصور والصوت والفيديو بسلاسة مما يُحدث تحولاً في سير عمل الإبداع والإنتاجية
التكامل مع سير العمل •
يأتي التأثير الأكبر من الأدوات المدمجة في البرامج اليومية
إضفاء الطابع الديمقراطي على إنشاء الذكاء الاصطناعي •
تتيح الأدوات وواجهات برمجة التطبيقات مفتوحة المصدر للمطورين إنشاء مساعدين ذكاء اصطناعي مخصصين أو دمج الذكاء مباشرةً في التطبيقات
الخلاصة
يُعد مشهد الذكاء الاصطناعي لعام 2026 غنياً وديناميكياً وعملياً للغاية
Geminiو ChatGPT فمن المساعدين الشاملين مثل
Midjourney و Runway إلى الأدوات الإبداعية المتخصصة مثل
يُعيد الذكاء الاصطناعي تشكيل كيفية حل المشكلات وإنشاء المحتوى وتحسين العمل، فسواء كنت مبدعاً أو محللاً أو مسوقاً أو قائد أعمال فإن دمج المزيج المناسب من هذه الأدوات يمكن أن يُسرع إنتاجيتك بشكل كبير ويقلل من عبء العمل الروتيني
Over the past few years, I enrolled in dozens of data science courses across multiple platforms. Some were too theoretical, others outdated, and many promised “job readiness” without delivering practical depth. After investing hundreds of hours, a clear pattern emerged: only a small number of courses consistently build real-world capability, confidence, and employable skills.
This article distills that experience into four data science courses that genuinely stand above the rest—based on curriculum depth, instructional quality, practical projects, and long-term value.
1. IBM Data Science Professional Certificate (Coursera)
Best for: Structured beginners who want end-to-end coverage
This program excels at building a strong foundation. It covers Python, SQL, data analysis, visualization, and introductory machine learning with a clear learning path. What makes it effective is not novelty, but clarity and structure.
Why it works
Progressive curriculum with no assumed background
Hands-on labs using real datasets
Strong focus on industry-standard tools
Limitations
Machine learning depth is introductory
Less emphasis on advanced math or model optimization
Real-world takeaway You finish knowing how data science workflows actually operate in business environments—not just definitions.
2. Applied Data Science with Python (University of Michigan – Coursera)
Best for: Learners who want to think like a data scientist
This specialization shifts the focus from tools to reasoning. Instead of “which function to call,” it emphasizes why certain analytical decisions are made.
Why it works
Strong emphasis on pandas, NumPy, and data manipulation
Excellent treatment of data cleaning and feature engineering
Real analytical thinking, not just code execution
Limitations
Requires solid Python fundamentals
Visual design and UI feel dated
Example Insight You learn how subtle preprocessing choices can dramatically change model outcomes—an essential real-world skill.
Advertisements
3. Machine Learning by Andrew Ng (Coursera)
Best for: Understanding the core logic of machine learning
This course remains a benchmark. While it does not use modern libraries heavily, it explains machine learning concepts with exceptional clarity.
Why it works
Deep intuition for algorithms
Clear mathematical explanations without unnecessary complexity
Strong conceptual grounding
Limitations
Uses Octave/MATLAB instead of Python
Minimal focus on deployment or production systems
Practical Value Once you understand why gradient descent works, every modern ML framework becomes easier to master.
4. Data Science Bootcamp (Jose Portilla – Udemy)
Best for: Practical, tool-driven learners
This course is dense, practical, and highly actionable. It is especially effective for learners who want immediate exposure to real workflows using Python.
Why it works
Extensive hands-on coding
Covers NumPy, pandas, Matplotlib, Seaborn, and scikit-learn
Strong balance between explanation and execution
Limitations
Less theoretical depth
Requires self-discipline due to volume
Sample Code Style You’ll Master
This type of practical fluency is exactly what employers expect.
How to Choose the Right One for You
Each of these courses excels in a different dimension. The “best” choice depends on your objective:
Complete beginner → IBM Data Science Certificate
Analytical depth → University of Michigan specialization
Machine learning theory → Andrew Ng’s ML course
Hands-on job skills → Jose Portilla’s Bootcamp
In many cases, combining one foundational course + one practical course produces the strongest results.
Conclusion: Quality Beats Quantity
Trying dozens of courses taught me a simple lesson: progress does not come from consuming more content, but from choosing the right content and applying it deeply. These four courses consistently deliver clarity, competence, and confidence—the qualities that actually move careers forward.
If you are serious about data science, start with one of these, commit fully, and build projects alongside the lessons. The difference is measurable.
Advertisements
بعد أكثر من 30 دورة تدريبية إليكم أفضل 4 دروات منها
Advertisements
المقدمة: التعلم بالطريقة الصعبة
على مدى السنوات القليلة الماضية قمت بالتسجيل في العشرات من دورات علوم البيانات عبر منصات متعددة، فكان بعضها نظرياً أكثر مما ينبغي والبعض الآخر عفا عليه الزمن، ووعد العديد منهم «بالاستعداد الوظيفي» دون تقديم عمق عملي، وبعد استثمار مئات الساعات ظهر نمط واضح: عدد قليل فقط من الدورات التدريبية يبني باستمرار القدرات الواقعية والثقة والمهارات القابلة للتوظيف
تلخص هذه المقالة هذه التجربة في أربع دورات دراسية لعلم البيانات تتفوق حقاً على بقية الدورات التدريبية – استناداً إلى عمق المنهج الدراسي وجودة التدريس والمشاريع العملية والقيمة طويلة المدى
1. IBM Data Science Professional Certificate (Coursera)
الأفضل لـ: المبتدئين المنظمين الذين يريدون تغطية شاملة
يتفوق هذا البرنامج في بناء أساس قوي
وتحليل البيانات والتصور والتعلم الآلي التمهيدي SQL و Python وهو يغطي
بمسار تعليمي واضح ما يجعلها فعالة ليس الحداثة بل الوضوح والبنية
لماذا يعمل؟
المنهج التقدمي مع عدم وجود خلفية مفترضة •
مختبرات عملية تستخدم مجموعات بيانات حقيقية •
التركيز القوي على الأدوات المتوافقة مع معايير الصناعة •
: القيود
يعد عمق التعلم الآلي أمراً تمهيدياً •
تركيز أقل على الرياضيات المتقدمة أو تحسين النموذج •
: الوجبات الجاهزة في العالم الحقيقي
لقد انتهيت من معرفة كيفية عمل سير عمل علوم البيانات فعلياً في بيئات الأعمال، وليس فقط التعريفات
2. علم البيانات التطبيقي باستخدام بايثون (جامعة ميشيغان – كورسيرا)
الأفضل لـ: المتعلمين الذين يريدون التفكير كعالم بيانات
يحول هذا التخصص التركيز من الأدوات إلى التفكير، فبدلاً من “ما هي الوظيفة التي يجب الاتصال بها” فإنه يؤكد على سبب اتخاذ قرارات تحليلية معينة
لماذا يعمل؟
ومعالجة البيانات NumPy و pandas التركيز القوي على •
معالجة ممتازة لتنظيف البيانات وهندسة الميزات •
تفكير تحليلي حقيقي وليس مجرد تنفيذ التعليمات البرمجية •
: القيود
يتطلب أساسيات بايثون الصلبة •
التصميم المرئي وواجهة المستخدم تبدو قديمة •
: مثال
ستتعلم كيف يمكن لخيارات المعالجة المسبقة الدقيقة أن تغير نتائج النموذج بشكل كبير – وهي مهارة أساسية في العالم الحقيقي
Advertisements
3. (Coursera) Andrew Ng التعلم الآلي بواسطة
الأفضل لـ: فهم المنطق الأساسي للتعلم الآلي
تظل هذه الدورة معياراً، فعلى الرغم من أنه لا يستخدم المكتبات الحديثة بشكل كبير إلا أنه يشرح مفاهيم التعلم الآلي بوضوح استثنائي
لماذا يعمل؟
الحدس العميق للخوارزميات •
تفسيرات رياضية واضحة دون تعقيد لا لزوم له •
أسس مفاهيمية قوية •
: القيود
Python بدلاً من Octave/MATLAB يستخدم •
الحد الأدنى من التركيز على أنظمة النشر أو الإنتاج •
القيمة العملية
بمجرد أن تفهم سبب عمل النسب المتدرج، يصبح إتقان كل إطار عمل حديث لتعلم الآلة أسهل
4. (Udemy–المعسكر التدريبي لعلوم البيانات (خوسيه بورتيلا
الأفضل لـ: المتعلمين العمليين المعتمدين على الأدوات
هذه الدورة كثيفة وعملية وقابلة للتنفيذ للغاية، إنها فعالة بشكل خاص للمتعلمين الذين يريدون التعرض الفوري لسير العمل الحقيقي باستخدام بايثون
هذا النوع من الطلاقة العملية هو بالضبط ما يتوقعه أصحاب العمل
كيفية اختيار المناسب لك
:كل دورة من هذه الدورات تتفوق في بُعد مختلف، يعتمد الاختيار “الأفضل” على هدفك
مبتدئ كامل → شهادة علوم بيانات •
العمق التحليلي ← تخصص جامعة ميشيغان •
Andrew Ng نظرية التعلم الآلي ← دورة تعلم الآلة لـ •
مهارات العمل العملية ← المعسكر التدريبي لخوسيه بورتيلا •
في كثير من الحالات يؤدي الجمع بين دورة تأسيسية واحدة ودورة عملية واحدة إلى الحصول على أقوى النتائج
الخلاصة : الجودة تغلب الكمية
علمتني تجربة العشرات من الدورات التدريبية درساً بسيطاً: التقدم لا يأتي من استهلاك المزيد من المحتوى ولكن من اختيار المحتوى المناسب وتطبيقه بعمق، بحيث توفر هذه الدورات الأربع باستمرار الوضوح والكفاءة والثقة وهي الصفات التي تدفع الحياة المهنية إلى الأمام
إذا كنت جاداً بشأن علم البيانات فابدأ بواحدة من هذه الأمور والتزم بها بالكامل وقم ببناء المشاريع جنباً إلى جنب مع الدروس
Local business partnerships are cooperative relationships between nearby organizations—shops, service providers, nonprofits, schools, and civic groups—built to create mutual value through referrals, shared audiences, and joint projects. For business owners, the payoff is practical: warmer trust, steadier foot traffic, and reputational momentum that spreads across a town faster than any single campaign.
A fast snapshot
Lead with shared customers, not grand ideas.
Make the first ask tiny, time-boxed, and measurable.
Protect trust with clear roles + quick follow-through.
Review monthly and keep what works; let the rest go.
Why local partnerships break (and the fix)
Problem: Many partnerships begin with vague excitement (“We should collaborate!”) and end with vague silence. No one owns the next step. The “win” is fuzzy. The calendar fills up.
Partnerships aren’t only about being friendly; they’re about communicating clearly, negotiating fairly, and leading through follow-through. Some business owners sharpen those skills through structured education—especially when they need a format that fits around work, family, and unpredictable weeks. If you’re exploring that route,take a look at this for an overview of online business degree options and specializations designed for flexibility.
Advertisements
The 7-step partnership builder checklist
Pick one goal. Referrals, foot traffic, brand trust, recruitment—choose one.
List your “customer neighbors.” Who serves your people before/after you do?
Qualify alignment quickly. Similar quality standards, compatible values, overlapping audience.
Propose one pilot. One event, one bundle, or one referral loop—time-boxed.
Put roles in writing. One paragraph: who does what, by when, with what budget.
Track one signal. A promo code, a referral card, a shared spreadsheet—keep it simple.
Debrief and decide. Continue, adjust, or end cleanly. Data over drama.
Partnership hygiene that keeps things from fading
A partnership can work and still drift, simply because nobody maintains it. Borrow a few simple rules:
Monthly touchpoint (15 minutes): what happened, what’s next, who owns it.
Quarterly refresh: a new offer, a new shared story, or a new activation.
Respect bandwidth: avoid plans that require heroics to execute.
Protect trust: if you can’t deliver, communicate early—silence is the real relationship killer.
One resource worth bookmarking before your next outreach
If you want a practical, low-pressure way to sharpen your partnership approach—without paying for a consultant up front—SCORE is worth knowing. SCORE is a nonprofit resource partner associated with the U.S. Small Business Administration and offers free mentoring and educational workshops for small business owners. Here’s how it helps specifically with local partnerships:
Pressure-test your pitch: Bring your draft outreach message and get feedback on clarity and tone.
Tighten your offer: Mentors can help you turn “Let’s collaborate” into a concrete pilot with roles, timeline, and a simple measurement plan.
Choose better partners: A quick conversation can reveal whether you’re chasing “cool” or chasing alignment (customer overlap + operational fit).
Build a repeatable rhythm: Mentorship is especially useful when you want a sustainable process—weekly outreach, monthly activation, quarterly review—without overcomplicating it.
FAQ
How many partnerships should I run at once? Start with 2–3 active pilots. If you can’t reliably follow up, you’re not building a network—you’re collecting half-starts.
What if I’m worried a partner will steal customers? Choose partners with complementary services, not substitutes. Then state expectations plainly: shared benefit, separate businesses.
How do I measure success without overcomplicating it? Track one primary metric (referrals, redemptions, attendees) and one trust signal (repeat mentions, customer feedback, reviews mentioning the collaboration).
When should I walk away? If execution is consistently one-sided, communication stays sloppy, or customers complain about the partner’s quality, step back quickly and politely.
Conclusion
Local partnerships work best when they’re treated like small experiments: a clear goal, a simple pilot, and real follow-through. Start tiny, keep roles obvious, and maintain the relationship with lightweight check-ins so it doesn’t depend on “whenever we have time.” Over months, the compounding effect is real—customers begin to experience you as part of a trusted local network, not just a standalone business.
Advertisements
دليل الشراكة المحلية: بناء علاقات تجارية متينة في مجتمعك
Advertisements
الشراكات التجارية المحلية هي علاقات تعاونية بين مؤسسات متجاورة – متاجر ومقدمي خدمات ومنظمات غير ربحية ومدارس وهيئات مدنية، تُبنى لخلق قيمة متبادلة من خلال الإحالات والجمهور المشترك والمشاريع المشتركة
بالنسبة لأصحاب الأعمال فإن العائد عملي: ثقة أكبر وحركة عملاء أكثر استقراراً وسمعة طيبة تنتشر في المدينة أسرع من أي حملة منفردة
لمحة سريعة
ابدأ بالعملاء المشتركين لا بالأفكار الطموحة ●
اجعل الطلب الأول بسيطاً ومحدداً زمنياً وقابلاً للقياس ●
حافظ على الثقة من خلال تحديد الأدوار بوضوح ومتابعة سريعة ●
راجع شهرياً واحتفظ بما يُجدي نفعاً وتخلَّ عن الباقي ●
لماذا تفشل الشراكات المحلية (وكيفية حلها)
المشكلة: تبدأ العديد من الشراكات بحماس غامض (“يجب أن نتعاون!”) وتنتهي بصمت مبهم، لا أحد مسؤول عن الخطوة التالية، “النجاح” غير واضح، والجدول الزمني مزدحم
الحل: تعامل مع الشراكات كعمليات صغيرة لا كأحلام كبيرة، حدد هدفاً مشتركاً واحداً ومسؤولاً واحداً من كل طرف، ومشروعاً تجريبياً واحداً له تاريخ بدء وانتهاء
النتيجة: تبني علاقات تصمد أمام تقلبات المواسم لأن العمل واضح ومحدد وقابل للتكرار
أنواع الشراكات، جنباً إلى جنب
مشكلة شائعة
تجربة أولية بسيطة
الأفضل لـ
نوع الشراكة
عدم المتابعة = عدم وجود نتائج
اختبار إحالة لمدة أسبوعين + متابعة
تدفق موثوق للعملاء المحتملين
تبادل الإحالات
رسائل متضاربة
ورشة عمل مشتركة أو فعالية مؤقتة
الوصول إلى جمهور جديد
التسويق المشترك
ارتباك في التسعير
باقة من خدمتين/منتجين
معدل تحويل أعلى
العرض المجمع
أجواء استعراضية
رعاية أو المشاركة في استضافة فعالية محلية ذات هدف نبيل
الثقة والسمعة الطيبة
المشاركة المجتمعية
المبالغة في تقدير القدرات
قائمة مقدمي الخدمات المفضلين
الفعالية التشغيلية
نظام الموردين البيئي
تعزيز مهارات بناء الشراكات
لا تقتصر الشراكات على الودّ فحسب بل تشمل التواصل الواضح والتفاوض العادل والقيادة الفعّالة من خلال المتابعة الدقيقة، إذ يحرص بعض أصحاب الأعمال على صقل هذه المهارات من خلال برامج تعليمية منظمة خاصةً عندما يحتاجون إلى برنامج يتناسب مع ظروف العمل والأسرة ومع تقلبات الحياة الأسبوعية، إذا كنت تفكر في هذا الخيار فإليك نظرة عامة على خيارات شهادات إدارة الأعمال عبر الإنترنت والتخصصات المصممة لتوفير المرونة
Advertisements
:قائمة التحقق لبناء شراكة ناجحة (7 خطوات)
1. اختر هدفاً واحداً: الإحالات أو زيادة عدد العملاء أو بناء ثقة العلامة التجارية أو التوظيف – اختر هدفاً واحداً
2. حدد “جيرانك من العملاء”: من يخدم عملائك قبلك أو بعدك؟
٦. ركّز على إشارة واحدة: رمز ترويجي، بطاقة إحالة، جدول بيانات مشترك – اجعل الأمر بسيطاً
٧. قيّم العلاقة وقرر: استمر، عدّل، أو أنهِ العلاقة بسلاسة، فالبيانات أهم من الدراما
ضمان استمرارية الشراكة
: قد تنجح الشراكة ولكنها تتلاشى ببساطة لعدم وجود من يتابعها، إليك بعض القواعد البسيطة
تواصل شهري (١٥ دقيقة): ما الذي حدث، ما الخطوة التالية، ومن المسؤول؟ ●
تحديث ربع سنوي: عرض جديد، قصة مشتركة جديدة، أو فعالية جديدة ●
راعِ الوقت: تجنّب الخطط التي تتطلب جهداً خارقاً للتنفيذ ●
حافظ على الثقة: إذا لم تتمكن من الوفاء بالوعود، تواصل مبكراً – الصمت هو قاتل العلاقات ●
مورد قيّم قبل تواصلك القادم
إذا كنت ترغب في طريقة عملية وسهلة لتحسين نهج شراكتك – دون دفع تكلفة استشاري مقدماً
يستحق المعرفة SCORE فإن
هي منظمة غير ربحية شريكة في مجال الموارد SCORE
تابعة لإدارة الأعمال الصغيرة الأمريكية وتقدم خدمات إرشادية وورش عمل تعليمية مجانية لأصحاب المشاريع الصغيرة
: إليك كيف تُساعد تحديداً في بناء شراكات محلية
اختبر عرضك: أحضر مسودة رسالتك التسويقية واحصل على ملاحظات حول وضوحها وأسلوبها ●
حسّن عرضك: يُمكن للمرشدين مساعدتك في تحويل فكرة “لنتعاون” إلى مشروع تجريبي مُحدد الأدوار والجدول الزمني وخطة قياس بسيطة
اختر شركاء أفضل: يُمكن لمحادثة سريعة أن تكشف ما إذا كنت تسعى وراء “التميز” أم تسعى وراء التوافق (تداخل العملاء + التوافق التشغيلي)
ابنِ وتيرة عمل مُستدامة: يُعد الإرشاد مفيداً للغاية عندما ترغب في عملية مُستدامة – تواصل أسبوعي، تفعيل شهري، مراجعة ربع سنوية – دون تعقيدها
: الأسئلة الشائعة
كم عدد الشراكات التي يجب أن أديرها في وقت واحد؟
ابدأ بـ 2-3 مشاريع تجريبية نشطة، إذا لم تتمكن من المتابعة بانتظام فأنت لا تبني شبكة علاقات بل تجمع بدايات غير مكتملة
ماذا لو كنت قلقاً من أن يسرق أحد الشركاء عملاءه؟
اختر شركاءً يقدمون خدمات مكملة لا بدائل، ثم حدد التوقعات بوضوح: منفعة مشتركة، أعمال منفصلة
كيف أقيس النجاح دون تعقيده؟
تتبع مؤشراً رئيسياً واحداً (الإحالات، عمليات الاسترداد، الحضور) ومؤشراً واحداً للثقة (تكرار الإشارات، آراء العملاء، التقييمات التي تذكر التعاون)
متى يجب عليّ الانسحاب؟
إذا كان التنفيذ أحادي الجانب باستمرار، أو كان التواصل غير دقيق، أو اشتكى العملاء من جودة الشريك، فانسحب بسرعة وبأدب
: الخلاصة
تنجح الشراكات المحلية بشكل أفضل عندما تُعامل كتجارب صغيرة: هدف واضح وتجربة أولية بسيطة ومتابعة جادة، ابدأ على نطاق صغير واجعل الأدوار واضحة وحافظ على العلاقة من خلال اجتماعات متابعة بسيطة حتى لا تعتمد على “متى ما توفر لدينا الوقت”، وعلى مدى شهور يصبح التأثير التراكمي حقيقياً – يبدأ العملاء في اعتبارك جزءاً من شبكة محلية موثوقة وليس مجرد شركة مستقلة
With the sunrise of 2026, the fields of Data Science and Machine Learning (ML) continue to evolve at an unprecedented pace. Organizations across industries are investing heavily in intelligent systems to drive decision-making, optimize operations, and create competitive advantages. Whether you’re a data professional, business leader, or aspiring technologist, understanding emerging trends is essential for staying relevant and future-ready.
This article highlights the key trends shaping the Data Science and ML landscape in 2026, offers real-world context, and provides actionable directions for preparation.
1. Democratization of AI and ML
In 2026, accessibility to advanced AI and ML tools is accelerating. Platforms like automated ML (AutoML), drag-and-drop model builders, and low-code environments enable non-experts to build and deploy predictive models. This trend reduces barriers to entry for smaller businesses and expands adoption beyond traditional data science teams.
Real-Life Example: A mid-sized retail chain uses AutoML tools to forecast inventory demand across locations without hiring a large data team — enabling better stock planning during peak seasons.
Preparation Tip: Familiarize yourself with leading AutoML environments (e.g., Google AutoML, H2O.ai) and focus on interpreting model outputs and business implications rather than just building models.
2. Growth of Generative AI and Large Language Models
Generative AI, powered by large language models (LLMs), has transitioned from novelty to enterprise adoption. Use cases in 2026 span automated report writing, code generation, data augmentation, simulation modeling, and real-time decision support.
Real-Life Example: A financial services firm uses LLMs to automate compliance reporting, reducing manual effort and improving accuracy.
Preparation Tip: Learn how to fine-tune and evaluate LLMs safely, and understand ethical implications, especially around bias and data privacy.
3. Responsible AI and Explainability
With greater reliance on automated decision systems, there is heightened scrutiny on ethical AI practices. Explainability — the ability to interpret model decisions — is now a compliance and trust requirement. Regulatory frameworks in Europe, the US, and beyond emphasize transparency and accountability.
Real-Life Example: A healthcare provider deploying diagnostic models must provide explainable results to clinicians to justify treatment recommendations.
Preparation Tip: Study explainable AI (XAI) techniques like SHAP, LIME, and counterfactual explanations. Build documentation and model governance practices.
4. Edge AI and Real-Time Analytics
Edge computing — processing data near the source rather than in centralized cloud servers — is becoming critical for latency-sensitive applications. Sensors, IoT devices, and autonomous systems use lightweight ML models for real-time decisioning.
Real-Life Example: In smart cities, traffic sensors process vehicle flow data on the edge to optimize signals without cloud round-trips.
Preparation Tip: Gain skills in edge-optimized ML frameworks and learn how to design models that balance performance, size, and energy efficiency.
Advertisements
5. Data Fabric and Unified Data Infrastructure
Data fabric architectures unify distributed data sources, metadata, and governance. This enables streamlined access, reduces silos, and supports consistent analytics across systems. Modern enterprise architectures adopt these fabrics to accelerate insights and reduce integration friction.
Real-Life Example: A global insurer uses a data fabric to harmonize claims data from multiple regions, improving cross-functional analytics and customer service insights.
Preparation Tip: Understand data mesh vs. data fabric paradigms, and focus on metadata management and data governance strategies.
6. Augmented Analytics and Decision Intelligence
Augmented analytics uses AI and ML to enhance data exploration, pattern detection, and insight generation. Decision intelligence goes further by modeling and recommending actions based on predicted outcomes — transforming analytics into a decision support discipline.
Real-Life Example: A logistics company uses augmented analytics dashboards to identify bottlenecks and simulate routing scenarios before implementing changes.
Preparation Tip: Learn tools that integrate natural language querying, automated insights, and prescriptive analytics.
7. Sustainability and Ethical Data Practices
Environmental sustainability and ethical data stewardship are now core priorities. Data centers, model training, and compute-intensive processes are evaluated for carbon footprints. Ethical considerations also extend to data privacy, algorithmic fairness, and community impacts.
Real-Life Example: An energy provider uses ML to optimize grid load and reduce emissions, aligning analytics with sustainability goals.
Preparation Tip: Familiarize yourself with sustainable AI practices and frameworks for ethical data handling.
Conclusion: Preparing for 2026
As Data Science and Machine Learning continue to mature, professionals must balance technical expertise with ethical judgment and domain understanding. Staying current with emerging tools, embracing multidisciplinary collaboration, and focusing on real-world impact will differentiate successful practitioners in 2026 and beyond. Whether you are building next-generation models or guiding organizational strategy, a future-focused mindset is essential.
Advertisements
أهم اتجاهات علوم البيانات والتعلم الآلي التي ستشكل ملامح عام 2026
Advertisements
مع حلول عام 2026 يستمر مجالا علم البيانات والتعلم الآلي في التطور بوتيرة غير مسبوقة، إذ تستثمر المؤسسات في مختلف القطاعات بكثافة في الأنظمة الذكية لدعم اتخاذ القرارات وتحسين العمليات وخلق مزايا تنافسية، فسواءً كنت متخصصاً في البيانات أو قائداً في مجال الأعمال أو طموحاً في مجال التكنولوجيا فإن فهم الاتجاهات الناشئة أمرٌ ضروري للبقاء على صلة بالموضوع والاستعداد للمستقبل
تُسلط هذه المقالة الضوء على التريندات الرئيسية التي تُشكّل مشهد علم البيانات والتعلم الآلي في عام 2026 وتقدم سياقاً واقعياً وتوفر توجيهات عملية للاستعداد
1. إتاحة الذكاء الاصطناعي والتعلم الآلي للجميع
في عام 2026 تتسارع إمكانية الوصول إلى أدوات الذكاء الاصطناعي والتعلم الآلي المتقدمة
(AutoML) إذ أن منصات مثل التعلم الآلي
وأدوات بناء النماذج بالسحب والإفلات وبيئات البرمجة منخفضة التعليمات البرمجية تمكّن غير المتخصصين من بناء نماذج تنبؤية ونشرها، بحيث يُقلل هذا الاتجاه من عوائق الدخول للشركات الصغيرة ويُوسع نطاق التبني ليشمل فرقاً أخرى غير فرق علم البيانات التقليدية
مثال واقعي: تستخدم سلسلة متاجر تجزئة متوسطة الحجم
للتنبؤ بالطلب على المخزون (AutoML) أدوات التعلم الآلي المؤتمت
في جميع فروعها دون الحاجة إلى توظيف فريق بيانات ضخم مما يُتيح تخطيطاً أفضل للمخزون خلال مواسم الذروة
نصيحة تحضيرية: تعرّف على بيئات التعلم الآلي المؤتمت الرائدة
Google AutoML و H2O.ai :مثل
وركّز على تفسير مخرجات النماذج وتأثيراتها على الأعمال بدلاً من مجرد بناء النماذج
2. نمو الذكاء الاصطناعي التوليدي ونماذج اللغة الكبيرة
انتقل الذكاء الاصطناعي التوليدي
(LLMs) المدعوم بنماذج اللغة الكبيرة
من كونه تقنية جديدة إلى اعتماد مؤسسي واسع النطاق، بحيث تشمل حالات الاستخدام في عام 2026 كتابة التقارير المؤتمتة وتوليد التعليمات البرمجية وتوسيع البيانات ونمذجة المحاكاة ودعم اتخاذ القرارات في الوقت الفعلي
مثال واقعي: تستخدم شركة خدمات مالية نماذج اللغة الكبيرة لأتمتة تقارير الامتثال مما يقلل الجهد اليدوي ويحسّن الدقة
نصيحة تحضيرية: تعلّم كيفية ضبط نماذج اللغة الكبيرة وتقييمها بأمان وافهم الآثار الأخلاقية لا سيما فيما يتعلق بالتحيز وخصوصية البيانات
3. الذكاء الاصطناعي المسؤول وقابلية التفسير
مع ازدياد الاعتماد على أنظمة اتخاذ القرارات الآلية يزداد التدقيق في ممارسات الذكاء الاصطناعي الأخلاقية، إذ أصبحت قابلية التفسير – أي القدرة على فهم قرارات النموذج – شرطاً أساسياً للامتثال وبناء الثقة، وتؤكد الأطر التنظيمية في أوروبا والولايات المتحدة وغيرها على الشفافية والمساءلة
مثال واقعي: يجب على مقدم الرعاية الصحية الذي يستخدم نماذج تشخيصية تقديم نتائج قابلة للتفسير للأطباء لتبرير توصيات العلاج
أصبحت الحوسبة على الحافة – أي معالجة البيانات بالقرب من مصدرها بدلاً من خوادم السحابة المركزية – بالغة الأهمية للتطبيقات الحساسة للتأخير، إذ تستخدم أجهزة الاستشعار وأجهزة إنترنت الأشياء والأنظمة ذاتية التشغيل نماذج تعلم آلي خفيفة الوزن لاتخاذ القرارات الآنية
مثال واقعي: في المدن الذكية تعالج أجهزة استشعار حركة المرور بيانات تدفق المركبات على الحافة لتحسين الإشارات دون الحاجة إلى نقل البيانات إلى السحابة
نصيحة تحضيرية: اكتسب مهارات في أطر عمل التعلم الآلي المُحسّنة للحافة وتعلّم كيفية تصميم نماذج تُوازن بين الأداء والحجم وكفاءة استهلاك الطاقة
Advertisements
٥. بنية البيانات الموحدة
توحّد بنى بنية البيانات الموحدة مصادر البيانات الموزعة والبيانات الوصفية والحوكمة، وهذا يُسهّل الوصول ويُقلّل من العوائق ويدعم التحليلات المتسقة عبر الأنظمة، إذ تعتمد بنى المؤسسات الحديثة هذه البنى لتسريع استخلاص الرؤى وتقليل احتكاك التكامل
مثال واقعي: تستخدم شركة تأمين عالمية بنية بيانات موحدة لتنسيق بيانات المطالبات من مناطق متعددة مما يُحسّن التحليلات متعددة الوظائف ورؤى خدمة العملاء
نصيحة تحضيرية: افهم الفرق بين نموذج شبكة البيانات ونموذج نسيج البيانات وركّز على إدارة البيانات الوصفية واستراتيجيات حوكمة البيانات
6. التحليلات المعززة وذكاء القرار
تستخدم التحليلات المعززة الذكاء الاصطناعي والتعلم الآلي لتحسين استكشاف البيانات واكتشاف الأنماط واستخلاص الرؤى، أما ذكاء القرار فيتجاوز ذلك من خلال نمذجة الإجراءات والتوصية بها بناءً على النتائج المتوقعة مما يحوّل التحليلات إلى أداة لدعم اتخاذ القرارات
مثال واقعي: تستخدم شركة لوجستية لوحات معلومات التحليلات المعززة لتحديد الاختناقات ومحاكاة سيناريوهات التوجيه قبل تطبيق التغييرات
نصيحة تحضيرية: تعلّم الأدوات التي تدمج الاستعلام باللغة الطبيعية والرؤى الآلية والتحليلات التوجيهية
7. الاستدامة وممارسات البيانات الأخلاقية
تُعدّ الاستدامة البيئية والإدارة الأخلاقية للبيانات من الأولويات الأساسية حالياً، ويتم تقييم مراكز البيانات وتدريب النماذج والعمليات كثيفة الحوسبة من حيث البصمة الكربونية، كما تشمل الاعتبارات الأخلاقية خصوصية البيانات والعدالة الخوارزمية والتأثيرات المجتمعية
مثال واقعي: تستخدم إحدى شركات الطاقة تقنيات التعلّم الآلي لتحسين استهلاك الطاقة في الشبكة وتقليل الانبعاثات بما يتماشى مع أهداف الاستدامة
نصيحة تحضيرية: تعرّف على ممارسات الذكاء الاصطناعي المستدام وأطر العمل الخاصة بالتعامل الأخلاقي مع البيانات
الخلاصة: الاستعداد لعام ٢٠٢٦
مع استمرار تطور علوم البيانات والتعلّم الآلي يجب على المتخصصين الموازنة بين الخبرة التقنية والحكم الأخلاقي وفهم المجال، إذ أن مواكبة أحدث الأدوات وتبني التعاون متعدد التخصصات والتركيز على التأثير في الواقع العملي هي عوامل تميز الممارسين الناجحين في عام ٢٠٢٦ وما بعده، فسواء كنت تعمل على بناء نماذج الجيل القادم أو توجيه استراتيجية مؤسسية فإن التفكير المستقبلي ضروري
Introduction: The Uncomfortable Question No One Wants to Ask
At some point in every professional’s journey, especially in technology and technical fields, a quiet doubt begins to form. You send applications, polish your portfolio, rewrite your CV again and again, and still—nothing. No callbacks. No meaningful feedback. Just silence. The instinctive reaction is to blame the market, the economy, AI, or even nepotism. And while those factors exist, the uncomfortable truth is often closer to home. The hiring world has changed faster than most professionals are willing to admit, and many capable individuals are still operating with outdated assumptions about what “being qualified” actually means today.
The Skills You Learned Are Not the Skills Companies Pay For Anymore
In technical and technological jobs, knowledge expires faster than ever. A skill that was premium three years ago may now be baseline—or worse, obsolete. Many candidates still rely on certificates, degrees, or frameworks that once guaranteed employment, without realizing that employers now evaluate adaptability more than static expertise.
Modern companies are no longer impressed by long lists of tools. They want evidence of problem-solving under uncertainty. They want engineers who can think in systems, designers who understand business logic, and analysts who can translate data into decisions. Knowing how something works matters less than knowing why it matters and how it creates value.
The harsh reality is that many candidates are technically trained but strategically empty.
You’re Competing With People Who Think Like Businesses
One of the most misunderstood shifts in hiring is that companies no longer hire “employees.” They hire micro-businesses. Each candidate is evaluated as a unit of ROI. What value do you generate? How fast can you adapt? How much supervision do you need?
Candidates who still think in terms of job descriptions lose to those who think in terms of outcomes. A developer who says, “I build websites” competes poorly against one who says, “I help companies increase conversions and reduce bounce rates through performance-driven design.” The second person speaks the language of impact, not tasks.
Hiring managers are overwhelmed. They don’t want potential; they want leverage.
Advertisements
Technology Is No Longer the Differentiator — Thinking Is
Ironically, in a world obsessed with technology, technology itself has become cheap. AI can write code, design layouts, and automate workflows. What cannot be automated easily is judgment, context awareness, and decision-making under ambiguity.
Employers are quietly shifting toward professionals who can collaborate with AI rather than compete against it. Those who fear automation often try to defend their relevance by clinging to tools. Those who thrive learn to orchestrate systems, validate outputs, and make strategic calls.
If your value is defined only by execution, you are replaceable. If your value lies in interpretation, synthesis, and direction, you become essential.
Your Online Presence Is Probably Hurting You
In technical fields, your digital footprint is now part of the hiring process whether you like it or not. Recruiters look at GitHub, LinkedIn, portfolios, and even how you explain your work publicly. Silence is interpreted as stagnation.
Many capable professionals make the mistake of waiting until they are “perfect” before sharing insights or projects. Meanwhile, others with half the experience dominate visibility simply because they document their thinking. Employers don’t expect perfection—they look for clarity, consistency, and learning velocity.
If your online presence does not tell a coherent story about who you are and how you think, you are invisible.
The Hidden Skill: Communication in a Technical World
Technical excellence without communication is invisible labor. Modern teams are cross-functional, remote, and fast-moving. Being able to explain complex ideas simply is no longer optional—it is a core technical skill.
Hiring managers increasingly reject candidates who “know everything” but cannot articulate trade-offs, justify decisions, or collaborate without friction. Clear communication is now a productivity multiplier, not a soft skill.
Those who master it accelerate. Those who ignore it stagnate.
Conclusion: The Market Is Not Broken — It’s Evolved
The uncomfortable truth is that the job market is not unfair; it is unforgiving to stagnation. Technical roles now demand strategic thinking, adaptability, and visible value creation. The people getting hired are not necessarily smarter—they are more aligned0020with how modern organizations actually function.
If you feel invisible, it may not be because you lack talent, but because your professional narrative no longer matches reality. The moment you stop asking “Why won’t they hire me?” and start asking “What problem do I solve today?” everything changes.
The market is listening. You just need to learn how to speak its language.
Advertisements
ما الذي تغير في التوظيف – لماذا لم تتغير أنت؟
Advertisements
السؤال المحرج الذي لا يرغب أحد في طرحه
في مرحلة ما من مسيرة كل محترف وخاصة في المجالات التقنية يبدأ الشك بالتسلل إليه، ترسل طلبات التوظيف وتُحسّن ملف أعمالك وتُعيد كتابة سيرتك الذاتية مراراً وتكراراً، ومع ذلك لا شيء! لا ردود، لا ملاحظات مفيدة .. بل مجرد صمت، ورد الفعل التلقائي في هذه الحالة هو إلقاء اللوم على السوق أو على الاقتصاد أو حتى على الذكاء الاصطناعي وربما على المحسوبيات ، وبينما توجد هذه العوامل فإن الحقيقة المُزعجة غالباً ما تكون أقرب إلينا: لقد تغير عالم التوظيف بوتيرة أسرع مما يرغب معظم المحترفين في الاعتراف به، ولا يزال العديد من الأفراد الأكفاء يعملون وفقاً لافتراضات قديمة حول معنى “التأهل” اليوم
: المهارات التي اكتسبتها لم تعد هي المهارات التي تدفع الشركات مقابلها
في الوظائف التقنية تتقادم المعرفة أسرع من أي وقت مضى، فقد تكون المهارة التي كانت مطلوبة بشدة قبل ثلاث سنوات الآن أساسية – أو أسوأ من ذلك ( بالية ) ، إذ لا يزال العديد من المرشحين يعتمدون على الشهادات أو الدرجات العلمية أو الأطر التي كانت تضمن لهم التوظيف في السابق دون إدراك أن أصحاب العمل يُقيّمون الآن القدرة على التكيف أكثر من الخبرة الثابتة
لم تعد الشركات الحديثة تنبهر بقوائم الأدوات الطويلة، إنها تبحث عن دليل على القدرة على حل المشكلات في ظل عدم اليقين، فهي تريد مهندسين قادرين على التفكير المنهجي ومصممين يفهمون منطق الأعمال ومحللين قادرين على تحويل البيانات إلى قرارات بالإضافة إلى معرفة كيفية عمل شيء ما أقل أهمية من معرفة سبب أهميته وكيف يخلق قيمة
الحقيقة المرة هي أن العديد من المرشحين مدربون تقنياً لكنهم يفتقرون إلى التفكير الاستراتيجي
:أنت تتنافس مع أشخاص يفكرون كشركات
من أكثر التحولات التي يساء فهمها في التوظيف هو أن الشركات لم تعد توظف “موظفين” بالمعنى التقليدي، بل توظف شركات صغيرة، بحيث يُقيّم كل مرشح كوحدة عائد على الاستثمار: ما القيمة التي تضيفها ؟ ما مدى سرعة تكيفك؟ ما مقدار الإشراف الذي تحتاجه؟
المرشحون الذين ما زالوا يفكرون من منظور الوصف الوظيفي يخسرون أمام أولئك الذين يفكرون من منظور النتائج، فالمطور الذي يقول: “أصمم مواقع ويب” ينافس بشكل ضعيف من يقول: “أساعد الشركات على زيادة التحويلات وتقليل معدلات الارتداد من خلال التصميم القائم على الأداء”، هنا الشخص الثاني يتحدث لغة التأثير لا لغة المهام
مديرو التوظيف مثقلون بالأعباء، لا يسعون وراء الإمكانات بل وراء النفوذ
Advertisements
:لم تعد التكنولوجيا هي العامل الحاسم، بل التفكير
من المفارقات في عالم مهووس بالتكنولوجيا أن التكنولوجيا نفسها أصبحت رخيصة، إذ يستطيع الذكاء الاصطناعي كتابة البرامج وتصميم المخططات وأتمتة سير العمل، لكن ما لا يمكن أتمتته بسهولة هو الحكم وفهم السياق واتخاذ القرارات في ظل الغموض
يتجه أصحاب العمل بهدوء نحو المحترفين القادرين على التعاون مع الذكاء الاصطناعي بدلاً من منافسته، فغالباً ما يحاول من يخشون الأتمتة الحفاظ على أهميتهم بالتشبث بالأدوات، أما الناجحون فيتعلمون كيفية إدارة الأنظمة والتحقق من صحة المخرجات واتخاذ القرارات الاستراتيجية
إذا كانت قيمتك تُحدد فقط بالتنفيذ فأنت قابل للاستبدال، أما إذا كانت قيمتك تكمن في التفسير والتحليل والتوجيه فأنت تصبح أساسياً
: ربما يضرّك وجودك على الإنترنت
في المجالات التقنية أصبح وجودك الرقمي جزءاً لا يتجزأ من عملية التوظيف شئت أم أبيت، بحيث ينظر مسؤولو التوظيف إلى حساباتك
وملفات أعمالك GitHub وLinkedIn على
وحتى طريقة شرحك لعملك علناً، يُفسَّر الصمت على أنه جمود
يقع العديد من المحترفين الأكفاء في خطأ انتظارهم حتى يصبحوا “مثاليين” قبل مشاركة أفكارهم أو مشاريعهم، وفي المقابل يهيمن آخرون ممن يملكون نصف الخبرة على الظهور لمجرد توثيقهم لأفكارهم، لا يتوقع أصحاب العمل الكمال بل يبحثون عن الوضوح والاتساق وسرعة التعلم
إذا لم يُقدّم وجودك على الإنترنت صورة متماسكة عن شخصيتك وطريقة تفكيرك فأنت غير مرئي
المهارة الخفية : التواصل في عالم التقنية
التميز التقني بدون تواصل هو عمل غير مرئي، ففرق العمل الحديثة متعددة التخصصات وتعمل عن بُعد وسريعة التطور، إذ لم يعد شرح الأفكار المعقدة أمراً اختيارياً بل أصبح مهارة تقنية أساسية
يرفض مديرو التوظيف بشكل متزايد المرشحين الذين “يعرفون كل شيء” لكنهم لا يستطيعون شرح المفاضلات أو تبرير القرارات أو التعاون بسلاسة، فالتواصل الواضح الآن عاملٌ مُضاعفٌ للإنتاجية وليس مجرد مهارة ثانوية
من يتقنه يتقدم بخطى ثابتة ومن يتجاهله يتراجع
:الخلاصة: السوق ليس معيباً، بل متطور
الحقيقة المُزعجة هي أن سوق العمل ليس ظالماً بل هو لا يرحم الركود، إذ تتطلب الوظائف التقنية الآن تفكيراً استراتيجياً وقدرة على التكيف وخلق قيمة ملموسة، وليس بالضرورة أن يكون الموظفون الجدد أذكى بل هم أكثر انسجاماً مع آلية عمل المؤسسات الحديثة
إذا شعرتَ بأنك غير مرئي فقد لا يكون ذلك بسبب نقص الموهبة بل لأن سردك المهني لم يعد يُطابق الواقع، ففي اللحظة التي تتوقف فيها عن التساؤل “لماذا لا يوظفونني؟” وتبدأ بالتساؤل “ما المشكلة التي أحلها اليوم؟” يتغير كل شيء
Most developers believe that meaningful income only comes from large startups, funded products, or years of continuous development. My experience contradicted that belief entirely. One quiet weekend, driven by a very practical problem I personally faced, I built a small Python tool with no business plan, no marketing strategy, and no expectation of profit. A few weeks later, that same tool was covering my rent consistently. Not because it was complex or revolutionary, but because it solved a painful, specific problem better than existing alternatives. This article is not a motivational fantasy. It is a technical and practical breakdown of how a modest Python tool became a sustainable income stream, and why this approach works far more often than people think.
The Problem That Sparked the Idea
The idea did not come from market research or trend analysis. It came from frustration. I was repeatedly performing the same manual task related to data processing and reporting, involving messy CSV files, inconsistent column naming, and repetitive transformations before analysis. Existing tools were either bloated, expensive, or required configuration overhead that exceeded the task itself. What I needed was speed, predictability, and automation, not a full platform. That gap between “too simple” and “too complex” is where many profitable tools are born. When you feel friction in your own workflow, you are often standing directly on a monetizable idea.
Building the Tool in One Weekend
The first rule I followed was ruthless simplicity. I scoped the project to do one thing exceptionally well. The tool ingested raw CSV or Excel files, applied predefined cleaning rules, validated schema consistency, and output ready-to-use datasets along with a concise quality report. Python was the obvious choice due to its ecosystem, readability, and distribution flexibility. I relied on familiar libraries such as pandas for data manipulation and argparse for a clean command-line interface. There was no UI, no cloud deployment, and no database. The entire tool lived as a local executable script, designed to fit naturally into existing workflows.
Below is a simplified excerpt that captures the spirit of the core logic, not the full implementation.
This kind of code is not impressive on its own, and that is precisely the point. The value was not in clever algorithms, but in removing repeated mental and operational effort from a real process.
Turning the Tool Into a Product
The transition from script to product was mostly about packaging and positioning. I documented the tool clearly, added sensible defaults, error messages that spoke like a human, and a dry-run mode for safety. Then I uploaded it to a small niche marketplace where professionals already paid for productivity tools. I priced it modestly, intentionally low enough to be an impulse purchase, but high enough to signal professional value. There was no freemium tier, only a clear promise: save time immediately or do not buy.
What surprised me was not the first sale, but the lack of support requests afterward. When a tool does one thing well, users understand it instinctively. That clarity reduces friction, refunds, and maintenance costs.
Advertisements
Why People Were Willing to Pay
People do not pay for code. They pay for outcomes. This tool saved users hours every week, reduced errors in downstream analysis, and eliminated a task they actively disliked. For freelancers, analysts, and small teams, time reclaimed translates directly into money earned or stress avoided. Additionally, the tool respected their environment. It did not force cloud uploads, subscriptions, or accounts. It simply worked where they already worked. That respect for the user’s workflow created trust, and trust converts far better than features.
Scaling Without Growing Complexity
As adoption increased, I resisted the temptation to expand features aggressively. Instead, I improved reliability, edge-case handling, and documentation. Minor enhancements were driven exclusively by real user feedback, not assumptions. Income grew not through virality, but through consistency. A small but steady stream of new users, combined with near-zero churn, was enough to reach the point where monthly revenue reliably covered rent. Importantly, maintenance time remained low, preserving the original advantage of the project.
Lessons Learned From the Experience
This project reinforced a counterintuitive truth. You do not need to build big to earn well. You need to build precisely. Tools that sit quietly inside professional workflows can outperform flashy applications if they remove friction at exactly the right point. Python, in this context, is not just a programming language. It is a leverage multiplier, enabling individuals to compete with teams by standing on mature libraries and simple distribution models.
Conclusion
The Python tool I built in a single weekend did not succeed because it was innovative or technically complex. It succeeded because it was honest, focused, and useful. It respected the user’s time, solved a real problem, and stayed out of the way. If you are a developer looking for sustainable income, do not start by asking what is trendy. Start by asking what annoys you enough that you would gladly pay to never deal with it again. Build that. Polish it. Ship it. Sometimes, that is all it takes to change your financial reality.
Advertisements
كيف تحوّل مشروع بايثون بسيط في عطلة نهاية الأسبوع إلى مصدر دخلي الرئيسي
Advertisements
يعتقد معظم المطورين أن الدخل المجزي لا يأتي إلا من الشركات الناشئة الكبيرة أو المنتجات الممولة أو سنوات من التطوير المستمر، لكن تجربتي ناقضت هذا الاعتقاد تماماً، ففي عطلة نهاية أسبوع هادئة وبدافع مشكلة عملية واجهتها شخصياً قمت ببناء أداة بايثون صغيرة بدون خطة عمل ولا استراتيجية تسويق ولا توقعات للربح، وبعد بضعة أسابيع أصبحت هذه الأداة نفسها تغطي جزء كبير من نفقاتي، ليس لأنها معقدة أو ثورية بل لأنها حلت مشكلة محددة ومؤرقة بشكل أفضل من البدائل الموجودة
هذه المقالة ليست مجرد قصة تحفيزية خيالية بل هي تحليل تقني وعملي لكيفية تحول أداة بايثون متواضعة إلى مصدر دخل مستدام ولماذا ينجح هذا النهج في كثير من الأحيان أكثر مما يعتقد الناس
المشكلة التي أدت إلى الفكرة
لم تأتِ الفكرة من أبحاث السوق أو تحليل الاتجاهات بل من الإحباط، كنت أقوم مراراً وتكراراً بنفس المهمة اليدوية المتعلقة بمعالجة البيانات وإعداد التقارير
غير منظمة CSV والتي تتضمن ملفات
وتسميات أعمدة غير متناسقة وتحويلات متكررة قبل التحليل، كانت الأدوات الموجودة إما ضخمة أو باهظة الثمن أو تتطلب تكويناً معقداً يفوق المهمة نفسها، وما كنت أحتاجه هو السرعة والقدرة على التنبؤ والأتمتة وليس منصة متكاملة، هذه الفجوة بين “البسيط جداً” و”المعقد جداً” هي المكان الذي تولد فيه العديد من الأدوات المربحة، فعندما تشعر بالصعوبة في سير عملك فأنت غالباً ما تكون على وشك اكتشاف فكرة قابلة للتسويق
بناء الأداة في عطلة نهاية أسبوع واحدة
كانت القاعدة الأولى التي اتبعتها هي البساطة المطلقة، بحيث صممت المشروع ليقوم بشيء واحد بشكل استثنائي
الأولية CSV أو Excel تقوم الأداة باستقبال ملفات
وتطبيق قواعد تنظيف محددة مسبقاً والتحقق من اتساق المخطط وإخراج مجموعات بيانات جاهزة للاستخدام مع تقرير جودة موجز، فكان بايثون الخيار الأمثل نظراً لبيئته البرمجية وسهولة قراءته ومرونة توزيعه، إذ اعتمدت على مكتبات مألوفة
argparse لمعالجة البيانات و pandas مثل
لواجهة سطر أوامر بسيطة
فلم تكن هناك واجهة مستخدم رسومية ولا نشر سحابي ولا قاعدة بيانات بل كانت الأداة بأكملها عبارة عن برنامج نصي قابل للتنفيذ محلياً مصمم ليتناسب بشكل طبيعي مع سير العمل الحالي
فيما يلي مقتطف مبسط يجسد روح المنطق الأساسي وليس التنفيذ الكامل
هذا النوع من الكود ليس مثيراً للإعجاب بحد ذاته وهذا هو بيت القصيد، لم تكن القيمة في الخوارزميات الذكية بل في إزالة الجهد الذهني والتشغيلي المتكرر من عملية حقيقية، تحويل الأداة إلى منتج
كان الانتقال من مجرد برنامج إلى منتج تجاري يدور في معظمه حول التغليف والتسويق، لقد وثّقتُ الأداة بوضوح وأضفتُ إعدادات افتراضية منطقية ورسائل خطأ بلغة سهلة الفهم ووضعاً للتجربة الآمنة، ثم رفعتها إلى متجر إلكتروني متخصص صغير حيث يدفع المحترفون بالفعل مقابل أدوات الإنتاجية، حددتُ سعراً معقولاً منخفضاً بما يكفي لتكون عملية الشراء تلقائية ولكنه مرتفع بما يكفي للإشارة إلى قيمتها الاحترافية. لم يكن هناك إصدار مجاني بل وعدٌ واضح: وفر وقتك فوراً أو لا تشترِ
ما فاجأني لم يكن البيع الأول بل قلة طلبات الدعم بعد ذلك، فعندما تؤدي الأداة وظيفة واحدة بكفاءة يفهمها المستخدمون بشكل حدسي، هذا الوضوح يقلل من المشاكل وطلبات استرداد الأموال وتكاليف الصيانة
Advertisements
لماذا كان الناس على استعداد للدفع؟
لا يدفع الناس مقابل الكود البرمجي بل يدفعون مقابل النتائج، لقد وفرت هذه الأداة للمستخدمين عدة ساعات كل أسبوع وقللت الأخطاء في التحليلات اللاحقة وألغت مهمة كانوا يكرهونها بشدة، فبالنسبة للمستقلين والمحللين والفرق الصغيرة فإن الوقت المسترجع يُترجم مباشرةً إلى أموال مكتسبة أو تجنب للتوتر، بالإضافة إلى ذلك احترمت الأداة بيئة عملهم فلم تفرض عليهم تحميل الملفات على السحابة أو الاشتراكات أو إنشاء حسابات بل عملت ببساطة في بيئة عملهم الحالية، هذا الاحترام لسير عمل المستخدمين خلق الثقة والثقة تحقق نتائج أفضل بكثير من الميزات
التوسع دون زيادة التعقيد
مع ازدياد عدد المستخدمين قاومتُ إغراء توسيع الميزات بشكل كبير، فبدلاً من ذلك حسّنتُ الموثوقية ومعالجة الحالات الاستثنائية والتوثيق، كانت التحسينات الطفيفة مدفوعة حصرياً بتعليقات المستخدمين الحقيقية وليس بالافتراضات، نما الدخل ليس من خلال الانتشار الواسع بل من خلال الاستمرارية، صحيح أنه كان وارد صغير ولكنه ثابت من المستخدمين الجدد، جنباً إلى جنب مع معدل تراجع شبه معدوم كافياً للوصول إلى النقطة التي يغطي فيها الدخل الشهري الإيجار بشكل موثوق، والأهم من ذلك ظل وقت الصيانة منخفضاً مما حافظ على الميزة الأصلية للمشروع
الدروس المستفادة من التجربة
عزز هذا المشروع حقيقة غير بديهية: لستَ بحاجة إلى بناء مشروع ضخم لتحقيق دخل جيد، بل تحتاج إلى بناء مشروع دقيق، إذ يمكن للأدوات التي تعمل بهدوء ضمن سير العمل الاحترافي أن تتفوق على التطبيقات المبهرة إذا أزالت العقبات في النقطة الصحيحة تماماً، وفي هذا السياق ليست لغة بايثون مجرد لغة برمجة بل هي عامل مضاعفة للقوة تمكّن الأفراد من التنافس مع الفرق بالاعتماد على مكتبات متطورة ونماذج توزيع بسيطة
الخلاصة
لم تنجح أداة بايثون التي بنيتها في عطلة نهاية أسبوع واحدة لأنها كانت مبتكرة أو معقدة تقنياً، بل نجحت لأنها كانت صادقة ومركزة ومفيدة، لقد احترمت وقت المستخدم وحلت مشكلة حقيقية ولم تكن عائقاً، فإذا كنت مطوراً تبحث عن دخل مستدام فلا تبدأ بالسؤال عما هو رائج بل ابدأ بالسؤال عما يزعجك لدرجة أنك ستدفع بسعادة لتجنبه، ابنِ ذلك وحسّنه وأطلقه، فأحياناً هذا كل ما يتطلبه الأمر لتغيير واقعك المالي
I realized something was wrong the moment a private phrasing I only used inside ChatGPT appeared in a Google result preview. It was subtle, almost unbelievable, yet unmistakable. My ChatGPT history was not “leaked” in the dramatic sense, but it had become publicly accessible through a shared link that search engines could index. This is not a hypothetical risk, and it does not require hacking or a data breach. It happens quietly, through default sharing behaviors, cached pages, and a misunderstanding of what “share” actually means in AI tools. What follows is exactly what I did to contain the situation in under ten minutes, explained clearly so you can do the same before it becomes a real problem.
How ChatGPT Conversations Become Public Without You Noticing
ChatGPT does not randomly publish your conversations, but it allows you to generate shareable links. Those links are designed for collaboration, demos, or support, yet once they exist, they behave like any other public URL. If you post one in a public space, send it to someone who reposts it, or even leave it accessible long enough, search engines can crawl it. The danger is not malice; it is inertia. Google indexes what it can reach. If a shared chat link does not explicitly block indexing, it can surface in search results, sometimes with enough context to identify the author, the topic, or sensitive details embedded in the text.
What makes this especially risky is that many users treat AI chats as semi-private notebooks. We brainstorm business ideas, draft contracts, analyze data, and sometimes paste internal content. When those conversations gain a public URL, the boundary between private thinking and public publishing collapses instantly.
The Moment I Confirmed the Problem Was Real
I did not panic; I verified. I copied a unique sentence from the chat and searched it in an incognito browser. The result appeared. Not prominently, but enough to confirm indexing had already begun. This step matters because it tells you whether you are dealing with a theoretical risk or an active exposure. Once confirmed, speed becomes more important than perfection. Search engines move slowly to forget, but they index quickly.
Advertisements
The 10-Minute Fix That Actually Works
The first thing I did was revoke access at the source. Inside ChatGPT, I navigated to my conversation history and identified any chats that had sharing enabled. I disabled sharing immediately. This alone cuts off future access, but it does not erase what search engines already cached.
Next, I deleted the affected conversations entirely. This is uncomfortable if the content matters to you, but deletion ensures the source URL returns nothing. From a search engine’s perspective, a dead page is the strongest signal to drop an index.
Then I moved to Google’s removal workflow. I submitted a request to remove outdated content by pasting the exact URL of the shared chat. This does not require proof of ownership in this case; it relies on the page no longer existing. Within minutes, the status showed as “Pending,” which is enough to stop further spread while Google processes the request.
To prevent recurrence, I audited my account settings. I turned off chat history where appropriate and made a personal rule never to generate share links for conversations containing drafts, credentials, client data, or internal reasoning. Finally, I ran a quick search for my name and common phrases I use, just to ensure no other artifacts were floating around.
All of this took less than ten minutes because the goal was containment, not perfection.
What This Incident Taught Me About AI Privacy
The core lesson is that AI tools behave like publishing platforms the moment a URL exists. The mental model most users have, that chats are ephemeral and private by default, is outdated. If you are a founder, consultant, analyst, or creator, your prompts are intellectual property. Treat them with the same care you would treat a Google Doc or a Notion page. Convenience features are not privacy features, and silence from a tool does not mean safety.
This is especially relevant for professionals who use ChatGPT to refine positioning, pricing, legal language, or strategy. A single indexed conversation can expose thinking that was never meant to leave the room.
Practical Safeguards I Use Going Forward
I now assume every shareable surface can become public. I separate exploratory thinking from sensitive work, avoid pasting raw data unless necessary, and periodically review my chat history the same way I review cloud storage permissions. This mindset shift matters more than any single setting, because tools change faster than policies, and habits are your real defense.
Conclusion
If your ChatGPT history ever appears on Google, it is not the end of the world, but it is a clear signal to act immediately. Disable sharing, delete the source, request removal, and tighten your defaults. Ten focused minutes are enough to stop the spread if you move quickly. The real value of this experience is not the fix itself, but the awareness it creates. AI is powerful, but only if you stay in control of where your thinking lives and who can see it.
If you found this useful, share your experience or questions. The more openly we discuss these edge cases, the safer we all become.
Advertisements
مُفهرسة بواسطة جوجلChatGPTوجدتُ محادثاتي على
الخطوات التي اتخذتها بالتفصيل
Advertisements
أدركتُ وجود خطأ ما لحظة ظهور عبارة خاصة
في معاينة نتائج بحث جوجل ChatGPT استخدمتها فقط داخل
كان الأمر دقيقاً يكاد لا يُصدق ولكنه واضح لا لبس فيه
ChatGPT لم يتم “تسريب” سجل محادثاتي على
بالمعنى الدرامي ولكنه أصبح متاحاً للعامة عبر رابط مُشارك يمكن لمحركات البحث فهرسته، هذا ليس خطراً افتراضياً ولا يتطلب اختراقاً أو تسريباً للبيانات، يحدث ذلك بهدوء من خلال سلوكيات المشاركة الافتراضية والصفحات المخزنة مؤقتاً وسوء فهم لمعنى “المشاركة” في أدوات الذكاء الاصطناعي
فيما يلي شرحٌ مُفصّل لما فعلته لاحتواء الموقف في أقل من عشر دقائق حتى تتمكن من فعل الشيء نفسه قبل أن يُصبح مشكلة حقيقية
عامة دون أن تُلاحظ؟ChatGPTكيف تُصبح محادثات
محادثاتك عشوائياً ChatGPT لا ينشر
ولكنه يسمح لك بإنشاء روابط قابلة للمشاركة، إذ صُممت هذه الروابط للتعاون أو العروض التوضيحية أو الدعم ولكن بمجرد وجودها تُعامل كأي رابط عام آخر، إذا نشرتَ رابطاً في مكان عام أو أرسلته إلى شخص أعاد نشره أو حتى تركته متاحاً لفترة كافية فبإمكان محركات البحث فهرسته، فالخطر ليس في سوء النية بل في التقاعس، جوجل تُفهرس ما يمكنها الوصول إليه، وإذا لم يمنع رابط الدردشة المُشارك الفهرسة صراحةً فقد يظهر في نتائج البحث وأحياناً مع سياق كافٍ لتحديد المُرسل أو الموضوع أو تفاصيل حساسة مُضمنة في النص
ما يزيد الأمر خطورة هو أن العديد من المستخدمين يتعاملون مع محادثات الذكاء الاصطناعي كدفاتر شبه خاصة، فنتبادل الأفكار التجارية ونُصيغ العقود ونُحلل البيانات وأحياناً نلصق محتوى داخلياً، فعندما تُصبح هذه المحادثات متاحة للعامة ينهار الحاجز بين التفكير الخاص والنشر العام فوراً
لحظة تأكدي من وجود المشكلة
لم أُصب بالذعر بل تحققت، نسختُ جملةً فريدة من الدردشة وبحثتُ عنها في متصفح خفي فظهرت النتيجة، لم تكن بارزة لكنها كانت كافية لتأكيد بدء الفهرسة، هذه الخطوة مهمة لأنها تُحدد ما إذا كنت تتعامل مع خطر نظري أم تعرض فعلي، بمجرد التأكد تصبح السرعة أهم من الدقة، فمحركات البحث بطيئة في نسيان المعلومات لكنها تُفهرسها بسرعة
Advertisements
الحل الفعال في 10 دقائق
أول ما فعلته هو إلغاء الوصول من المصدر
انتقلت إلى سجل محادثاتي ChatGPT داخل
وحددت أي محادثات مُفعّل فيها خيار المشاركة عطلت المشاركة فوراً، وهذا الإجراء وحده يمنع الوصول مستقبلاً لكنه لا يمحو ما خزنته محركات البحث مسبقاً
بعد ذلك حذفت المحادثات المتأثرة بالكامل، قد يكون هذا غير مريح إذا كان المحتوى مهماً بالنسبة لك، لكن الحذف يضمن عدم ظهور أي نتائج عند البحث عن رابط المصدر، فمن وجهة نظر محرك البحث تُعد الصفحة المعطلة أقوى مؤشر لحذف فهرس
ثم انتقلت إلى آلية إزالة المحتوى القديم من جوجل: أرسلت طلباً لإزالة المحتوى القديم عن طريق لصق رابط المحادثة المشتركة، إذ لا يتطلب هذا إثبات ملكية في هذه الحالة فهو يعتمد على عدم وجود الصفحة أصلاً، وفي غضون دقائق ظهرت الحالة “قيد الانتظار” وهو ما يكفي لوقف انتشارها ريثما تعالج جوجل الطلب
ولمنع تكرار ذلك راجعتُ إعدادات حسابي وعطّلتُ سجل المحادثات حيثما كان ذلك مناسباً ووضعتُ قاعدة شخصية تمنعني من إنشاء روابط مشاركة للمحادثات التي تحتوي على مسودات أو بيانات اعتماد أو بيانات عملاء أو تبريرات داخلية، أخيراً أجريتُ بحثاً سريعاً عن اسمي والعبارات الشائعة التي أستخدمها للتأكد من عدم وجود أي معلومات أخرى متداولة
كل هذا لم يستغرق أكثر من عشر دقائق لأن الهدف كان احتواء المشكلة لا منعها تماماً
ما تعلمته من هذه الحادثة حول خصوصية الذكاء الاصطناعي
الدرس الأساسي هو أن أدوات الذكاء الاصطناعي تتصرف كمنصات نشر
URL بمجرد وجود رابط
فالنموذج الذهني السائد لدى معظم المستخدمين والذي يعتبر المحادثات مؤقتة وخاصة بشكل افتراضي هو نموذج قديم، إذا كنت مؤسساً أو مستشاراً أو محللاً أو مبدعاً فإن أفكارك تُعدّ ملكية فكرية تعامل معها بنفس الحرص
Notion أو صفحة Google الذي تتعامل به مع مستند
ميزات الراحة ليست ميزات خصوصية وصمت الأداة لا يعني الأمان
ChatGPT هذا الأمر بالغ الأهمية للمحترفين الذين يستخدمون
لتحسين التموضع أو التسعير أو الصياغة القانونية أو الاستراتيجية، فمحادثة واحدة مفهرسة قد تكشف أفكاراً لم يكن من المفترض مشاركتها
إجراءات وقائية عملية أتبعها مستقبلاً
أفترض الآن أن كل مساحة قابلة للمشاركة يمكن أن تصبح عامة *
أفصل بين التفكير الاستكشافي والعمل الحساس *
أتجنب لصق البيانات الخام إلا عند الضرورة *
أراجع سجل محادثاتي دورياً بنفس الطريقة التي أراجع بها أذونات التخزين السحابي *
هذا التحول في التفكير أهم من أي إعداد منفرد لأن الأدوات تتغير أسرع من السياسات والعادات هي دفاعك الحقيقي
الخلاصة
ChatGPT إذا ظهر سجل محادثاتك على
في نتائج بحث جوجل فلا داعي للقلق، فهذه إشارة واضحة لاتخاذ إجراء فوري، عطّل خاصية المشاركة واحذف المصدر واطلب إزالة الملف وحسّن إعداداتك الافتراضية
عشر دقائق من التركيز كافية لوقف انتشار المشكلة إذا تحركت بسرعة، إذ تكمن القيمة الحقيقية لهذه التجربة ليس في الحل بحد ذاته بل في الوعي الذي تُحدثه، وتذكر دائماً أن الذكاء الاصطناعي قوي لكن بشرط أن تتحكم في كيفية مشاركة أفكارك ومن يمكنه الاطلاع عليها
إذا وجدت هذه المعلومات مفيدة شارك تجربتك أو أسئلتك، فكلما ناقشنا هذه الحالات الاستثنائية بصراحة كلما أصبحنا جميعاً أكثر أماناً
When a customer reaches out with a question — “Where’s my order?” or “Can you update my subscription?” — the speed and accuracy of your response can make or break their loyalty. For small businesses, efficient data management isn’t just an operational nice-to-have; it’s the difference between repeat buyers and one-time visitors.
TL;DR
Effective data management enables your team to locate the right information faster, respond to customers more promptly, and reduce errors. Organize, secure, and unify your customer data to boost satisfaction and loyalty — and protect your reputation.
The Customer Chaos Problem
Every small business eventually hits this wall:
Customer details live in five different spreadsheets.
Sales records don’t match inventory.
Email systems and CRM tools don’t talk to each other.
When data gets messy, response times slow down. Customers notice. And once trust erodes, it’s hard to rebuild.
How to Streamline Your Customer Data
Centralize everything — use one hub to connect sales, support, and inventory data.
Automate updates — sync tools like HubSpot or Zoho CRM for real-time records.
Establish access levels — protect sensitive data with user roles.
Set review routines — audit your data monthly for duplicates or errors.
Document workflows — keep a simple record of where each dataset lives.
Data Management in Action
Let’s visualize how smart data handling improves customer service outcomes:
Step
Example
Result
Collect
Integrate customer purchase history
Support team sees order details instantly
Organize
Tag data by customer stage
Personalized responses at every touchpoint
Secure
Encrypt stored info
Builds customer trust
Analyze
Spot repeat issues
Prevents future complaints
Share
Team dashboards
Collaboration without chaos
Strong Foundations with Data Governance
Behind every efficient service operation lies responsible data governance — the discipline that keeps information accurate, protected, and organized. When businesses embed governance into daily systems and workflows, data becomes a growth engine. Without it, small companies risk security gaps, compliance missteps, and unnecessary inefficiencies that frustrate customers and staff alike.
Advertisements
FAQs
Q1: Isn’t this just for large enterprises? No — small businesses benefit even more because they rely on agility. Good data practices let you compete with bigger players.
Q2: What tools are affordable for small teams? Look atTrello,Airtable, orClickUp for simple, scalable management.
Q3: How often should I back up my customer data? Weekly at minimum, daily for businesses with frequent transactions.
Q4: What’s the first step if my data is a mess? Start by cleaning one dataset — your customer list. Merge duplicates and fill in missing fields.
Pro Tip: Spotlight — Microsoft Power BI
If you’re tracking customer trends,Microsoft Power BI can turn raw sales or feedback data into clear visuals that reveal hidden service patterns. A few hours of setup can pay off in months of insight.
Simple Checklist: Is Your Data Helping or Hurting?
☐ Can you find any customer’s info in under a minute? ☐ Is your data stored securely and backed up regularly? ☐ Do your systems sync automatically across departments? ☐ Are you tracking customer feedback trends? ☐ Have you trained your staff on privacy best practices?
If you can’t check all five, your data might be slowing you down.
Glossary
CRM (Customer Relationship Management): Software that stores and tracks customer interactions.
Data Governance: Policies ensuring data is accurate, secure, and properly used.
Centralization: Combining data from different tools into one location.
Encryption: A method of protecting data by converting it into unreadable code.
Workflow: The series of tasks that complete a process or service cycle.
Bonus: Resource Roundup for Small Businesses
Google Workspace — unified tools for communication and file management.
Tableau — data visualization for customer insights.
Conclusion
Efficient data management doesn’t just save time — it builds relationships. For small businesses, that means every second counts. Organize your data, protect it, and let your team work faster and smarter. Customers will feel it — and they’ll keep coming back.
Advertisements
عملاؤك يشـــعرون بالفوضى التي تُحدثها
لماذا إدارة البيانات بشكل صحيح تغير كل شيء
Advertisements
عندما يتواصل معك عميل بسؤال : “أين طلبي؟” أو “هل يمكنك تحديث اشتراكي؟” فإن سرعة ودقة ردك قد تُعزز ولاءه أو تُضعفه، فبالنسبة للشركات الصغيرة لا تُعدّ إدارة البيانات الفعّالة مجرد ميزة تشغيلية بل هي الفرق بين المشترين المتكررين والزوار لمرة واحدة
تُمكّن إدارة البيانات الفعّالة فريقك من تحديد المعلومات الصحيحة بشكل أسرع والرد على العملاء بسرعة أكبر وتقليل الأخطاء، لذا نظّم بيانات عملائك وأمنها ووحّدها لتعزيز رضاهم وولائهم وحماية سمعتك
مشكلة فوضى العملاء
: تواجه كل شركة صغيرة في نهاية المطاف هذه المشكلة
بيانات العملاء موجودة في خمسة جداول بيانات مختلفة ●
سجلات المبيعات لا تتطابق مع المخزون ●
أنظمة البريد الإلكتروني وأدوات إدارة علاقات العملاء لا تتواصل ●
عندما تتداخل البيانات تتباطأ أوقات الاستجابة، يلاحظ العملاء ذلك وبمجرد تآكل الثقة يصعب إعادة بنائها
كيفية تبسيط بيانات عملائك
مركزية كل شيء – استخدم مركزاً واحداً لربط بيانات المبيعات والدعم والمخزون ●
HubSpot أو Zoho CRM أتمتة التحديثات – مزامنة أدوات مثل ●
للحصول على سجلات فورية
تحديد مستويات الوصول – حماية البيانات الحساسة بأدوار المستخدمين●
ضبط إجراءات المراجعة – تدقيق بياناتك شهرياً بحثاً عن أي تكرارات أو أخطاء●
توثيق سير العمل – احتفظ بسجل بسيط لمكان كل مجموعة بيانات●
إدارة البيانات عملياً
:لنتخيل كيف يُحسّن التعامل الذكي مع البيانات نتائج خدمة العملاء
النتيجة
مثال
الخطوة
يطّلع فريق الدعم على تفاصيل الطلب فورًا
دمج سجل مشتريات العميل
الجمع
ردود مُخصصة في كل نقطة اتصال
تصنيف البيانات حسب مرحلة العميل
التنظيم
بناء ثقة العملاء
تشفير المعلومات المُخزنة
التأمين
منع الشكاوى المُستقبلية
اكتشاف المشاكل المُتكررة
التحليل
التعاون دون فوضى
لوحات معلومات الفريق
مشاركة
أسس متينة مع حوكمة البيانات
تقع وراء كل عملية خدمة فعّالة حوكمة بيانات مسؤولة – وهي الانضباط الذي يُحافظ على دقة المعلومات وحمايتها وتنظيمها، فعندما تُدمج الشركات الحوكمة في أنظمتها اليومية وسير عملها تُصبح البيانات محركاً للنمو، وبدونها تُواجه الشركات الصغيرة خطر الثغرات الأمنية وأخطاء الامتثال وعدم الكفاءة غير الضرورية التي تُحبط العملاء والموظفين على حدٍ سواء
Advertisements
الأسئلة الشائعة
س1: أليس هذا مُخصصاً للشركات الكبيرة فقط؟
لا .. تستفيد الشركات الصغيرة أكثر لأنها تعتمد على المرونة، ممارسات البيانات الجيدة تُمكّنك من المنافسة مع الشركات الأكبر
إدارة البيانات الفعّالة لا توفر الوقت فحسب بل تبني العلاقات أيضاً، فبالنسبة للشركات الصغيرة هذا يعني أن كل ثانية مهمة، لذا نظّم بياناتك واحمِها ودع فريقك يعمل بشكل أسرع وأذكى، سيشعر العملاء بذلك وسيستمرون في العودة إليك
In the modern data-driven landscape, the true challenge facing data scientists is no longer how to store, process, or model information—technology already achieves that at scale. The real challenge is understanding the human forces behind the data. Data itself, no matter how large or beautifully structured, is silent until someone interprets the incentives, decisions, and constraints that shape it. This is exactly where the economist’s mindset becomes indispensable. Economists spend their careers studying why people behave the way they do, how choices are shaped under scarcity, how incentives influence actions, and how systems evolve over time. When a data scientist adopts this mode of thinking, analysis becomes more than prediction; it becomes insight. And insight is what drives strategic, meaningful decisions in the real world.
Understanding Human Behavior Beyond Patterns
Data science often revolves around identifying patterns—detecting churn, forecasting demand, predicting risk. But patterns alone cannot explain the deeper question: Why do people behave this way in the first place? Economists approach behavior through the lens of preferences, constraints, motivations, and expectations. They understand that every individual acts under a unique combination of incentives and limitations. When a data scientist incorporates this style of thinking, the data stops looking like static snapshots and begins to resemble a living story about human behavior. Instead of treating anomalies as numerical errors, the data scientist begins to explore the psychological and economic factors that might produce such deviations. This transforms the analysis into something more sophisticated, more realistic, and far more useful.
A Shift from Correlation to Causation
One of the most critical contributions of economics to data science is the relentless pursuit of causality. While machine learning models can uncover powerful correlations, economists dig deeper to identify what actually drives outcomes. This mindset protects data scientists from misinterpreting relationships that appear significant in the data but hold little meaning in reality. When economic reasoning guides an analysis, the data scientist becomes more critical, more skeptical, and more aware of potential confounders. Instead of taking patterns at face value, they explore the mechanisms that produce those patterns. This often leads to solutions that are more stable, more strategic, and more aligned with how people and systems truly operate.
Trade-Offs and the Discipline of Decision-Making
Economists think in trade-offs because every meaningful decision—whether made by a company or a customer—involves sacrificing one benefit to gain another. Data scientists who internalize this idea approach their work with greater strategic clarity. They stop chasing “perfect” accuracy and start understanding the cost of every improvement. A model that is slightly more accurate but significantly more expensive or harder to maintain may not be worth it. A prediction that requires invasive data collection may reduce user trust. A product change that improves engagement may create hidden frictions elsewhere. This trade-off mentality introduces a level of maturity that purely technical thinking often overlooks. It aligns the data scientist’s work with real-world decision-making, where constraints are ever-present and resources are never infinite.
Advertisements
Seeing Interconnected Systems Rather Than Isolated Numbers
Economics teaches that individuals, markets, and institutions are interconnected systems, not isolated units. Data scientists who adopt this worldview begin analyzing problems within broader contexts. They recognize how a change in one part of a system creates ripple effects in others. This systems-level thinking is invaluable when working on marketplace platforms, recommendation systems, pricing engines, supply chain forecasting, and any domain where multiple agents interact dynamically. Instead of building static models that assume the world remains unchanged, the economist-minded data scientist anticipates how people and systems will adapt. This ability to foresee second-order effects dramatically strengthens the relevance and longevity of analytical solutions.
Building Models That Reflect Real Human Behavior
Machine learning often imposes mathematical convenience on problems that are fundamentally human. Economic reasoning helps restore balance by grounding models in real behavioral principles: people maximize utility, respond to incentives, suffer from biases, act under uncertainty, and adapt to changing environments. By incorporating economic concepts—utility theory, behavioral economics, information asymmetry, game theory—data scientists build models that behave more reliably in real markets and real decisions. The result is not only more accurate predictions but also more interpretable and defensible models. They better capture how customers evaluate options, how employees react to policy changes, and how users respond to pricing or recommendations. In short, models become more realistic because they reflect the complexity of human nature rather than the simplicity of mathematical assumptions.
Communicating Insights with Clarity and Strategic Impact
Economists excel at distilling complex realities into clear, actionable insights. Their communication style emphasizes the “why” behind behaviors, the “because” behind decisions, and the “what if” behind each strategic scenario. When data scientists adopt this communication style, their influence multiplies. Instead of presenting outputs and metrics, they articulate stories about behavior, incentives, and strategic outcomes. Leaders respond not to predictions alone, but to interpretations that reveal risks, opportunities, and trade-offs. The data scientist who communicates with economic clarity becomes a strategist, not just a technician—someone whose insights shape policy, guide product development, and influence high-level decisions.
Embracing Uncertainty as a Natural Part of Decision-Making
Economics is built on the reality that uncertainty can never be eliminated, only understood and managed. Markets shift, people change, shocks occur, and expectations evolve. When data scientists adopt an economic approach to uncertainty, they stop fearing it and start analyzing it. They use concepts like expected utility, rational expectations, marginal decision-making, and risk tolerance to frame uncertainty in a structured, understandable way. This leads to more resilient models, more thoughtful forecasts, and a healthier relationship between confidence and doubt. The result is analytical work that does not pretend to be perfect but is intentionally designed to hold up under the unpredictability of real-world environments.
Conclusion
To think like an economist is to elevate data science into a discipline that understands the invisible forces driving human decisions. It adds depth, clarity, and realism to the technical power of models and algorithms. When data scientists learn to interpret incentives, anticipate trade-offs, appreciate systemic interactions, and communicate uncertainty with confidence, they move far beyond the limits of traditional analytics. They become advisors, strategists, and decision-shapers. In a world overflowing with data but starved for meaning, the data scientist who embraces economic thinking becomes uniquely equipped to make sense of complexity. They do more than predict the future—they understand the pressures that create it.
Advertisements
لماذا تتغير مسيرتك المهنية في علم البيانات بمجرد أن تفكر كخبير اقتصادي؟
Advertisements
في ظلّ البيئة الحديثة القائمة على البيانات لم يعد التحدي الحقيقي الذي يواجه علماء البيانات يكمن في كيفية تخزين المعلومات أو معالجتها أو نمذجتها – فالتكنولوجيا تُحقّق ذلك بالفعل على نطاق واسع، بل يكمن التحدي الحقيقي في فهم القوى البشرية الكامنة وراء البيانات، فالبيانات نفسها مهما ضخّمت أو بُنيت بشكل جميل تبقى صامتة حتى يُفسّر أحدٌ الحوافز والقرارات والقيود التي تُشكّلها، وهنا تحديداً تُصبح عقلية الاقتصادي لا غنى عنها
يقضي الاقتصاديون حياتهم المهنية في دراسة أسباب تصرفات الناس على هذا النحو وكيف تتشكّل الخيارات في ظلّ الندرة وكيف تُؤثّر الحوافز على الأفعال وكيف تتطور الأنظمة مع مرور الوقت، فعندما يتبنّى عالم البيانات هذا الأسلوب في التفكير يصبح التحليل أكثر من مجرّد تنبؤ بل يصبح بصيرة، والبصيرة هي ما يُحرّك القرارات الاستراتيجية والهادفة في العالم الحقيقي
فهم السـلوك البشري بما يتجاوز الأنماط
غالباً ما يتمحور علم البيانات حول تحديد الأنماط كالكشف عن فقدان العملاء والتنبؤ بالطلب والتنبؤ بالمخاطر، لكن الأنماط وحدها لا تُفسّر السؤال الأعمق: لماذا يتصرف الناس بهذه الطريقة في المقام الأول؟ يتناول الاقتصاديون السلوك من منظور التفضيلات والقيود والدوافع والتوقعات، فهم يدركون أن كل فرد يتصرف في ظل مزيج فريد من الحوافز والقيود، فعندما يدمج عالم البيانات هذا الأسلوب في التفكير تتوقف البيانات عن كونها لقطات ثابتة وتبدأ في أن تكون بمثابة قصة حية عن السلوك البشري، وبدلاً من التعامل مع الشذوذ كأخطاء عددية يبدأ عالم البيانات في استكشاف العوامل النفسية والاقتصادية التي قد تُسبب مثل هذه الانحرافات، وهذا بدوره يُحوّل التحليل إلى شيء أكثر تعقيداً وواقعية وفائدة
التحول من الارتباط إلى السببية
من أهم مساهمات الاقتصاد في علم البيانات السعي الدؤوب وراء السببية، فبينما يمكن لنماذج التعلم الآلي الكشف عن ارتباطات قوية يتعمق الاقتصاديون في البحث لتحديد العوامل المؤثرة فعلياً في النتائج، وعليه تحمي هذه العقلية علماء البيانات من سوء تفسير العلاقات التي تبدو مهمة في البيانات ولكنها لا تحمل معنى حقيقياً، فعندما يُوجّه المنطق الاقتصادي التحليل يصبح عالم البيانات أكثر انتقاداً وتشككاً ووعياً بالعوامل المُربكة المحتملة، وبدلاً من أخذ الأنماط على ظاهرها يستكشفون الآليات التي تُنتجها، إذ غالباً ما يؤدي هذا إلى حلول أكثر استقراراً واستراتيجيةً وتوافقاً مع كيفية عمل الأفراد والأنظمة
المقايضات وانضباط صنع القرار
يفكر الاقتصاديون في المقايضات لأن كل قرار ذي معنى – سواء اتخذته شركة أو عميل – ينطوي على التضحية بفائدة من أجل الحصول على أخرى، فعلماء البيانات الذين يستوعبون هذه الفكرة يتعاملون مع عملهم بوضوح استراتيجي أكبر، ويتوقفون عن السعي وراء الدقة “المثالية” ويبدأون بفهم تكلفة كل تحسين، وقد لا يكون النموذج الأكثر دقة بقليل ولكنه أكثر تكلفة أو صعوبة في الصيانة ذا قيمة، وقد يُقلل التنبؤ الذي يتطلب جمع بيانات مُتطفلة من ثقة المستخدم
قد يُؤدي تغيير المنتج الذي يُحسّن التفاعل إلى احتكاكات خفية في مجالات أخرى تُدخل عقلية المقايضات هذه مستوى من النضج غالباً ما يغفله التفكير التقني البحت، إنها تُوائِم عمل عالم البيانات مع صنع القرار في العالم الواقعي حيث تكون القيود حاضرة دائماً والموارد لا حدود لها
رؤية أنظمة مترابطة بدلاً من أرقام معزولة
يُعلّمنا علم الاقتصاد أن الأفراد والأسواق والمؤسسات أنظمة مترابطة وليست وحدات معزولة، إذ يبدأ علماء البيانات الذين يتبنون هذه النظرة العالمية بتحليل المشكلات ضمن سياقات أوسع، فهم يدركون كيف يُحدث تغيير في أحد أجزاء النظام تأثيرات متتالية في أجزاء أخرى
يُعدّ هذا التفكير على مستوى النظم بالغ الأهمية عند العمل على منصات السوق وأنظمة التوصية ومحركات التسعير وتنبؤات سلاسل التوريد وأي مجال تتفاعل فيه جهات متعددة بشكل ديناميكي، فبدلاً من بناء نماذج ثابتة تفترض ثبات العالم يتوقع عالم البيانات ذو العقلية الاقتصادية كيفية تكيف الأفراد والأنظمة، وعليه تُعزز هذه القدرة على توقع التأثيرات الثانوية بشكل كبير أهمية الحلول التحليلية وديمومة عملها
Advertisements
بناء نماذج تعكس السلوك البشري الحقيقي
غالباً ما يُطبّق التعلم الآلي أساليب رياضية مُيسّرة على المشكلات البشرية في جوهرها، إذ يُساعد التفكير الاقتصادي على استعادة التوازن من خلال ترسيخ النماذج في مبادئ سلوكية واقعية: يُحقق الأفراد أقصى استفادة ويستجيبون للحوافز ويُعانون من التحيزات ويتصرفون في ظل عدم اليقين ويتكيفون مع البيئات المتغيرة
من خلال دمج المفاهيم الاقتصادية – نظرية المنفعة والاقتصاد السلوكي وعدم تماثل المعلومات ونظرية الألعاب – يبني علماء البيانات نماذج تعمل بكفاءة أكبر في الأسواق الحقيقية والقرارات الفعلية، والنتيجة ليست تنبؤات أكثر دقة فحسب بل نماذج أكثر قابلية للتفسير والدفاع، فهي تلتقط بشكل أفضل كيفية تقييم العملاء للخيارات وكيفية تفاعل الموظفين مع تغييرات السياسات وكيفية استجابة المستخدمين للتسعير أو التوصيات، باختصار تصبح النماذج أكثر واقعية لأنها تعكس تعقيد الطبيعة البشرية بدلاً من بساطة الافتراضات الرياضية
توصيل الأفكار بوضوح وتأثير استراتيجي
يتميز الاقتصاديون في تلخيص الحقائق المعقدة إلى رؤى واضحة وقابلة للتنفيذ، إذ يركز أسلوب تواصلهم على “السبب” وراء السلوكيات و”السبب” وراء القرارات و”ماذا لو” وراء كل سيناريو استراتيجي، فعندما يعتمد علماء البيانات هذا الأسلوب في التواصل يتضاعف تأثيرهم، وبدلاً من عرض النتائج والمقاييس فإنهم يعبّرون عن قصص حول السلوك والحوافز والنتائج الاستراتيجية
لا يستجيب القادة للتنبؤات فحسب بل للتفسيرات التي تكشف عن المخاطر والفرص والتنازلات، إذ أن عالِم البيانات الذي يتواصل بوضوح اقتصادي يصبح استراتيجياً وليس مجرد فني – شخصاً تُشكل رؤيته السياسات وتُوجه تطوير المنتجات وتؤثر على القرارات رفيعة المستوى
احتضان عدم اليقين كجزء طبيعي من عملية صنع القرار
يُبنى علم الاقتصاد على حقيقة أن عدم اليقين لا يمكن القضاء عليه، بل يمكن فهمه وإدارته فقط، إذ تتغير الأسواق ويتغير الناس وتحدث الصدمات وتتطور التوقعات، فعندما يتبنى علماء البيانات نهجاً اقتصادياً للتعامل مع عدم اليقين فإنهم يتوقفون عن الخوف منه ويبدأون بتحليله، فيستخدمون مفاهيم مثل المنفعة المتوقعة والتوقعات العقلانية واتخاذ القرارات الهامشية وتحمل المخاطر لتأطير عدم اليقين بطريقة منظمة ومفهومة
يؤدي هذا إلى نماذج أكثر مرونة وتوقعات أكثر تعمقاً وعلاقة أصح بين الثقة والشك، والنتيجة هي عمل تحليلي لا يتظاهر بالكمال ولكنه مصمم عمداً للصمود في وجه عدم القدرة على التنبؤ ببيئات العالم الحقيقي
الخلاصة
إن التفكير كخبير اقتصادي يعني الارتقاء بعلم البيانات إلى تخصص يفهم القوى الخفية التي تُحرك القرارات البشرية، إذ يُضيف هذا عمقاً ووضوحاً وواقعيةً إلى القوة التقنية للنماذج والخوارزميات، وعندما يتعلم علماء البيانات تفسير الحوافز وتوقع المفاضلات وتقدير التفاعلات النظامية والتواصل مع حالات عدم اليقين بثقة فإنهم يتجاوزون حدود التحليلات التقليدية بكثير، فيصبحون مستشارين واستراتيجيين وصانعي قرارات
في عالمٍ يفيض بالبيانات ولكنه يفتقر إلى المعنى يُصبح عالم البيانات الذي يتبنى التفكير الاقتصادي مؤهلاً بشكل فريد لفهم التعقيد، إنهم لا يكتفون بالتنبؤ بالمستقبل بل يفهمون الضغوط التي تُولّده
YouTube’s 2025 AI policy arrived like a sudden earthquake shaking creators across every niche from education to gaming to faceless channels. Many creators feared demonetization content removal or a complete reset for their channels. Yet the truth is more strategic and far more exciting. The updates are strict but they also open an entirely new era where creativity transparency and storytelling matter more than ever. If you understand how the new rules work and adapt early your channel can grow faster than channels that ignore or resist these changes.
This article walks you through every major YouTube AI rule for 2025 in a narrative practical way and gives you a step by step roadmap to not only survive but grow stronger in this new environment.
YouTube’s 2025 AI Policy What Actually Changed
1. Mandatory Disclosure for AI Content
YouTube now requires creators to clearly label:
AI generated voices
AI generated humans or faces
AI generated environments
Deepfakes
Scripted content fully produced with AI
Any reconstructed or “synthetic” scenes
This is no longer optional. If you avoid disclosure YouTube may:
Reduce reach
Remove your video
Give channel warnings
Disable monetization
However disclosure does not harm your reach if you do it correctly. In fact transparency boosts trust and that leads to more watch time.
2. Stricter Rules on Human Representation
YouTube now protects real individuals from being impersonated. You cannot:
Use AI to recreate a celebrity voice without labeling
Create fake statements through synthetic actors
Make AI avatars that look like real people without permission
Creators using avatars must now clarify whether the character is:
AI generated
A fictional representation
A digital character voiced by the creator
This rule protects viewers but also pushes creators toward stronger storytelling and clearer branding.
3. New Copyright Expectations
AI generated content must still respect copyrights. For example you cannot:
Train a model on copyrighted songs and reuse outputs
Recreate a movie soundtrack with AI
Generate landscapes or scenes based on protected films
YouTube’s new detector can now spot these patterns even if the video is entirely AI created. The platform will automatically restrict monetization when the risk is high.
How Smart Creators Can Win Under the 2025 Rules
The creators who grow fastest in 2025 will be those who do not fight the new guidelines but instead build content strategies around them. Here is how.
1. Use AI for Brainstorming Not Final Output
Creators who rely on fully AI generated videos will struggle with identity viewer loyalty and monetization consistency. Instead use AI tools for:
Script ideas
Content outlines
Video structures
Research summaries
Visual concepts
But add your own voice camera presence or commentary on top. Even faceless channels can do this by keeping a human layer such as:
Personal narration
Real world examples
Your own storytelling
Your own editing style
This hybrid model will dominate in 2025.
2. Build Your Signature Voice or Format
YouTube is now rewarding originality more than production value. Your competitive advantage is not AI visual quality but your unique:
Tone
Style
Pacing
Humor
Insight
Storytelling pattern
Even faceless creators can have a recognizable personality through writing and voice delivery.
Advertisements
3. Use AI Tools to Speed Up Production Without Triggering the Policy
Here is what is still completely safe:
AI editing assistants
AI thumbnail enhancement
AI noise removal
AI translation
AI captioning
AI B-roll for nonhuman scenes
AI color grading
None of these require disclosure because they modify your original work instead of replacing it.
This is where creators will explode in productivity in 2025.
4. Be Very Clear with Disclosure Without Ruining the Viewer Experience
The biggest fear creators have is that disclosure will make their content feel cheap. Here is a simple formula to avoid that:
Place the AI disclosure at the very end of the description or in a small line at the start of the video.
Examples:
“Some visual elements in this video were created using AI tools.”
“Voice assistance provided by AI narration software.”
“Portions of this scene contain AI generated environments.”
Short clean and professional.
5. Lean Into Formats YouTube Loves in 2025
YouTube’s algorithm in 2025 is pushing:
Tutorials
Mini documentaries
Short storytelling videos
Explainer style videos
Personal commentary
Reaction and analysis
Gaming with deep narrative
Real world skill-based content
Creators who mix human insight with AI efficiency will dominate these niches.
A Real Life Example: How I Started Generating Deep Features Automatically
At the beginning of 2025 I was experimenting with creating dozens of short educational videos every week. Manually scripting each one was painful and slow. So I built a personal workflow that uses AI tools to generate deep structured features for each topic automatically. These features included narrative flow key talking points supporting metaphors contextual examples and alternative phrasings.
Instead of giving me a finished script the model gave me a rich multi layer map. From that map I could quickly build a human sounding professional script with my own style. This approach made my videos more detailed and more coherent while still remaining authentic and fully compliant with YouTube’s policy. AI became my assistant not my replacement.
Conclusion
2025 is not the year AI content dies on YouTube. It is the year lazy AI content dies and meaningful creator led content wins. If you embrace transparency originality and hybrid creation your channel will grow faster than ever before. The creators who succeed in this new era are not the ones who fight the rules. They are the ones who evolve before everyone else does.
Advertisements
2025 في عامYouTube النمو السريع على
بالرغم من سياسة الذكاء الاصطناعي الجديدة
Advertisements
جاءت سياسة الذكاء الاصطناعي لعام 2025 على يوتيوب بمثابة زلزال مفاجئ هزّ صنّاع المحتوى في جميع المجالات من التعليم إلى الألعاب إلى القنوات غير المرئية، خشي العديد من صنّاع المحتوى إزالة المحتوى المُدر للربح أو إعادة ضبط قنواتهم بالكامل، لكن الحقيقة أكثر استراتيجيةً وإثارةً، فصحيحٌ أن التحديثات صارمة لكنها تفتح أيضاً عصراً جديداً كلياً، حيثُ أصبحت الشفافية والإبداع وسرد القصص أكثر أهميةً من أي وقت مضى، فإذا فهمتَ آلية عمل القواعد الجديدة وتكيّفتَ معها مبكراً فستنمو قناتك أسرع من القنوات التي تتجاهل هذه التغييرات أو تقاومها
يُقدّم لك هذا المقال شرحاً عملياً وسردياً لجميع قواعد الذكاء الاصطناعي الرئيسية على يوتيوب لعام 2025 ويمنحك خارطة طريق خطوة بخطوة ليس فقط للبقاء بل للنمو بقوة أكبر في هذه البيئة الجديدة
سياسة يوتيوب للذكاء الاصطناعي لعام ٢٠٢٥: ما الذي تغير فعلياً؟
١. الإفصاح الإلزامي عن محتوى الذكاء الاصطناعي
:يُلزم يوتيوب الآن منشئي المحتوى بوضع علامات واضحة على
الأصوات المُولّدة بالذكاء الاصطناعي •
الأشخاص أو الوجوه المُولّدة بالذكاء الاصطناعي •
البيئات المُولّدة بالذكاء الاصطناعي •
التزييف العميق •
المحتوى المُبرمج والمُنتج بالكامل باستخدام الذكاء الاصطناعي •
أي مشاهد مُعاد بناؤها أو “مُصطنعة” •
:لم يعد هذا الأمر اختيارياً، ففي حال تجنّبك الإفصاح قد يقوم يوتيوب بما يلي
تقليل الوصول •
إزالة الفيديو •
إصدار تحذيرات للقناة •
تعطيل تحقيق الدخل •
ومع ذلك لا يُؤثّر الإفصاح سلباً على وصولك إذا تم ذلك بشكل صحيح، ففي الواقع تُعزّز الشفافية الثقة مما يؤدي إلى زيادة وقت المشاهدة
٢. قواعد أكثر صرامة بشأن تمثيل الأشخاص
: يحمي يوتيوب الآن الأشخاص الحقيقيين من انتحال هوياتهم، إذ يمنعك من القيام بالإجراءت التالية
استخدام الذكاء الاصطناعي لإعادة إنتاج صوت أحد المشاهير دون تصنيف •
إنشاء عبارات مزيفة باستخدام ممثلين اصطناعيين •
إنشاء صور رمزية للذكاء الاصطناعي تشبه أشخاصاً حقيقيين دون إذن •
: يجب على منشئي المحتوى الذين يستخدمون الصور الرمزية توضيح ما إذا كانت الشخصية
مُولّدة من الذكاء الاصطناعي •
تمثيل خيالي •
شخصية رقمية بصوت منشئ المحتوى •
تحمي هذه القاعدة المشاهدين ولكنها تدفع أيضاً منشئي المحتوى نحو سرد قصص أقوى وعلامة تجارية أوضح3
3. توقعات جديدة لحقوق الطبع والنشر
يجب أن يحترم المحتوى المُولّد بالذكاء الاصطناعي حقوق الطبع والنشر
: على سبيل المثال لا يمكنك القيام بالإجراءات التالية
تدريب نموذج على الأغاني المحمية بحقوق الطبع والنشر وإعادة استخدام المخرجات •
إعادة إنتاج موسيقى تصويرية لفيلم باستخدام الذكاء الاصطناعي •
إنشاء مناظر طبيعية أو مشاهد مستوحاة من أفلام محمية •
يمكن لأداة الكشف الجديدة في يوتيوب الآن اكتشاف هذه الأنماط حتى لو كان الفيديو مُولّداً بالكامل بالذكاء الاصطناعي ستُقيّد المنصة تلقائياً تحقيق الدخل عندما يكون الخطر مرتفعاً
كيف يُمكن للمبدعين الأذكياء النجاح في ظل قواعد 2025
سيكون منشئو المحتوى الأسرع نمواً في عام 2025 هم أولئك الذين لا يعارضون الإرشادات الجديدة بل يبنون استراتيجيات محتوى حولها
: إليك الطريقة
١. استخدم الذكاء الاصطناعي للعصف الذهني وليس للإخراج النهائي
سيواجه منشئو المحتوى الذين يعتمدون على مقاطع فيديو مُولّدة بالكامل بالذكاء الاصطناعي صعوبة في تحديد هوية المشاهدين وولاءهم وثبات معدل الربح، استخدم أدوات الذكاء الاصطناعي بدلاً من ذلك لما يلي
أفكار النصوص •
مخططات المحتوى •
هياكل الفيديو •
ملخصات الأبحاث •
المفاهيم البصرية •
ولكن أضف صوتك الخاص سواءً من خلال الكاميرا أو التعليق الصوتي، حتى القنوات التي لا تظهر فيها أي شخصية يمكنها تحقيق ذلك من خلال الحفاظ على طابع إنساني مثل
سرد شخصي •
أمثلة من الواقع •
سرد قصصك الخاص •
أسلوبك الخاص في التحرير •
سيهيمن هذا النموذج الهجين في عام ٢٠٢٥
٢. طوّر أسلوبك أو تنسيقك الخاص
يُقدّر يوتيوب الآن الأصالة أكثر من قيمة الإنتاج
: لا تكمن ميزتك التنافسية في جودة الصورة التي يدعمها الذكاء الاصطناعي، بل في ما تتميز به من
أسلوب •
وتيرة •
حس فكاهة •
رؤية •
نمط سرد القصص •
حتى منشئو المحتوى الذين لا تظهر فيهم شخصيات مميزة، يمكنهم امتلاك شخصية مميزة من خلال الكتابة والأداء الصوتي
Advertisements
٣. استخدم أدوات الذكاء الاصطناعي لتسريع الإنتاج دون التأثير على السياسة
: إليك ما لا يزال آمناً تماماً
مساعدو التحرير بالذكاء الاصطناعي •
تحسين الصور المصغرة بالذكاء الاصطناعي •
إزالة الضوضاء بالذكاء الاصطناعي •
الترجمة بالذكاء الاصطناعي •
التسميات التوضيحية بالذكاء الاصطناعي •
بالذكاء الاصطناعي للمشاهد غير البشرية B-roll لقطات •
تصحيح الألوان بالذكاء الاصطناعي •
لا يتطلب أيٌّ من هذه الأدوات الإفصاح، لأنها تُعدّل عملك الأصلي بدلاً من استبداله
هنا سيشهد منشئو المحتوى زيادةً هائلةً في الإنتاجية في عام ٢٠٢٥
٤. كن واضحاً جداً في الإفصاح دون إفساد تجربة المشاهد
أكبر مخاوف منشئي المحتوى هو أن يُشعرهم الإفصاح برخص محتواهم
: إليك طريقة بسيطة لتجنب ذلك
ضع الإفصاح بالذكاء الاصطناعي في نهاية الوصف أو في سطر صغير في بداية الفيديو
: أمثلة
“تم إنشاء بعض العناصر المرئية في هذا الفيديو باستخدام أدوات الذكاء الاصطناعي” •
“المساعدة الصوتية مُقدمة بواسطة برنامج سرد بالذكاء الاصطناعي” •
“تحتوي أجزاء من هذا المشهد على بيئات مُولّدة بالذكاء الاصطناعي” •
فيديو قصير وواضح واحترافي
٥. اعتمد على الصيغ التي يعشقها يوتيوب في عام ٢٠٢٥
: تشهد خوارزمية يوتيوب في عام ٢٠٢٥ تطوراً ملحوظاً في
البرامج التعليمية •
الأفلام الوثائقية القصيرة •
فيديوهات سرد قصص قصيرة •
فيديوهات توضيحية •
التعليقات الشخصية •
ردود الفعل والتحليل •
الألعاب ذات السرد العميق •
محتوى قائم على مهارات واقعية •
سيسيطر على هذه المجالات المبدعون الذين يمزجون بين البصيرة البشرية وكفاءة الذكاء الاصطناعي
مثال من الحياة الواقعية: كيف بدأتُ بإنشاء ميزات عميقة تلقائياً
في بداية عام ٢٠٢٥ كنتُ أجرب إنشاء عشرات الفيديوهات التعليمية القصيرة أسبوعياً، وكانت كتابة كل فيديو يدوياً أمراً شاقاً وبطيئاً، لذلك أنشأتُ سير عمل شخصياً يستخدم أدوات الذكاء الاصطناعي لإنشاء ميزات منظمة عميقة لكل موضوع تلقائياً، تضمنت هذه الميزات تدفقاً سردياً ونقاط نقاش رئيسية واستعارات داعمة وأمثلة سياقية وعبارات بديلة
بدلاً من إعطائي نصاً جاهزاً منحني النموذج خريطة غنية متعددة الطبقات، فمن خلال هذه الخريطة استطعتُ بسرعة إنشاء نص احترافي بأسلوبي الخاص ليبدو بشرياً، هذا النهج جعل فيديوهاتي أكثر تفصيلاً وتماسكاً مع الحفاظ على أصالتها وامتثالها التام لسياسة يوتيوب أصبح الذكاء الاصطناعي مساعدي لا بديلاً لي
الخلاصة
عام ٢٠٢٥ ليس عام زوال محتوى الذكاء الاصطناعي على يوتيوب بل هو عام زوال محتوى الذكاء الاصطناعي الكسول وسينتصر المحتوى الهادف الذي يقوده المبدعون، فإذا تبنّيتَ الشفافية والأصالة والإبداع الهجين فستنمو قناتك أسرع من أي وقت مضى، وتذكر دائماً أن المبدعون الناجحون في هذا العصر الجديد ليسوا من يتحدون القواعد بل هم من يتطورون قبل غيرهم
A powerful shift is taking place inside the world of data science. The transformation is not driven only by larger datasets or stronger algorithms but by a fundamental change in the process that shapes every machine learning model: feature engineering. With the arrival of automated feature engineering powered by artificial intelligence, data teams now craft deep, meaningful features at speeds previously unimaginable. Performance increases, workflows accelerate, and the discovery of hidden patterns becomes vastly more accessible.
The Core Importance of Feature Engineering
Feature engineering has always been the heart of machine learning. The quality of the features determines how deeply a model can understand the patterns inside the data. For years, analysts relied on domain knowledge, logical reasoning, and experimentation to build transformations manually. While effective, manual feature engineering is slow and limited by human intuition. As data grows more complex, the need for a scalable, intelligent solution becomes undeniable.
How AI Transforms Feature Engineering
Artificial intelligence automates the creation, transformation, and selection of features using techniques such as deep feature synthesis, automated encodings, interaction discovery, and optimization algorithms capable of exploring massive feature spaces. Instead of days of manual work, AI generates hundreds or thousands of sophisticated features in minutes. This automation provides creativity beyond human possibility and uncovers deeper relationships hidden in the data.
A Glimpse Into How I Started Generating Deep Features Automatically
My journey with automated deep feature generation began when I was working on a dataset filled with layered relationships that manual engineering simply could not capture efficiently. I found myself repeating the same transformations and exploring combinations that consumed endless hours. That experience pushed me to experiment with automated tools, especially Featuretools and early AutoML platforms. Watching an engine build layered, multi-level deep features in minutes—many of which were more powerful than what I had manually produced—changed everything. From that moment, automation became an essential part of every project I handled, turning the machine into a creative partner that explores the full depth of the data.
Diagram: How Automated Feature Engineering Fits Into the Workflow
This diagram gives readers a clear mental model of where automation sits in the pipeline.
Code Example: Deep Feature Synthesis in Python
Below is a simple but clear example that demonstrates how automated feature engineering works using the Featuretools library.
This snippet creates automatic aggregated features such as:
total purchase amount
average order value
number of orders
time based transformations
All generated in seconds.
Advertisements
The Real Advantages of Automated Feature Engineering
Automated feature engineering accelerates development time, expands analytical creativity, and enhances the quality of machine learning models. It lifts the burden of repetitive transformations, improves interpretability, and empowers smaller teams to achieve expert-level results. The model accuracy improvements can be dramatic because the system explores combinations far beyond human capacity.
Real Life Example From Practice
Consider a retail company preparing a churn prediction model. Manual engineering reveals basic insights such as purchase frequency, product preferences, and loyalty activity. Automated feature engineering uncovers deeper dimensions like seasonal patterns, rolling window behaviors, discount sensitivity, and previously unseen interactions between product groups. These discoveries reshape the model entirely and significantly boost predictive power.
How Automated Feature Engineering Fits Into Modern Workflows
Within modern pipelines, automated feature engineering sits between data preparation and model training. It reduces iteration loops, simplifies experimentation, and stabilizes performance. When integrated with cloud based AutoML systems, the process becomes almost fully end-to-end, allowing teams to move directly from raw data to validated predictions with minimal friction.
The Future of Automated Feature Engineering
Future systems will understand human input more naturally, interpret business context, and generate features aligned with specific industry logic rather than generic transformations. AI will evolve into an intelligent assistant that learns from project preferences and produces domain-aware feature engineering strategies. This shift will further elevate the speed and quality of predictive analytics.
Conclusion
Automated feature engineering marks a major milestone in the evolution of machine learning. It empowers teams to discover patterns hidden deep within their data, boosts the performance of predictive models, and removes the limits of traditional manual processes. By embracing automation, data professionals free themselves to focus on strategic insights, creative exploration, and impactful decision making.
Advertisements
رحلة شخصية في هندسة الميزات المؤتمتة المُعمّقة
Advertisements
يشهد عالم علوم البيانات تحولاً جذرياً، إذ لا يقتصر هذا التحول على مجموعات بيانات أكبر أو خوارزميات أقوى، بل يشمل أيضاً تغييراً جذرياً في العملية التي تُشكل كل نموذج تعلّم آلي: هندسة الميزات
مع ظهور هندسة الميزات المؤتمتة المدعومة بالذكاء الاصطناعي تُنشئ فرق البيانات الآن ميزات عميقة وذات معنى بسرعات لم تكن مُتوقعة من قبل بحيث يزداد الأداء وتتسارع وتيرة العمل ويصبح اكتشاف الأنماط الخفية أسهل بكثير
الأهمية الجوهرية لهندسة الميزات
لطالما كانت هندسة الميزات جوهر تعلّم الآلة، إذ تُحدد جودة الميزات مدى قدرة النموذج على فهم الأنماط داخل البيانات، ولسنوات اعتمد المحللون على المعرفة الميدانية والتفكير المنطقي والتجريب لبناء التحويلات يدوياً، فعلى الرغم من فعالية هندسة الميزات اليدوية إلا أنها بطيئة ومحدودة بالحدس البشري، ومع تزايد تعقيد البيانات تصبح الحاجة إلى حل ذكي وقابل للتطوير أمراً لا يمكن إنكاره
كيف يُحدث الذكاء الاصطناعي نقلة نوعية في هندسة الميزات
يُؤتمت الذكاء الاصطناعي إنشاء الميزات وتحويلها واختيارها باستخدام تقنيات مثل التوليف العميق للميزات والترميز الآلي واكتشاف التفاعلات وخوارزميات التحسين القادرة على استكشاف مساحات ميزات هائلة، فبدلاً من قضاء أيام في العمل اليدوي يُنتج الذكاء الاصطناعي مئات أو آلاف الميزات المتطورة في دقائق، بحيث تُوفر هذه الأتمتة إبداعاً يفوق القدرات البشرية وتكشف عن علاقات أعمق مخفية في البيانات
لمحة عن كيف بدأتُ توليد الميزات العميقة تلقائياً
بدأت رحلتي مع توليد الميزات العميقة تلقائياً عندما كنتُ أعمل على مجموعة بيانات مليئة بالعلاقات الطبقية التي لم تتمكن الهندسة اليدوية من التقاطها بكفاءة، فوجدتُ نفسي أُكرر نفس التحويلات وأستكشف تركيبات استغرقت ساعات طويلة، وهذه التجربة دفعتني إلى تجربة الأدوات الآلية
المبكرة AutoML ومنصات Featuretools وخاصةً
إن مشاهدة محرك يبني ميزات عميقة متعددة الطبقات ومتعددة المستويات في دقائق – كان العديد منها أقوى مما أنتجته يدوياً – غيّر كل شيء، ومنذ تلك اللحظة أصبحت الأتمتة جزءاً أساسياً من كل مشروع أتعامل معه مما حوّل الآلة إلى شريك إبداعي يستكشف عمق البيانات بالكامل
رسم تخطيطي: كيف تتكامل هندسة الميزات المؤتمتة مع سير العمل
يقدم هذا الرسم البياني للقراء نموذجاً ذهنياً واضحاً لمكان وجود الأتمتة في خط الأنابيب
مثال على الكود : توليف الميزات العميقة في بايثون
فيما يلي مثال بسيط وواضح يوضح كيفية عمل هندسة الميزات المؤتمتة
Featuretools باستخدام مكتبة
: يُنشئ هذا المقتطف ميزات مُجمّعة تلقائياً، مثل
إجمالي مبلغ الشراء *
متوسط قيمة الطلب *
عدد الطلبات *
تحويلات زمنية *
تُولّد جميعها في ثوانٍ
Advertisements
المزايا الحقيقية لهندسة الميزات المؤتمتة
تُسرّع هندسة الميزات المؤتمتة وقت التطوير وتُوسّع نطاق الإبداع التحليلي وتُحسّن جودة نماذج التعلم الآلي، فهي تُخفّف من عبء التحويلات المتكررة وتُحسّن قابلية التفسير وتُمكّن الفرق الصغيرة من تحقيق نتائج بمستوى الخبراء، بحيث يُمكن أن تكون تحسينات دقة النموذج هائلة لأن النظام يستكشف تركيبات تتجاوز بكثير القدرات البشرية
مثال عملي من واقع الحياة
لنفترض أن شركة تجزئة تُعدّ نموذجاً للتنبؤ بانخفاض عدد العملاء، وهنا تكشف الهندسة اليدوية عن رؤى أساسية مثل تكرار الشراء وتفضيلات المنتجات ونشاط الولاء، بينما تكشف هندسة الميزات الآلية عن أبعاد أعمق مثل الأنماط الموسمية وسلوكيات فترات التخفيض وحساسية الخصم والتفاعلات غير المُلاحظة سابقاً بين مجموعات المنتجات وعليه تُعيد هذه الاكتشافات تشكيل النموذج بالكامل وتُعزز بشكل كبير القدرة التنبؤية
كيف تتلاءم هندسة الميزات المؤتمة مع سير العمل الحديث
في أنظمة العمل الحديثة تقع هندسة الميزات المؤتمتة بين إعداد البيانات وتدريب النماذج، فهي تُقلل من حلقات التكرار وتُبسط عملية التجريب وتُعزز استقرار الأداء
السحابية AutoML وعند دمجها مع أنظمة
تُصبح العملية متكاملة تقريباً مما يسمح للفرق بالانتقال مباشرةً من البيانات الخام إلى التنبؤات المُتحقق منها بأقل قدر من الاحتكاك
مستقبل هندسة الميزات الآلية
ستفهم الأنظمة المستقبلية المدخلات البشرية بشكل أكثر طبيعية وتُفسر سياق العمل وتُنشئ ميزات تتوافق مع منطق قطاع مُحدد بدلاً من التحولات العامة، وبناءً عليه سيتطور الذكاء الاصطناعي إلى مساعد ذكي يتعلم من تفضيلات المشروع ويُنتج استراتيجيات هندسة ميزات مُراعية للمجال، وسيُعزز هذا التحول سرعة وجودة التحليلات التنبؤية
الخلاصة
تُمثل هندسة الميزات المؤتمتة علامة فارقة في تطور التعلم الآلي، فهي تُمكّن الفرق من اكتشاف الأنماط المُخبأة في أعماق بياناتها وتُعزز أداء النماذج التنبؤية وتُزيل قيود العمليات اليدوية التقليدية، فمن خلال تبني الأتمتة يتمكن متخصصو البيانات من التركيز على الرؤى الاستراتيجية والاستكشاف الإبداعي واتخاذ القرارات المؤثرة
Modern warehouses aren’t just storage centers — they’re the heartbeat of efficient, scalable, and resilient supply chains. Yet many organizations still run on outdated systems that rely heavily on manual tracking, reactive maintenance, and fragmented data. The smartest investments today focus on technology, software, and organizational innovation that align teams, automate processes, and increase safety and ROI.
TL;DR
To boost warehouse performance, businesses should invest in:
Smart logistics systems that connect assets and workflows in real time
Data-driven platforms for forecasting and resource allocation
Robotics, automation, and safety-first design
Training and workflow standardization that support operational excellence
These upgrades improve speed, safety, and accuracy — and ultimately deliver higher profitability.
Why Modern Warehouses Need Smarter Investment
The logistics landscape has changed. Warehouses now must handle:
Higher SKU diversity
Shorter delivery windows
Real-time visibility expectations
Old models can’t keep up. The result is costly downtime, wasted space, and avoidable errors. Companies investing in integrated, intelligent warehouse systems are outperforming competitors on both productivity and cost control.
Data-driven insights are reshaping how warehouses operate — shifting them from reactive problem-solving to proactive, strategic decision-making. When leaders can see patterns in their operations through clear, connected data, they can anticipate demand shifts, prevent stockouts, and allocate resources more efficiently. With real-time analytics, warehouses evolve from chasing yesterday’s issues to planning for tomorrow’s performance.
Data World supports this transformation by providing analytics consulting and business-intelligence services that help teams optimize inventory levels, forecast demand with greater precision, and streamline logistics workflows. The result is a smarter, more agile warehouse network that operates with confidence and clarity at every level of the supply chain.
These systems allow leaders to track KPIs continuously and respond to operational changes immediately.
3. Data-Driven Decision Systems
Turning warehouse data into actionable intelligence is a competitive differentiator. By leveraging analytics tools likeTableau orPower BI, managers can forecast demand, detect inefficiencies, and plan smarter.
Data-driven visibility turns warehouse management from a reactive function into a strategic growth driver.
4. Edge-Enabled Logistics Infrastructure
Investing in smart logistics technologies — such as real-time data systems and edge computing — allows companies to track assets and automate decisions closer to the action. Edge systems reduce latency, increase accuracy, and enable predictive maintenance.
Theimpact of smart logistics edge computing lies in combining local processing with industrial resilience — delivering exceptional performance in tough environments like high-bay warehouses and multi-node distribution networks.
Advertisements
5. Safety & Ergonomics That Pay Back Fast
Safer work is faster work. Start with ergonomic lifts, better workstation heights, and simple traffic rules for forklifts and AMRs. Add wearable safety tech that nudges better movement and flags risky lifts before they become injuries. A practical option isStrongArm’s FUSE wearables, which help teams reduce strain and coach safer techniques on the floor. Pair that with quick-hit fixes—anti-fatigue mats, lighter totes, and clear pick labeling—and you’ll cut lost-time incidents while keeping throughput steady.
6. Training and Organizational Design
Technology alone isn’t enough. Workforce alignment — through clear SOPs, data literacy, and performance incentives — amplifies every other investment. Platforms likeUdemy Business help train teams to operate advanced systems effectively.
How to Get Started: A Step-by-Step Guide
Step
Focus Area
Key Action
Expected Result
1
Assess Operations
Conduct a warehouse audit
Identify performance bottlenecks
2
Prioritize Upgrades
Rank investments by ROI and risk reduction
Maximize budget impact
3
Deploy Smart Tech
Implement automation, sensors, and WMS
Improve efficiency and data flow
4
Integrate Data Systems
Link analytics with real-time operations
Enable predictive insights
5
Train & Monitor
Build continuous improvement teams
Sustain long-term gains
Investment Readiness Checklist
Before investing, confirm that your organization:
Has reliable Wi-Fi and edge-capable hardware
Uses standardized data across departments
Has leadership buy-in for cross-functional integration
Tracks warehouse KPIs regularly
Maintains an active safety and training program
Product Spotlight: Blue Yonder Warehouse Management
If you need end-to-end control across inventory, labor, and automation,Blue Yonder Warehouse Management is a strong contender. It unifies slotting, tasking, and real-time execution so managers can orchestrate work across people and machines, spot bottlenecks early, and keep orders flowing. Many teams use it to standardize processes across multiple sites, improve pick accuracy, and shorten cycle times without ripping out existing equipment.
FAQ
Q: What is the best starting point for digital transformation in warehousing? Begin with data visibility — implement a WMS and integrate it with analytics platforms before adding automation.
Q: Are robotics solutions viable for small or mid-sized warehouses? Yes. Modular automation systems now scale affordably, and many robotics vendors offer subscription-based pricing.
Q: How long does it take to see ROI from warehouse tech upgrades? Most businesses report measurable gains in 6–12 months, especially from automation and analytics integration.
Warehouses are no longer static back-end facilities — they’re dynamic intelligence hubs that can make or break customer experience. The most successful operators invest in automation, real-time visibility, and workforce empowerment. By prioritizing these areas, businesses not only increase efficiency and safety but also future-proof their operations for the next era of logistics.
by verginia cooper
Advertisements
أين ينبغي للشركات الاستثمار لتحويل عمليات المستودعات
Advertisements
المستودعات الحديثة ليست مجرد مراكز تخزين، بل هي القلب النابض لسلاسل توريد فعّالة وقابلة للتوسع ومرنة. ومع ذلك، لا تزال العديد من المؤسسات تعمل على أنظمة قديمة تعتمد بشكل كبير على التتبع اليدوي والصيانة التفاعلية والبيانات المجزأة. تُركز أذكى الاستثمارات اليوم على التكنولوجيا والبرمجيات والابتكار التنظيمي الذي يُنسق عمل الفرق، ويُؤتمت العمليات، ويُعزز السلامة وعائد الاستثمار
:للارتقاء بأداء المستودعات، ينبغي على الشركات الاستثمار في
التدريب وتوحيد معايير سير العمل لدعم التميز التشغيلي ●
تُحسّن هذه التحديثات السرعة والسلامة والدقة، وتُحقق في النهاية ربحية أعلى
لماذا تحتاج المستودعات الحديثة إلى استثمار أذكى؟
: لقد تغيّر مشهد الخدمات اللوجستية، لذا يجب على المستودعات الآن التعامل مع
تنوع أكبر في وحدات التخزين ●
فترات تسليم أقصر ●
توقعات رؤية آنية ●
لا تستطيع النماذج القديمة مواكبة التطورات والنتيجة هي توقفات مكلفة ومساحات مهدرة وأخطاء يمكن تجنبها. تتفوق الشركات التي تستثمر في أنظمة المستودعات المتكاملة والذكية على منافسيها في كل من الإنتاجية وضبط التكاليف
كيف يمكن للأتمتة تحسين الإنتاجية دون زيادة عدد الموظفين
مجالات الاستثمار الرئيسية
تُعيد الرؤى القائمة على البيانات تشكيل آلية عمل المستودعات – فتنتقل من حل المشكلات التفاعلي إلى اتخاذ قرارات استراتيجية استباقية، فعندما يتمكن القادة من رؤية أنماط عملياتهم من خلال بيانات واضحة ومترابطة يمكنهم توقع تحولات الطلب ومنع نفاد المخزون وتخصيص الموارد بكفاءة أكبر، فبفضل التحليلات الآنية تتطور المستودعات من ملاحقة مشاكل الأمس إلى التخطيط لأداء الغد
من خلال توفير استشارات تحليلية وخدمات ذكاء أعمال تساعد الفرق على تحسين مستويات المخزون والتنبؤ بالطلب بدقة أكبر وتبسيط سير العمل اللوجستي، والنتيجة هي شبكة مستودعات أكثر ذكاءً ومرونة، تعمل بثقة ووضوح على جميع مستويات سلسلة التوريد
2. (WMS)برنامج إدارة المستودعات
: الحديثة ما يلي WMS توفر منصات
رؤية فورية للمخزون ●
تخطيط العمالة وتحسين الفترات الزمنية ●
(ERP) تكامل سلس مع أنظمة تخطيط موارد المؤسسات ●
تتيح هذه الأنظمة للقادة تتبع مؤشرات الأداء الرئيسية باستمرار والاستجابة الفورية للتغييرات التشغيلية
3. أنظمة اتخاذ القرارات القائمة على البيانات
يُعد تحويل بيانات المستودعات إلى معلومات استخباراتية عملية ميزة تنافسية
Power BI أو Tableau فمن خلال الاستفادة من أدوات التحليل مثل
يمكن للمديرين التنبؤ بالطلب واكتشاف أوجه القصور والتخطيط بشكل أذكى، بحيث تحوّل الرؤية القائمة على البيانات إدارة المستودعات من وظيفة تفاعلية إلى محرك نمو استراتيجي
٤. البنية التحتية اللوجستية المُمكّنة بالحافة
يُتيح الاستثمار في تقنيات اللوجستيات الذكية – مثل أنظمة البيانات الفورية والحوسبة الطرفية – للشركات تتبع الأصول وأتمتة القرارات في وقت أقرب إلى الحدث، وبالتالي تُقلل أنظمة الحافة من زمن الوصول وتزيد من الدقة وتُمكّن الصيانة التنبؤية
يكمن تأثير الحوسبة الطرفية اللوجستية الذكية في الجمع بين المعالجة المحلية والمرونة الصناعية مما يُوفر أداءً استثنائيًا في البيئات الصعبة مثل المستودعات عالية الارتفاع وشبكات التوزيع متعددة العقد
Advertisements
٥. السلامة وبيئة العمل اللذان يُؤتيان ثمارهما سريعًا
العمل الأكثر أمانًا هو العمل الأسرع، لذا ابدأ برافعات مُريحة وارتفاعات أفضل لمحطات العمل وقواعد مرور بسيطة للرافعات الشوكية والمركبات ذاتية الحركة، وأضف تقنية السلامة القابلة للارتداء التي تُحفز الحركة بشكل أفضل وتُنبه المصاعد الخطرة قبل أن تُصبح إصابات
خيارًا عمليًا StrongArm القابل للارتداء من FUSE يُعدّ جهاز
حيث يُساعد الفرق على تقليل الإجهاد وتدريبهم على أساليب أكثر أمانًا على أرض الواقع، أضف إلى ذلك حلولاً سريعة – مثل سجادات مقاومة للتعب وحقائب أخف وزنًا ووضع ملصقات واضحة على مواقع الالتقاط – وستتمكن من تقليل حوادث ضياع الوقت مع الحفاظ على استقرار الإنتاج
6. التدريب والتصميم التنظيمي
التكنولوجيا وحدها لا تكفي، فمواءمة القوى العاملة – من خلال إجراءات تشغيل قياسية واضحة، وفهم البيانات، وحوافز الأداء – تُعزز جميع الاستثمارات الأخرى
Udemy Business تساعد منصات مثل
في تدريب الفرق على تشغيل الأنظمة المتقدمة بفعالية
كيفية البدء: دليل خطوة بخطوة
النتيجة المتوقعة
الإجراء الرئيسي
مجال التركيز
الخطوة
تحديد أولويات الترقيات
إجراء تدقيق للمستودعات
تقييم العمليات
1
تعظيم أثر الميزانية
تصنيف الاستثمارات حسب عائد الاستثمار وتقليل المخاطر
إعطاء الأولوية للتحديثات
2
تحسين الكفاءة وتدفق البيانات
تنفيذ الأتمتة وأجهزة الاستشعار ونظام إدارة المستودعات
نشر التقنيات الذكية
3
تمكين الرؤى التنبؤية
ربط التحليلات بالعمليات في الوقت الفعلي
دمج أنظمة البيانات
4
الحفاظ على المكاسب طويلة الأمد
بناء فرق التحسين المستمر
التدريب والمراقبة
5
قائمة التحقق من جاهزية الاستثمار
: قبل الاستثمار تأكد من أن مؤسستك
تمتلك شبكة واي فاي موثوقة وأجهزة متوافقة مع الأجهزة الطرفية ●
تستخدم بيانات موحدة في جميع الأقسام ●
تحظى بدعم القيادة للتكامل بين الوظائف ●
تتابع مؤشرات الأداء الرئيسية للمستودعات بانتظام ●
تحافظ على برنامج فعال للسلامة والتدريب ●
لإدارة المستودعاتBlue Yonder:منتج مميز
إذا كنت بحاجة إلى تحكم شامل في المخزون والعمالة والأتمتة
فهو يوحد عمليات تحديد الفترات الزمنية وتوزيع المهام والتنفيذ الفوري مما يسمح للمديرين بتنظيم العمل بين الأفراد والآلات ورصد الاختناقات مبكرًا والحفاظ على تدفق الطلبات، إذ تستخدمه العديد من الفرق لتوحيد العمليات في مواقع متعددة وتحسين دقة الاستلام وتقصير دورات العمل دون الحاجة إلى إزالة المعدات الحالية
الأسئلة الشائعة
س: ما هي أفضل نقطة انطلاق للتحول الرقمي في مجال المستودعات؟
(WMS) ابدأ برؤية البيانات – نفّذ نظام إدارة المستودعات
وادمجه مع منصات التحليلات قبل إضافة الأتمتة
س: هل حلول الروبوتات مناسبة للمستودعات الصغيرة والمتوسطة؟
نعم تتوسع أنظمة الأتمتة المعيارية الآن بتكلفة معقولة، ويقدم العديد من موردي الروبوتات أسعارًا قائمة على الاشتراك
س: كم من الوقت يستغرق تحقيق عائد استثمار من ترقيات تقنيات المستودعات؟
تبلغ معظم الشركات عن مكاسب ملموسة خلال 6-12 شهرًا، وخاصةً من خلال دمج الأتمتة والتحليلات
س: كيف يمكن للفرق مواكبة أحدث اتجاهات تقنيات المستودعات؟
لم تعد المستودعات مجرد مرافق خلفية ثابتة بل أصبحت مراكز ذكاء ديناميكية قادرة على تحسين تجربة العملاء أو إفسادها، يستثمر أنجح المشغلين في الأتمتة والرؤية الفورية وتمكين القوى العاملة. فمن خلال إعطاء الأولوية لهذه المجالات لا تزيد الشركات من الكفاءة والسلامة فحسب بل تضمن أيضًا جاهزية عملياتها للمستقبل في عصر الخدمات اللوجستية القادم
Geospatial data is no longer limited to maps and traditional GIS systems. Today, Python provides a bridge connecting GIS expertise with the power of data science. Professionals who understand spatial data and can manipulate it programmatically are in high demand. The path from GIS to data science requires not just learning new Python libraries, but also understanding spatial thinking, analytics, and automation.
This article presents nine essential books that will strengthen your Python geospatial skills and guide you in becoming a full-fledged GIS data scientist. Each book is carefully selected to cover theory, practical exercises, automation, and advanced spatial analysis, giving you a clear roadmap to excel in GIS with Python.
1. Python Geospatial Analysis Cookbook by Michael Diener
This book is perfect for practitioners looking for a hands-on approach. It offers a variety of practical recipes that cover data formats, shapefiles, raster data, coordinate reference systems, and common spatial operations. Each chapter focuses on solving real-world GIS problems while teaching Python techniques. You will learn how to read, process, and analyze spatial datasets, automate repetitive tasks, and visualize results using popular libraries like Geopandas and Matplotlib. The step-by-step approach allows GIS analysts transitioning from desktop software to gain confidence in coding efficiently while seeing immediate results. This makes it an ideal starting point for anyone wanting to build a strong foundation in Python geospatial analysis.
2. Learning Geospatial Analysis with Python by Joel Lawhead
This book is a comprehensive guide for beginners and intermediate GIS professionals. It starts by explaining the basic principles of Geographic Information Systems, including projections, coordinate systems, and spatial data types. Then, it introduces Python programming for spatial analysis. You will explore automation of GIS tasks using libraries like Geopandas, Rasterio, Shapely, and Fiona. The book provides exercises to manipulate vector and raster datasets, perform spatial joins, and create maps programmatically. The clear connection between GIS theory and Python implementation helps build a solid understanding for anyone aiming to automate GIS workflows and prepare for data science applications in spatial contexts.
3. Mastering Geospatial Analysis with Python by Silas Toms and Paul Crickard
This advanced book is for those who already understand the basics of Python GIS. It delves into network analysis, spatial databases, and the development of web-based geospatial applications using Flask and Leaflet. You will learn to integrate Python scripts with PostGIS databases, perform advanced spatial queries, and develop interactive spatial dashboards. The book emphasizes combining Python programming skills with GIS knowledge to tackle complex problems in transportation, urban planning, and environmental modeling. It encourages readers to think like spatial data scientists, moving from simple map creation to data-driven decision making using Python as the main tool.
4. Geoprocessing with Python by Chris Garrard
Focused on automation, this book shows how to streamline GIS workflows both inside traditional desktop GIS environments and in open-source Python ecosystems. It explains ARCPY, OGR, Shapely, and Fiona in depth, teaching readers to automate repetitive tasks like geocoding, spatial joins, and map production. You will gain practical skills for cleaning and transforming large spatial datasets, preparing them for analysis or visualization. It is particularly useful for GIS professionals who want to reduce manual work and integrate Python into everyday GIS operations, saving time and increasing accuracy in projects.
5. Python for Geospatial Data Analysis by Bonny P McClain
This book combines spatial statistics with data science thinking. It moves beyond map creation to predictive modeling and data-driven insights using libraries like Pandas, Scikit Learn, and Geopandas. You will learn to calculate spatial autocorrelation, perform clustering and regression on geospatial datasets, and integrate spatial variables into machine learning models. It is ideal for GIS analysts who want to apply analytical methods to uncover patterns, trends, and relationships in spatial data, making it relevant for urban planning, environmental studies, and business analytics projects where Python provides an edge in processing and analysis.
Advertisements
6. Automating GIS Processes by Henrikki Tenkanen and Vuokko Heikinheimo
Developed by university researchers, this open textbook is freely accessible and teaches automated workflows in GIS using Python. It covers reading, writing, and visualizing spatial data, performing basic and advanced analysis, and writing reusable scripts for reproducible research. You will learn best practices for structuring code, managing projects, and documenting workflows, which is essential for GIS professionals entering the data science world.
7. Geospatial Data Science with Python by Bonny P McClain
This newer release expands on her previous work by introducing advanced techniques like geocoding, clustering, and spatial machine learning. It brings together theory and applied projects that resemble real data science pipelines, making it an excellent progression once you have mastered the basics. You will learn to perform spatial clustering to detect hotspots, apply machine learning models to geospatial data, and integrate Python visualization tools to create interactive and informative maps. The book strengthens both analytical thinking and coding skills, giving GIS analysts practical experience to operate at the intersection of GIS and data science.
8. Practical GIS by Gábor Szabó
This book guides you through open-source GIS ecosystems like QGIS and PostGIS while integrating them with Python automation. It is designed for professionals who want to bridge desktop GIS experience with backend database-driven systems. You will learn to connect Python scripts with spatial databases, automate data imports and exports, perform spatial queries, and develop workflows that combine GIS tools with programmatic solutions, enhancing productivity and ensuring reproducibility in GIS projects.
9. Python Geospatial Development by Erik Westra
One of the earliest yet still relevant references on building complete geospatial applications. It walks you from handling coordinates and projections to creating interactive maps and integrating them with web frameworks. You will learn how to develop end-to-end geospatial projects, acquire data, process it, visualize results, and deliver interactive mapping solutions. This book is ideal as a final step in your journey, consolidating Python skills and GIS knowledge to produce professional geospatial applications.
Conclusion
Moving from GIS to data science is more than learning new syntax. It is about changing how you think about data. Each of these ten books gives you not just tools, but ways of reasoning spatially, computationally, and statistically. By reading them and applying their lessons, you will transform from a map maker into a spatial data scientist capable of solving complex challenges with Python. The roadmap provided by these books ensures you grow from a GIS analyst to a Python-powered geospatial expert, ready to tackle any real-world spatial problem.
Advertisements
إتقان بايثون لنظم المعلومات الجغرافية: تسعة كتب أساسية يجب على كل محلل نظم معلومات جغرافية قراءتها
Advertisements
لم تعد البيانات الجغرافية المكانية مقتصرة على الخرائط وأنظمة المعلومات الجغرافية التقليدية، فاليوم تُوفر بايثون جسراً يربط بين خبرة نظم المعلومات الجغرافية وقوة علم البيانات، فهناك طلب كبير على المتخصصين الذين يفهمون البيانات المكانية ويستطيعون معالجتها برمجياً، إذ لا يتطلب الانتقال من نظم المعلومات الجغرافية إلى علم البيانات مجرد تعلم مكتبات بايثون جديدة بل يتطلب أيضاً فهم التفكير المكاني والتحليلات والأتمتة
تقدم هذه المقالة تسعة كتب أساسية تُعزز مهاراتك الجغرافية المكانية في بايثون وتُرشدك لتصبح عالم بيانات متخصصاً في نظم المعلومات الجغرافية، فقد تم اختيار كل كتاب بعناية ليغطي الجوانب النظرية والتمارين العملية والأتمتة والتحليل المكاني المتقدم مما يمنحك خارطة طريق واضحة للتفوق في نظم المعلومات الجغرافية باستخدام بايثون
1. Python Geospatial Analysis Cookbook by Michael Diener
هذا الكتاب مثالي للمتخصصين الذين يبحثون عن نهج عملي، إذ يقدم هذا الكتاب مجموعة متنوعة من الوصفات العملية التي تغطي تنسيقات البيانات وملفات الأشكال والبيانات النقطية وأنظمة الإحداثيات المرجعية والعمليات المكانية الشائعة، بحيث يركز كل فصل على حل مشاكل نظم المعلومات الجغرافية الواقعية مع تعليم تقنيات بايثون، فيه ستتعلم كيفية قراءة ومعالجة وتحليل مجموعات البيانات المكانية وأتمتة المهام المتكررة
Matplotlibو Geopandas وتصور النتائج باستخدام مكتبات شائعة مثل
إذ يتيح هذا النهج التدريجي لمحللي نظم المعلومات الجغرافية الذين ينتقلون من برامج سطح المكتب اكتساب الثقة في البرمجة بكفاءة مع رؤية نتائج فورية وهذا ما يجعله نقطة انطلاق مثالية لأي شخص يرغب في بناء أساس متين في التحليل الجغرافي المكاني باستخدام بايثون
2. Learning Geospatial Analysis with Python by Joel Lawhead
يُعد هذا الكتاب دليلاً شاملاً للمبتدئين ومحترفي نظم المعلومات الجغرافية ذوي الخبرة المتوسطة. يبدأ الكتاب بشرح المبادئ الأساسية لنظم المعلومات الجغرافية، بما في ذلك الإسقاطات، وأنظمة الإحداثيات، وأنواع البيانات المكانية. ثم يُقدم برمجة بايثون للتحليل المكاني
(GIS) ستستكشف أتمتة مهام نظم المعلومات الجغرافية
Fiona و Shapely و Rasterio و Geopandas باستخدام مكتبات مثل
يوفر الكتاب تمارين للتعامل مع مجموعات البيانات المتجهة والنقطية وإجراء عمليات الربط المكاني وإنشاء الخرائط برمجياً، بحيث يساعد الارتباط الواضح بين نظرية نظم المعلومات الجغرافية وتطبيقات بايثون على بناء فهم متين لأي شخص يسعى إلى أتمتة سير عمل نظم المعلومات الجغرافية والتحضير لتطبيقات علوم البيانات في السياقات المكاني
3. Mastering Geospatial Analysis with Python by Silas Toms and Paul Crickard
هذا الكتاب المتقدم مُصمم لمن يفهمون أساسيات بايثون لنظم المعلومات الجغرافية، إذ يتعمق الكتاب في تحليل الشبكات وقواعد البيانات المكانية
Flask و Leaflet وتطوير تطبيقات جغرافية مكانية على الويب باستخدام
PostGIS ستتعلم دمج نصوص بايثون مع قواعد بيانات
وإجراء استعلامات مكانية متقدمة وتطوير لوحات معلومات مكانية تفاعلية، بحيث يُركز الكتاب على الجمع بين مهارات برمجة بايثون ومعرفة نظم المعلومات الجغرافية لمعالجة المشكلات المعقدة في مجالات النقل والتخطيط الحضري والنمذجة البيئية، وبناءً على ذلك يُشجع هذا الكتاب القراء على التفكير كعلماء بيانات مكانية والانتقال من إنشاء الخرائط البسيطة إلى اتخاذ قرارات قائمة على البيانات باستخدام بايثون كأداة رئيسية
4. Geoprocessing with Python by Chris Garrard
يُركز هذا الكتاب على الأتمتة
GIS ويُوضح كيفية تبسيط سير عمل نظم المعلومات الجغرافية
داخل بيئات نظم المعلومات الجغرافية المكتبية التقليدية وفي أنظمة بايثون مفتوحة المصدر
بعمق ARCPY و OGR و Shapely و Fiona يشرح الكتاب
ويُعلّم القراء كيفية أتمتة المهام المتكررة مثل الترميز الجغرافي والوصلات المكانية وإنتاج الخرائط، ستكتسب مهارات عملية لتنظيف وتحويل مجموعات البيانات المكانية الكبيرة وإعدادها للتحليل أو التصور، ويُعد هذا الكتاب مفيداً بشكل خاص لمحترفي نظم المعلومات الجغرافية الذين يرغبون في تقليل العمل اليدوي ودمج بايثون في عمليات نظم المعلومات الجغرافية اليومية مما يوفر الوقت ويزيد من دقة المشاريع
Advertisements
5. Python for Geospatial Data Analysis by Bonny P McClain
يجمع هذا الكتاب بين الإحصاءات المكانية والتفكير في علم البيانات، إذ يتجاوز هذا البرنامج إنشاء الخرائط ليصل إلى النمذجة التنبؤية والرؤى المستندة إلى البيانات
Pandas و Scikit Learn و Geopandas باستخدام مكتبات مثل
ستتعلم كيفية حساب الارتباط التلقائي المكاني وإجراء التجميع والانحدار على مجموعات البيانات الجغرافية المكانية ودمج المتغيرات المكانية في نماذج التعلم الآلي، وهو مثالي لمحللي نظم المعلومات الجغرافية الراغبين في تطبيق أساليب تحليلية لاكتشاف الأنماط والاتجاهات والعلاقات في البيانات المكانية مما يجعله مناسباً لمشاريع التخطيط الحضري والدراسات البيئية وتحليلات الأعمال حيث توفر بايثون ميزة في المعالجة والتحليل
6. Automating GIS Processes by Henrikki Tenkanen and Vuokko Heikinheimo
هذا الكتاب المفتوح الذي طُوّر من قِبل باحثين جامعيين متاح مجاناً ويُدرّس سير العمل الآلي في نظم المعلومات الجغرافية باستخدام بايثون، إذ يُغطي الكتاب قراءة البيانات المكانية وكتابتها وتصورها وإجراء تحليلات أساسية ومتقدمة وكتابة نصوص برمجية قابلة لإعادة الاستخدام لأبحاث قابلة للتكرار، ستتعلم أفضل الممارسات لهيكلة الأكواد البرمجية وإدارة المشاريع وتوثيق سير العمل وهو أمر أساسي لمحترفي نظم المعلومات الجغرافية الذين يدخلون عالم علوم البيانات
7. Geospatial Data Science with Python by Bonny P McClain
يُوسّع هذا الإصدار الجديد نطاق أعمالها السابقة من خلال تقديم تقنيات متقدمة مثل الترميز الجغرافي والتجميع والتعلم الآلي المكاني، يجمع الكتاب بين النظرية والمشاريع التطبيقية التي تُحاكي مسارات علم البيانات الحقيقية مما يجعله تقدماً ممتازاً بمجرد إتقان الأساسيات. ستتعلم كيفية إجراء التجميع المكاني لاكتشاف النقاط الساخنة وتطبيق نماذج التعلم الآلي على البيانات الجغرافية المكانية ودمج أدوات تصور بايثون لإنشاء خرائط تفاعلية وغنية بالمعلومات، يُعزز الكتاب مهارات التفكير التحليلي والبرمجة مما يمنح محللي نظم المعلومات الجغرافية خبرة عملية للعمل في تقاطع نظم المعلومات الجغرافية وعلوم البيانات
8. Practical GIS by Gábor Szabó
يرشدك هذا الكتاب عبر أنظمة نظم المعلومات الجغرافية
مع دمجها مع أتمتة بايثون QGIS و PostGIS مفتوحة المصدر مثل
صُمم هذا الكتاب للمحترفين الذين يرغبون في ربط خبرة أنظمة المعلومات الجغرافية المكتبية بأنظمة تعتمد على قواعد البيانات الخلفية، ستتعلم كيفية ربط نصوص بايثون بقواعد البيانات المكانية وأتمتة عمليات استيراد وتصدير البيانات وإجراء الاستعلامات المكانية وتطوير سير عمل تجمع بين أدوات نظم المعلومات الجغرافية والحلول البرمجية مما يعزز الإنتاجية ويضمن إمكانية التكرار في مشاريع نظم المعلومات الجغرافية
9. Python Geospatial Development by Erik Westra
يُعد هذا الكتاب من أقدم المراجع وأكثرها أهمية في بناء تطبيقات جغرافية مكانية متكاملة ويرشدك من التعامل مع الإحداثيات والإسقاطات إلى إنشاء خرائط تفاعلية ودمجها مع أطر عمل الويب. ستتعلم كيفية تطوير مشاريع جغرافية مكانية شاملة وجمع البيانات ومعالجتها وتصور النتائج وتقديم حلول خرائط تفاعلية. يُعد هذا الكتاب مثالياً كخطوة أخيرة في رحلتك حيث يجمع بين مهارات بايثون ومعرفتك بنظم المعلومات الجغرافية لإنتاج تطبيقات جغرافية مكانية احترافية
الخلاصة
الانتقال من نظم المعلومات الجغرافية إلى علم البيانات يتجاوز مجرد تعلم قواعد لغوية جديدة، بل يتعلق بتغيير طريقة تفكيرك في البيانات، فكل كتاب من هذه الكتب العشرة لا يمنحك أدوات فحسب بل طرقاً للتفكير مكانياً وحسابياً وإحصائياً، وبقراءتها وتطبيق دروسها ستتحول من مصمم خرائط إلى عالم بيانات مكانية قادر على حل التحديات المعقدة باستخدام بايثون، تضمن لك خريطة الطريق التي تقدمها هذه الكتب التطور من محلل نظم معلومات جغرافية إلى خبير جغرافي مكاني معتمد على بايثون جاهزاً لمعالجة أي مشكلة مكانية واقعية.
In today’s data-driven economy, even small businesses are becoming information ecosystems. Customer lists, sales metrics, and supplier data are no longer just operational details—they’re strategic assets that demand governance. Data governance ensures that data is accurate, secure, accessible, and used responsibly. Without it, businesses risk inefficiencies, compliance issues, and loss of customer trust.
TL;DR
Data governance = policies + processes that ensure your data is trustworthy and usable.
It protects small businesses from data breaches, regulatory fines, and decision errors.
Start simple: define who owns the data, how it’s collected, where it’s stored, and how it’s used.
Adopt digital tools and frameworks that automate compliance and security checks.
Continuous monitoring and employee training make governance sustainable.
Why Data Governance Matters for Small Businesses
Good governance transforms raw data into actionable intelligence. For small businesses, it’s a survival strategy—not a luxury.
Improved decision-making: Reliable data fuels accurate analytics and forecasts.
Regulatory compliance: Ensures adherence to privacy laws like GDPR and CCPA.
Operational efficiency: Reduces duplication and streamlines workflows.
Customer trust: Protects personal information and reinforces brand credibility.
Business continuity: Supports risk management and disaster recovery efforts.
Consider this option: small businesses in regulated industries can explore cybersecurity degree programs online to deepen internal knowledge of data protection frameworks.
Building Trust Through Secure Information Management
Data governance isn’t only about compliance—it’s about creating trust frameworks between a business and its stakeholders. By implementing robust data controls, even micro-enterprises can operate with the same rigor as large corporations. Consider aligning governance with standards like ISO 27001 or adopting cloud-native tools from providers such asMicrosoft Azure Security Center.
Small businesses that master governance early often outperform competitors when scaling, since they can integrate new data sources without chaos or compliance gaps.
The Four Pillars of Data Governance
Pillar
Description
Practical Example
Accountability
Assign clear data ownership and responsibilities.
The finance manager oversees all transaction data.
Integrity
Maintain accurate and consistent data records.
Use validation rules in CRM tools to prevent errors.
Security
Protect data from unauthorized access.
Implement two-factor authentication and encrypted backups.
Compliance
Align data practices with legal and ethical standards.
Ensure opt-in consent for marketing emails.
How to Implement Data Governance (Step-by-Step)
Assess Current Data Landscape
Identify what data exists, where it resides, and how it’s used.
Use a simple audit checklist.
Create a Governance Policy
Document rules for collection, storage, and sharing.
Define roles and escalation paths.
Select the Right Tools
Choose systems with audit trails and role-based access.
Use this checklist quarterly to evaluate your company’s data maturity.
FAQ
Q1: What is the biggest data governance mistake small businesses make? A: Treating governance as an IT issue rather than a business-wide responsibility.
Q2: How often should governance policies be reviewed? A: At least annually, or after major system or regulation changes.
Q3: Do I need expensive software for governance? A: Not necessarily. Even simple platforms like Google Workspace Admin Console offer access controls and audit logs.
Q4: Who should lead the governance initiative? A: Ideally, a cross-functional team with representation from management, IT, and operations.
Glossary
Data Governance: Framework for managing data’s availability, usability, integrity, and security.
Metadata: Data about data—used to track origin, context, and usage.
Compliance: Adherence to regulations governing data privacy and protection.
Data Steward: Person responsible for maintaining data quality and policy compliance.
Access Control: Mechanism restricting data usage to authorized individuals.
Spotlight: Modern Compliance Automation
Modern small businesses benefit from automation platforms that monitor compliance in real-time. Tools such asOneTrust,Vanta, andDrata simplify SOC 2 and GDPR readiness, freeing owners to focus on growth. These systems integrate seamlessly with CRMs, HR systems, and accounting tools, creating continuous visibility into your data environment.
Data governance is no longer optional. For small businesses, it’s the foundation of credibility, continuity, and competitive advantage. By starting small—assigning ownership, defining clear policies, and adopting security tools—you build the scaffolding for long-term data integrity.
When your data is well-governed, your business decisions become more confident, your customers more loyal, and your operations more resilient.
Unlock the power of data with Data World Consulting Group and explore our expert solutions and educational resources to elevate your business and learning journey today!
by Virginia Cooper
Advertisements
حوكمة البيانات للشركات الصغيرة: تحويل المعلومات إلى أصول
Advertisements
في اقتصاد اليوم القائم على البيانات أصبحت حتى الشركات الصغيرة تُصبح أنظمةً بيئيةً للمعلومات، لم تعد قوائم العملاء ومقاييس المبيعات وبيانات الموردين مجرد تفاصيل تشغيلية بل أصبحت أصولاً استراتيجية تتطلب حوكمة، تضمن حوكمة البيانات دقة البيانات وأمانها وسهولة الوصول إليها واستخدامها بمسؤولية، وبدونها تُواجه الشركات مخاطر انعدام الكفاءة ومشاكل الامتثال وفقدان ثقة العملاء
حوكمة البيانات = سياسات + عمليات تضمن موثوقية بياناتك وقابليتها للاستخدام *
تحمي الشركات الصغيرة من خروقات البيانات والغرامات التنظيمية وأخطاء اتخاذ القرارات *
ابدأ ببساطة: حدد من يملك البيانات وكيف تُجمع وأين تُخزن وكيف تُستخدم *
اعتمد أدوات وأطر عمل رقمية تُؤتمت عمليات التحقق من الامتثال والأمان *
الكفاءة التشغيلية: تُقلل من التكرار وتُبسط سير العمل *
ثقة العملاء: تحمي المعلومات الشخصية وتعزز مصداقية العلامة التجارية *
استمرارية الأعمال: تدعم جهود إدارة المخاطر والتعافي من الكوارث *
فكّر في هذا الخيار: يمكن للشركات الصغيرة في القطاعات الخاضعة للتنظيم استكشاف برامج شهادات الأمن السيبراني عبر الإنترنت لتعميق معرفتها الداخلية بأطر حماية البيانات
بناء الثقة من خلال إدارة معلومات آمنة
لا تقتصر حوكمة البيانات على الامتثال فحسب بل تشمل أيضاً بناء أطر ثقة بين الشركة وأصحاب المصلحة من خلال تطبيق ضوابط بيانات قوية يمكن حتى للشركات الصغيرة جداً العمل بنفس دقة الشركات الكبيرة
ISO 27001 فكّر في مواءمة الحوكمة مع معايير مثل
أو اعتماد أدوات سحابية أصلية من مزودين
Microsoft Azure Security Center مثل
الشركات الصغيرة التي تتقن الحوكمة مبكراً غالباً ما تتفوق على المنافسين عند التوسع، نظراً لقدرتها على دمج مصادر بيانات جديدة دون فوضى أو ثغرات في الامتثال
الركائز الأربع لحوكمة البيانات
مثال عملي
الوصف
الركيزة
يشرف مدير المالية على جميع بيانات المعاملات
تحديد ملكية البيانات ومسؤولياتها بوضوح
المساءلة
استخدم قواعد التحقق في أدوات إدارة علاقات العملاء لتجنب الأخطاء (CRM)
الاحتفاظ بسجلات بيانات دقيقة ومتسقة
النزاهة
طبّق المصادقة الثنائية والنسخ الاحتياطية المشفرة
حماية البيانات من الوصول غير المصرح به
الأمن
تأكد من الموافقة على رسائل البريد الإلكتروني التسويقية
مواءمة ممارسات البيانات مع المعايير القانونية والأخلاقية
الامتثال
كيفية تطبيق حوكمة البيانات (خطوة بخطوة)
1. تقييم بيئة البيانات الحالية
تحديد البيانات الموجودة ومكانها وكيفية استخدامها ●
استخدام قائمة تدقيق بسيطة ●
2. إنشاء سياسة حوكمة
توثيق قواعد التجميع والتخزين والمشاركة ●
تحديد الأدوار ومسارات التصعيد ●
3. اختيار الأدوات المناسبة
اختيار أنظمة مزودة بمسارات تدقيق وإمكانية وصول قائمة على الأدوار ●
Asana Business أو Trello Enterprise أدوات مثل ●
تساعد في تنظيم سير العمل
4. تدريب الفريق
تثقيف الموظفين حول الخصوصية والتصيد الاحتيالي ومعالجة البيانات ●
تشجيع الإبلاغ عن أي خلل في البيانات ●
5. المراقبة والتدقيق والتحسين
مراجعة فعالية الحوكمة ربع سنوياً ●
أتمتة التنبيهات الخاصة بالخلل ●
Splunk Security Cloud باستخدام أدوات مثل
Advertisements
قائمة مراجعة سلامة الحوكمة
تحديد مالكي البيانات وأمنائها ●
اختبارات النسخ الاحتياطي والاسترداد الدورية ●
مراجعة الامتثال للخصوصية سنوياً ●
تطبيق المصادقة متعددة العوامل ●
تدريب الموظفين ربع سنوياً ●
خطة موثقة للاستجابة للاختراق ●
إكمال تقييمات مخاطر الموردين ●
استخدم قائمة المراجعة هذه ربع سنوياً لتقييم نضج بيانات شركتك
الأسئلة الشائعة
س1: ما هو أكبر خطأ ترتكبه الشركات الصغيرة في مجال حوكمة البيانات؟
ج: التعامل مع الحوكمة كمسألة تتعلق بتكنولوجيا المعلومات بدلاً من كونها مسؤولية على مستوى الشركة
س2: ما مدى تكرار مراجعة سياسات الحوكمة؟
ج: سنوياً على الأقل، أو بعد تغييرات كبيرة في النظام أو اللوائح
س3: هل أحتاج إلى برامج باهظة الثمن للحوكمة؟ ج: ليس بالضرورة، حتى المنصات البسيطة
Google Workspace مثل وحدة تحكم مشرف
توفر عناصر تحكم في الوصول وسجلات تدقيق
س4: من ينبغي أن يقود مبادرة الحوكمة؟
ج: من الأفضل أن يكون هناك فريق متعدد الوظائف يضم ممثلين من الإدارة وتكنولوجيا المعلومات والعمليات
المصطلحات
حوكمة البيانات: إطار عمل لإدارة توافر البيانات وسهولة استخدامها وسلامتها وأمانها ●
البيانات الوصفية: بيانات حول البيانات تُستخدم لتتبع مصدرها وسياقها واستخدامها ●
الامتثال: الالتزام باللوائح التي تحكم خصوصية البيانات وحمايتها ●
مسؤول البيانات: الشخص المسؤول عن الحفاظ على جودة البيانات والامتثال للسياسات ●
التحكم في الوصول: آلية تقصر استخدام البيانات على الأفراد المصرح لهم ●
أتمتة الامتثال الحديثة
تستفيد الشركات الصغيرة الحديثة من منصات الأتمتة التي تراقب الامتثال آنياً
OneTrust و Vanta و Drata بحيث تُبسِّط أدوات مثل
SOC 2 عملية الاستعداد لمعايير
GDPR واللائحة العامة لحماية البيانات
مما يُتيح لأصحاب الأعمال التركيز على النمو، بحيث تتكامل هذه الأنظمة بسلاسة
CRM مع أنظمة إدارة علاقات العملاء
وأنظمة الموارد البشرية وأدوات المحاسبة مما يُتيح رؤيةً مُستمرةً لبيئة بياناتك
لم تعد حوكمة البيانات خياراً، فبالنسبة للشركات الصغيرة هي أساس المصداقية والاستمرارية والميزة التنافسية، وعليه فالبدء على نطاق صغير – بتحديد الملكية وتحديد سياسات واضحة واعتماد أدوات أمنية تُرسي دعائم سلامة البيانات على المدى الطويل
عندما تُدار بياناتك جيداً تصبح قرارات عملك أكثر ثقة وعملاؤك أكثر ولاءً وعملياتك أكثر مرونة
Introduction: Why Data Types Are the Hidden Power of Every Analysis
Every great data science project begins with understanding one simple truth — not all data is created equal. Before diving into algorithms, visualizations, or predictions, you must know what kind of data you are working with. Misunderstanding data types can lead to incorrect models, wrong insights, and hours of confusion. In this article, we will explore the types of data in statistics and how each plays a critical role in the world of data science.
1. The Two Grand Divisions: Qualitative vs Quantitative Data
All data in statistics can be classified into two main types — qualitative (categorical) and quantitative (numerical).
Qualitative (Categorical) Data
This type represents qualities, categories, or labels rather than numbers. It answers what kind rather than how much. Examples include gender, color, type of car, or country of origin.
In data science, categorical data helps in classification tasks like predicting whether an email is spam or not, or identifying the genre of a song based on lyrics.
There are two subtypes:
Nominal Data: No order or hierarchy between categories. Example: colors (red, blue, green).
Ordinal Data: Has a meaningful order, but the intervals between categories are not equal. Example: satisfaction levels (poor, fair, good, excellent).
Quantitative (Numerical) Data
This type deals with numbers and measurable quantities. It answers how much or how many. Quantitative data powers regression models, trend analysis, and time series forecasting.
Subtypes include:
Discrete Data: Countable values, often whole numbers. Example: number of students in a class.
Continuous Data: Infinite possible values within a range. Example: height, weight, or temperature.
2. A Closer Look: Scales of Measurement
Beyond basic classification, data can also be described based on its measurement scale, which defines how we can analyze and interpret it statistically.
Nominal Scale
Purely categorical with no numerical meaning. Used for grouping or labeling. Example: blood type or eye color. Data science use: Encoding these variables (like one-hot encoding) for machine learning models.
Ordinal Scale
Ordered categories, but without measurable difference between ranks. Example: star ratings on a product (1–5 stars). Data science use: Great for survey analysis or ranking models, often converted to integers for algorithms.
Interval Scale
Numerical data with equal intervals, but no true zero point. Example: temperature in Celsius or Fahrenheit. Data science use: Common in time series or sensor data where the zero point is arbitrary.
Ratio Scale
The highest level of data measurement, with equal intervals and a true zero point. Example: weight, distance, or income. Data science use: Used in predictive modeling, regression, and deep learning tasks requiring exact numeric relationships.
Advertisements
3. Why Data Types Matter So Much in Data Science
Understanding data types is more than academic theory — it directly shapes every decision you make as a data scientist:
Data Cleaning: Knowing whether to impute missing values with mean (for continuous) or mode (for categorical).
Feature Engineering: Deciding how to encode or transform variables for algorithms.
Visualization: Choosing appropriate plots — bar charts for categorical, histograms for continuous.
Model Selection: Some algorithms handle specific data types better (e.g., decision trees handle categorical data naturally).
Without correctly identifying your data types, even the most advanced model will mislead you.
4. Real-Life Example: Data Types in a Data Science Project
Imagine you are analyzing a dataset about customer purchases for an e-commerce company. Here’s how different data types appear:
Variable
Data Type
Example
Use Case
Customer ID
Nominal
C1023
Identifier
Gender
Nominal
Female
Segmentation
Age Group
Ordinal
18–25, 26–35
Market analysis
Purchase Amount
Ratio
120.50
Revenue modeling
Date of Purchase
Interval
2025-11-05
Trend analysis
Items Bought
Discrete
3
Purchase frequency
By correctly classifying these data types, you can efficiently prepare data for machine learning models, visualize insights properly, and make reliable business decisions.
Conclusion: The Secret to Smarter Data Science Starts with Data Types
In the age of AI and automation, the human skill of understanding data remains irreplaceable. Knowing whether your variable is nominal or ratio could be the difference between success and misleading outcomes. As a data scientist, always start with data classification before analysis — it’s the quiet foundation behind every powerful insight and accurate prediction.
Advertisements
أنواع البيانات الإحصائية التي يجب على عالِم بيانات أن يعرفها
Advertisements
مقدمة: لماذا تُعدّ أنواع البيانات القوة الخفية لكل تحليل
يبدأ كل مشروع علم بيانات عظيم بفهم حقيقة بسيطة واحدة – ليست كل البيانات متساوية، فقبل الخوض في الخوارزميات أو التصورات أو التنبؤات يجب أن تعرف نوع البيانات التي تعمل عليها، إذ قد يؤدي سوء فهم أنواع البيانات إلى نماذج غير صحيحة ورؤى خاطئة وساعات من الارتباك
وفي هذه المقالة سنستكشف أنواع البيانات في الإحصاء وكيف يلعب كل منها دوراً حاسماً في عالم علم البيانات
1. التقسيمان الرئيسيان: البيانات النوعية و البيانات الكمية
: يمكن تصنيف جميع البيانات في الإحصاء إلى نوعين رئيسيين
البيانات النوعية (الفئوية) والكمية (العددية)
: البيانات النوعية (الفئوية)
يمثل هذا النوع الصفات أو الفئات أو التسميات بدلاً من الأرقام، فهو يُجيب على نوع البيانات بدلاً من كميتها، ومن الأمثلة على ذلك الجنس أو اللون أو نوع السيارة أو بلد المنشأ، ففي علم البيانات تُساعد البيانات التصنيفية في مهام التصنيف مثل التنبؤ بما إذا كان البريد الإلكتروني بريداً عشوائياً أم لا أو تحديد نوع الأغنية بناءً على كلماتها
:هناك نوعان فرعيان
البيانات الاسمية: لا يوجد ترتيب أو تسلسل هرمي بين الفئات، مثال: الألوان (أحمر، أزرق، أخضر)
البيانات الترتيبية: لها ترتيب ذو معنى لكن الفواصل بين الفئات غير متساوية ومثال على ذلك: مستويات الرضا (ضعيف – مقبول – جيد – ممتاز )
:البيانات الكمية (العددية)
يتعامل هذا النوع مع الأرقام والكميات القابلة للقياس
how many أو how much إذ يُجيب على سؤال
تُعزز البيانات الكمية نماذج الانحدار وتحليل الاتجاهات والتنبؤ بالسلاسل الزمنية
:تشمل الأنواع الفرعية
البيانات المنفصلة: قيم قابلة للعد وغالباً ما تكون أعداداً صحيحة، مثال: عدد الطلاب في الفصل •
البيانات المتصلة: قيم محتملة لا نهائية ضمن نطاق، مثال: الطول – الوزن – أو درجة الحرارة •
Advertisements
2. نظرة فاحصة: مقاييس القياس
بالإضافة إلى التصنيف الأساسي يمكن وصف البيانات أيضاً بناءً على مقياس قياسها والذي يُحدد كيفية تحليلها وتفسيرها إحصائياً
المقياس الاسمي
تصنيفي بحت بدون معنى رقمي، إذ يُستخدم للتجميع أو الوسم، مثال: فصيلة الدم أو لون العين
استخدامات علم البيانات: ترميز هذه المتغيرات (مثل الترميز الساخن) لنماذج التعلم الآلي
المقياس الترتيبي
فئات مرتبة ولكن بدون فرق قابل للقياس بين الرتب، مثال: تقييمات النجوم لمنتج (من 1 إلى 5 نجوم)
استخدامات علم البيانات: رائعة لتحليل الاستبيانات أو نماذج التصنيف وغالباً ما تُحوّل إلى أعداد صحيحة للخوارزميات
المقياس الفاصل
بيانات رقمية ذات فترات زمنية متساوية ولكن بدون نقطة صفر حقيقية، مثال: درجة الحرارة بالدرجة المئوية أو الفهرنهايت
استخدامات علم البيانات: شائعة في السلاسل الزمنية أو بيانات الاستشعار حيث تكون نقطة الصفر عشوائية
مقياس النسبة
أعلى مستوى لقياس البيانات بفترات زمنية متساوية ونقطة صفر حقيقية، مثال: الوزن – المسافة – الدخل
استخدامات علم البيانات: تُستخدم في النمذجة التنبؤية والانحدار ومهام التعلم العميق التي تتطلب علاقات رقمية دقيقة
3. لماذا تُعدّ أنواع البيانات مهمة جداً في علم البيانات
فهم أنواع البيانات يتجاوز مجرد نظرية أكاديمية فهو يُؤثر بشكل مباشر على كل قرار تتخذه كعالم بيانات
تنظيف البيانات: معرفة ما إذا كان يجب إدخال القيم المفقودة باستخدام المتوسط الحسابي (للبيانات المستمرة) أو المنوال (للبيانات الفئوية)
• هندسة الميزات: تحديد كيفية ترميز أو تحويل المتغيرات للخوارزميات
اختيار النموذج: تتعامل بعض الخوارزميات مع أنواع بيانات محددة بشكل أفضل (على سبيل المثال: تتعامل أشجار القرار مع البيانات الفئوية بشكل طبيعي) بدون تحديد أنواع بياناتك بشكل صحيح حتى أكثر النماذج تقدماً ستُضللك
٤. مثال واقعي:أنواع البيانات في مشروع علم بيانات
تخيل أنك تُحلل مجموعة بيانات حول مشتريات العملاء لشركة تجارة إلكترونية
:إليك كيفية ظهور أنواع البيانات المختلفة
Variable
Data Type
Example
Use Case
Customer ID
Nominal
C1023
Identifier
Gender
Nominal
Female
Segmentation
Age Group
Ordinal
18–25, 26–35
Market analysis
Purchase Amount
Ratio
120.50
Revenue modeling
Date of Purchase
Interval
2025-11-05
Trend analysis
Items Bought
Discrete
3
Purchase frequency
من خلال التصنيف الصحيح لهذه الأنواع من البيانات يمكنك إعداد البيانات بكفاءة لنماذج التعلم الآلي وتصوّر الرؤى بشكل صحيح واتخاذ قرارات عمل موثوقة
الخلاصة: سرّ علم بيانات أكثر ذكاءً يبدأ بأنواع البيانات
في عصر الذكاء الاصطناعي والأتمتة لا تزال مهارة فهم البيانات البشرية لا غنى عنها، فمعرفة ما إذا كان متغيرك اسمياً أم نسبياً قد يكون الفارق بين النجاح والنتائج المضللة، إذاً بصفتك عالم بيانات ابدأ دائماً بتصنيف البيانات قبل التحليل فهو الأساس الرصين لكل رؤية ثاقبة وتنبؤ دقيق
In a world where artificial intelligence (AI) is no longer a futuristic concept but an active force in business and technology the field of data science finds itself at a crossroads. On one hand there are exciting opportunities: new tools, higher salaries, increasing demand. On the other hand there are questions: will AI replace data scientists? Are the job roles shifting so fast that what you learn now may be outdated tomorrow? If you are building or advising a career in data science (or your work touches on this area) then understanding what is actually happening in the job market is critical. In this article I explore the real‑world trends for 2025 in the data science and AI job market: the demand, the shifts in roles and skills, the risks, and how you as a professional (or aspiring one) can position yourself.
1. What the Data Science + AI Job Market Looks Like Today
Demand is still strong but evolving
Numerous reports point to continued growth in data‑science and AI‑related roles. The job market for data scientists still expects around 21 000 new openings per year in the U.S. alone over the next decade.
Roles are shifting: specialization and infrastructure matter more
What is a “data scientist” nowadays is no longer the same as five years ago. Employers increasingly demand:
Strong machine‑learning/AI skills
Data engineering, MLOps and infrastructure skills become more prominent
Domain expertise (industry knowledge, ethical/AI governance) is a differentiator
Salary and compensation remain attractive
Salary data for data science/AI professionals show robust numbers. Many data science job postings in 2025 offer salaries in the $160 000‑$200 000 range in the U.S. In the AI segment salaries are slightly higher than standard data science roles.
AI is more complement than substitute (for now)
AI tends to augment high‑skill work more than it automates it away. Rather than viewing AI purely as a threat it is more accurate to see it as reshaping jobs and skill‑requirements.
2. Key Shifts You Should Be Aware Of
Entry‑level roles are harder to find
Though demand is robust overall the competition for entry‑level and “generalist” data science roles is becoming tougher. The share of postings for 0‑2 years of experience decreased and salaries increased for more experienced candidates.
The “data scientist unicorn” is fading
Employers are less often looking for one person to do everything (data wrangling, feature engineering, modeling, deployment, business translation). Instead roles are splitting into: data engineer, ML/AI engineer, analytics engineer, data product manager.
Skills are changing fast
Because AI and data roles evolve rapidly, the required skill‑set is shifting:
Classic languages like Python and SQL remain vital; SQL has overtaken R in many job listings
Deep learning, NLP, MLOps are growing in importance
Soft skills, domain knowledge, ethics and governance are becoming differentiators
Skill‑based hiring is growing: employers value demonstrable skills (certifications, portfolios) perhaps more than formal degrees in some cases
The role of AI in affecting jobs is nuanced
Although there is concern about AI leading to widespread job loss, most evidence suggests that for now AI is not causing huge mass layoffs in high‑skill data/AI roles. Still the impact may accelerate in coming years.
Advertisements
3. What This Means For Web Designers / Graphic Designers / Professionals (Like You)
Given your background in web design, motion graphics, brand identity etc your path may not be a classic “data scientist” role but the intersection of design, data and AI is very relevant. Here are some implications and opportunities:
Data‑driven design: More companies integrate analytics into design decisions. Knowing how to interpret data, dashboards, and link visuals to business outcomes can give you an edge.
Motion graphics + AI content: As you use tools like Adobe After Effects or Adobe Animate the rise of generative AI (GenAI) means you may collaborate with data/AI teams to visualise model outputs, dashboards, user workflows.
Upskilling counts: Even if you don’t become a data scientist you benefit from acquiring foundational data literacy—SQL basics, data visualisation tools, understanding ML workflows. These complement your design/brand skills and make you more versatile.
Branding AI capabilities: For your own services (web design, brand identity) you can offer value by saying “I understand how AI‑driven data flows affect UX” or “I can build dashboards with strong visual narrative”. That differentiates you.
Avoid entering a matured “commodity” space: Entry‑level data science is tougher. So if you pivot into data/AI you might target niches where your design/visualisation expertise is rare: e.g., AI ethics visualisations, UX for ML interfaces, dashboard storytelling, data‑driven branding.
In short: don’t wait for “data science job market explosion” to pass you by—position your existing strengths (design, visuals, motion) plus some data/AI fluency to ride the wave rather than be overtaken by it.
4. What to Do If You’re Considering or Already in the Field
Here’s a practical roadmap for moving forward smartly:
Audit your current skills
How comfortable are you with Python/SQL or data‑tools?
Do you understand basics of ML/AI workflows (model building, deployment) at a conceptual level?
How good are you at communicating insights visually and with business context?
Pick a niche or combine strengths
Because generalist “data scientist” roles are less common now you’ll stand out by combining two strengths: e.g., “motion graphics + ML interpretability” or “web UI for data pipelines”.
Consider roles such as analytics engineer, data visualisation specialist, design‑driven data product owner.
Upskill strategically
Focus on in‑demand skills: machine learning fundamentals; cloud/data engineering basics; MLOps; SQL; data visualisation tools
Also invest in “soft” but crucial skills: domain knowledge, communication, ethics, decision‑making
Consider a portfolio of projects rather than only relying on formal degrees (skill‑based hiring is rising)
Stay adaptable and alert to shifts
The job market changes: roles will evolve as AI becomes more embedded
Entry‑level may stay competitive; experience + unique combo of skills will help
Keep your design/visual skills sharp—they will remain valuable even when AI changes some technical roles
5. Conclusion & Call to Interaction
In summary: the job market for data science and AI remains strong but changing. It is less about “will there be jobs” and more about “what kind of jobs, and with what skills”. For those able to combine technical fluency with domain, design, communication and flexibility the opportunities are excellent. For those expecting a straightforward path without continuous learning the environment will be competitive.
If I may invite you: – Comment below with your own perspective: have you seen data/AI roles advertised in your region recently? What skills did they ask for? – Consider writing a short list of three new skills you are willing to add this year to stay relevant in this shifting landscape.
Advertisements
دور الذكاء الاصطناعي في إعادة تشكيل مسارات علوم البيانات
Advertisements
في عالمٍ لم يعد فيه الذكاء الاصطناعي مفهوماً مستقبلياً بل قوةً فاعلةً في عالم الأعمال والتكنولوجيا، إذ يجد مجال علم البيانات نفسه عند مفترق طرق فمن ناحية ثمة فرصٌ واعدة: أدوات جديدة ورواتب أعلى وطلب متزايد، ومن ناحية أخرى ثمة تساؤلاتٌ : هل سيحل الذكاء الاصطناعي محل علماء البيانات وهل تتغير الأدوار الوظيفية بسرعةٍ كبيرةٍ لدرجة أن ما تتعلمه الآن قد يصبح قديماً غداً إذا كنتَ تبني أو تُقدّم المشورة المهنية في مجال علم البيانات (أو إذا كان عملك يتطرق إلى هذا المجال) فإن فهم ما يحدث فعلياً في سوق العمل أمرٌ بالغ الأهمية
في هذه المقالة أستكشف اتجاهات سوق العمل في مجال علم البيانات والذكاء الاصطناعي لعام 2025: الطلب والتحولات في الأدوار والمهارات والمخاطر وكيف يمكنكَ كمحترف (أو كطامح) تحديد وضعك المهني
1. كيف يبدو سوق عمل علم البيانات والذكاء الاصطناعي اليوم
لا يزال الطلب قوياً ولكنه في تطور
تشير العديد من التقارير إلى استمرار النمو في الأدوار المتعلقة بعلم البيانات والذكاء الاصطناعي، إذ لا يزال سوق العمل لعلماء البيانات يتوقع حوالي 21,000 وظيفة جديدة سنوياً في الولايات المتحدة وحدها على مدار العقد المقبل
الأدوار تتغير: التخصص والبنية التحتية أكثر أهمية
:لم يعد مفهوم “عالِم البيانات” اليوم كما كان قبل خمس سنوات، إذ يطلب أصحاب العمل بشكل متزايد
مهارات قوية في التعلم الآلي/الذكاء الاصطناعي •
أصبحت مهارات هندسة البيانات •
(MLOps) وعمليات إدارة العمليات الرئيسية
والبنية التحتية أكثر بروزاً
تُعدّ الخبرة في المجال (المعرفة بالقطاع والحوكمة الأخلاقية/حوكمة الذكاء الاصطناعي) عاملاً مميزاً •
لا تزال الرواتب والتعويضات مغرية
تُظهر بيانات الرواتب لمتخصصي علوم البيانات / الذكاء الاصطناعي أرقاماً قوية، بحيث تُقدّم العديد من إعلانات وظائف علوم البيانات في عام 2025 رواتب تتراوح بين 160,000 و200,000 دولار أمريكي في الولايات المتحدة، وفي قطاع الذكاء الاصطناعي تكون الرواتب أعلى قليلاً من وظائف علوم البيانات القياسية
يعتبر الذكاء الاصطناعي مكملاً أكثر منه بديلاً (في الوقت الحالي)
يميل الذكاء الاصطناعي إلى تعزيز العمل الذي يتطلب مهارات عالية أكثر من أتمتته، فبدلاً من النظر إلى الذكاء الاصطناعي كتهديد فحسب من الأدق النظر إليه على أنه يُعيد تشكيل الوظائف ومتطلبات المهارات
2. التحولات الرئيسية التي يجب أن تكون على دراية بها
أصبحت وظائف المستوى المبتدئ أكثر صعوبة
على الرغم من قوة الطلب بشكل عام إلا أن المنافسة على وظائف المستوى المبتدئ ووظائف علوم البيانات “العامة” تزداد صعوبة، إذ انخفضت نسبة الوظائف الشاغرة لخبرة سنتين أو ثلاث سنوات وارتفعت رواتب المرشحين الأكثر خبرة
عالِم البيانات الطموح يتلاشى
أصبح أصحاب العمل يبحثون بشكل أقل عن شخص واحد للقيام بكل شيء (معالجة البيانات وهندسة الميزات والنمذجة والنشر وترجمة الأعمال)، وبدلاً من ذلك تنقسم الأدوار إلى: مهندس بيانات ومهندس تعلّم آلي/ذكاء اصطناعي ومهندس تحليلات ومدير منتجات بيانات
المهارات تتغير بسرعة
:نظراً للتطور السريع لأدوار الذكاء الاصطناعي والبيانات فإن مجموعة المهارات المطلوبة تتغير
حيوية SQL لا تزال اللغات الكلاسيكية مثل بايثون و •
في العديد من قوائم الوظائف R على لغة SQL تفوقت لغة
(NLP) تتزايد أهمية التعلم العميق ومعالجة اللغة الطبيعية •
(MLOps) وعمليات إدارة قواعد البيانات
أصبحت المهارات الشخصية والمعرفة بالمجال والأخلاقيات والحوكمة عوامل تميز •
يتزايد التوظيف القائم على المهارات: إذ يُقدّر أصحاب العمل المهارات القابلة للإثبات (الشهادات وحافظات الأعمال) ربما أكثر من الشهادات الرسمية في بعض الحالات
دور الذكاء الاصطناعي في التأثير على الوظائف دقيق •
على الرغم من وجود مخاوف من أن يؤدي الذكاء الاصطناعي إلى فقدان وظائف على نطاق واسع تشير معظم الأدلة إلى أنه حتى الآن لا يُسبب الذكاء الاصطناعي تسريحات جماعية ضخمة في وظائف البيانات / الذكاء الاصطناعي عالية المهارات، ومع ذلك قد يتسارع هذا التأثير في السنوات القادمة
Advertisements
: ٣. ماذا يعني هذا لمصممي الويب / مصممي الجرافيك / المحترفين
نظراً لخلفيتك في تصميم الويب والرسوم المتحركة وهوية العلامة التجارية وما إلى ذلك قد لا يكون مسارك المهني منصباً تقليدياً في مجال “عالم البيانات” ولكن تقاطع التصميم والبيانات والذكاء الاصطناعي بالغ الأهمية
: فلتناول بعض التداعيات والفرص
التصميم الموجه بالبيانات: تُدمج المزيد من الشركات التحليلات في قرارات التصميم، إن معرفة كيفية تفسير البيانات ولوحات المعلومات وربط العناصر المرئية بنتائج الأعمال يمكن أن يمنحك ميزة تنافسية
:محتوى الرسوم المتحركة والذكاء الاصطناعي
مع استخدامك لأدوات مثل
Adobe Animate أو Adobe After Effects
(GenAI) فإن صعود الذكاء الاصطناعي التوليدي
يعني أنه يمكنك التعاون مع فرق البيانات / الذكاء الاصطناعي لتصور مخرجات النماذج ولوحات المعلومات وسير عمل المستخدم
تحسين المهارات أمر بالغ الأهمية: حتى لو لم تصبح عالم بيانات فإنك تستفيد
SQL من اكتساب معرفة أساسية بالبيانات – أساسيات
وأدوات تصور البيانات، وفهم سير عمل التعلم الآلي. هذه المهارات تُكمل مهاراتك في التصميم/العلامة التجارية وتجعلك أكثر تنوعاً
: قدرات بناء العلامة التجارية بالذكاء الاصطناعي
بالنسبة لخدماتك الخاصة (تصميم المواقع وهوية العلامة التجارية) يمكنك تقديم قيمة بقولك “أفهم كيف تؤثر تدفقات البيانات المدعومة بالذكاء الاصطناعي على تجربة المستخدم” أو “يمكنني بناء لوحات معلومات بسرد بصري قوي” هذا ما يميزك
: تجنب دخول مجال “السلع” المزدهر
يعتبر علم البيانات للمبتدئين أصعب، لذلك إذا انتقلت إلى مجال البيانات / الذكاء الاصطناعي فقد تستهدف مجالات تكون فيها خبرتك في التصميم / التصور نادرة: على سبيل المثال تصورات أخلاقيات الذكاء الاصطناعي وتجربة المستخدم لواجهات التعلم الآلي وسرد القصص على لوحات المعلومات وبناء العلامة التجارية المدعومة بالبيانات
باختصار: لا تنتظر “انفجار سوق العمل في علم البيانات” حتى يتجاوزك – ضع نقاط قوتك الحالية (التصميم أو المرئيات أو الحركة) بالإضافة إلى بعض إتقان البيانات / الذكاء الاصطناعي لركوب الموجة بدلاً من تجاوزها
4. ماذا تفعل إذا كنت تفكر في هذا المجال أو تعمل فيه بالفعل
:إليك خارطة طريق عملية للمضي قدماً بذكاء
1. راجع مهاراتك الحالية
أو أدوات البيانات SQL /ما مدى معرفتك بلغة بايثون
هل تفهم أساسيات سير عمل التعلم الآلي / الذكاء الاصطناعي (بناء النماذج، النشر) على المستوى المفاهيمي
ما مدى مهارتك في توصيل الأفكار بصرياً وفي سياق العمل
2. اختر تخصصاً أو اجمع نقاط قوتك
• نظراً لأن أدوار “عالم البيانات” العامة أقل شيوعاً الآن ستتميز من خلال الجمع بين نقطتي قوة: على سبيل المثال “رسومات متحركة + قابلية تفسير التعلم الآلي” أو “واجهة مستخدم ويب لخطوط أنابيب البيانات”
• فكر في أدوار مثل مهندس تحليلات أو أخصائي تصور البيانات أو مالك منتج بيانات قائم على التصميم
3. طوّر مهاراتك استراتيجياً
ركز على المهارات المطلوبة: أساسيات التعلم الآلي
أدوات تصور البيانات – SQL – MLOps أو أساسيات هندسة السحابة / البيانات
استثمر أيضاً في المهارات “الشخصية” ولكن الأساسية : المعرفة بالمجال والتواصل والأخلاق واتخاذ القرارات
فكّر في محفظة مشاريع بدلاً من الاعتماد فقط على الشهادات الرسمية (التوظيف القائم على المهارات في ازدياد)
4. كن متكيفاً ومتيقظاً للتحولات
سوق العمل في تغير مستمر: ستتطور الأدوار مع تزايد إدماج الذكاء الاصطناعي
قد يبقى مستوى المبتدئين تنافسياً : الخبرة + مزيج فريد من المهارات سيساعد
حافظ على مهاراتك في التصميم / التصوير – ستظل قيّمة حتى عندما يغير الذكاء الاصطناعي بعض الأدوار التقنية
5. الخاتمة والدعوة للتفاعل
باختصار: لا يزال سوق العمل في مجال علوم البيانات والذكاء الاصطناعي قوياً ولكنه متغير، فالأمر لا يتعلق بـ “هل ستكون هناك وظائف” بقدر ما يتعلق بـ “ما نوع الوظائف، وبأي مهارات”؟ بالنسبة لأولئك القادرين على الجمع بين الطلاقة التقنية والمجال والتصميم والتواصل والمرونة فإن الفرص ممتازة، أما بالنسبة لأولئك الذين يتوقعون مساراً مباشراً دون تعلم مستمر فستكون البيئة تنافسية
: دعوة للحوار
علّق أدناه برأيك: هل رأيت وظائف في مجال البيانات / الذكاء الاصطناعي معلنة في منطقتك مؤخراً ما المهارات المطلوبة
فكر في كتابة قائمة قصيرة بثلاث مهارات جديدة ترغب في إضافتها هذا العام لتظل ذا صلة بهذا المشهد المتغير
In a world that never stops generating tasks, automation is not just a luxury — it’s a necessity. Python has become the language of choice for people who want to make their computers work for them. It allows anyone, whether a beginner or an experienced developer, to automate daily routines, streamline workflows, and create elegant tools that simplify life. What’s more inspiring is that most of these automations can be built in just a weekend, giving you practical results and immediate satisfaction. In this article, we’ll explore eight real-world automation projects that combine creativity, simplicity, and powerful results. Each project includes a detailed explanation and working code, ready to run and expand.
1. File Organizer: Cleaning Your Digital Mess
Let’s be honest — everyone’s Downloads folder looks like a battlefield. PDFs, images, ZIP archives, and installers all live together in digital chaos. A File Organizer is one of the simplest yet most satisfying automation scripts you can build. It scans a target folder, detects the file extensions, creates categorized subfolders, and moves each file into its proper place. This saves time, reduces clutter, and gives your workspace a touch of order.
Beyond personal use, such automation can be scaled for offices to organize report folders, designers to manage creative assets, or photographers to sort by file type. It’s the foundation of file automation — understanding how to navigate directories, classify files, and manipulate them programmatically.
This script can be adapted to group by date, size, or even project names — the perfect first step toward smarter digital management.
2. Auto Email Sender: No More Repetitive Mail Work
Every professional has at least one recurring email to send: reports, invoices, weekly updates, or newsletters. Manually sending them every week is a waste of time. That’s where an Auto Email Sender steps in. Using Python’s smtplib and email libraries, you can compose and send messages automatically, even with attachments. You can integrate it with your reporting scripts to send data automatically at the end of each process.
This project teaches you about SMTP protocols, secure authentication, and automating digital communication. It also helps you understand how businesses automate entire email flows using scripts or scheduled tasks. You can later add personalization and dynamic content fetched from spreadsheets or databases.
Set it on a scheduler, and you’ve got yourself an email assistant who never forgets or gets tired.
3. WhatsApp Message Bot: Smart Communication Made Easy
Imagine sending birthday wishes, reminders, or meeting alerts without lifting a finger. With the pywhatkit library, Python can automate WhatsApp messages right from your desktop. You define the message, the recipient, and the exact time — and the bot does the rest.
This project introduces you to simple automation that interacts with web applications through browser control. It’s particularly useful for small businesses or freelancers who manage multiple clients and want to send personalized yet automated updates. It’s also a gentle entry into browser-driven automation and time scheduling.
Once you see your computer send that message without your input, you’ll feel the real satisfaction of automation.
4. Web Scraper: Collect Data While You Sleep
Web scraping is the heart of data automation — a way to collect information automatically from websites without manual copy-paste work. Whether it’s scraping job listings, product prices, or blog titles, Python’s BeautifulSoup and requests libraries make the process simple and powerful.
A Web Scraper can become part of many real-world systems — price tracking bots, research tools, or content aggregators. It introduces you to the HTML structure of websites and teaches you how to extract meaningful patterns. It’s also an excellent first step toward data analytics, since most analysis begins with data collection.
Once you’ve mastered this, you can expand it to scrape multiple pages, store data in CSV files, and even monitor changes over time.
Advertisements
5. Bulk File Renamer: Perfect Naming Every Time
If you’ve ever had to rename hundreds of files — like photos, documents, or reports — you know the pain. The Bulk File Renamer eliminates that pain instantly. By looping through files in a folder, you can rename them with a consistent pattern, making them searchable and organized.
This project is particularly helpful for creative professionals, teachers, or office administrators. It introduces iteration and string formatting while giving immediate practical benefits.
After you run it, your files will instantly follow a perfect naming convention — a simple yet satisfying reward for your Python skills.
6. Desktop Notification App: Keep Yourself on Track
Modern life is full of distractions, and sometimes the simplest automation can bring balance. A Desktop Notification App is one of those. You can make Python send you notifications — like reminding you to stretch, hydrate, or check an important site. The plyer library makes it surprisingly easy.
This project is not just about productivity; it teaches you how applications communicate with your operating system and how automation can serve human well-being, not just efficiency.
You can even connect it to other scripts to notify you when a background task finishes or when a website updates.
7. Excel Automation: Reports That Build Themselves
If your work involves data or reporting, Excel Automation is a game changer. Instead of manually updating sheets, you can use Python’s OpenPyXL library to fill in data, apply formulas, and save formatted Excel reports automatically.
This automation is especially powerful for analysts, accountants, teachers, or managers who regularly produce structured reports. It introduces concepts of data manipulation, file writing, and office integration — all essential skills for business automation.
Once you understand this foundation, you can automate monthly reports, combine multiple data sources, or even generate charts directly from Python.
8. Web Automation Bot: The Gateway to Advanced Automation
Finally, the Web Automation Bot. This is where automation meets intelligence. With Selenium, you can control a real browser — open websites, log in, click buttons, and extract information — just like a human would. It’s used in automated testing, social media bots, and even e-commerce monitoring tools.
This project teaches browser control, DOM manipulation, and event simulation. It’s a more advanced automation, but once you build it, you’ll see how close you are to creating full-scale automation systems.
From here, you can scale up to automate entire workflows — logging into dashboards, downloading reports, or posting updates online.
Conclusion
Each of these projects represents a small window into a much larger world — the world of automation-driven thinking. What makes them valuable isn’t just the code but the mindset they build: the idea that every repetitive task can be transformed into a system that runs on its own. Once you start building these automations, you begin to see possibilities everywhere — from your desktop to your business processes. So, take this weekend to experiment, learn, and enjoy the moment when your computer starts working for you instead of the other way around.
Advertisements
ثمانية مشاريع أتمتة بايثون عملية لإتقانها في 48 ساعة
Advertisements
في عالمٍ لا يتوقف فيه توليد المهام لم تعد الأتمتة مجرد ترف بل ضرورة، إذ أصبحت بايثون اللغة المفضلة لمن يرغبون في تشغيل حواسيبهم فهي تتيح لأي شخص أتمتة روتينه اليومي وتبسيط سير العمل وإنشاء أدوات أنيقة تُبسط الحياة سواءً كان مبتدئاً أو مطوراً خبيراً، والأمر الأكثر إلهاماً هو إمكانية بناء معظم هذه الأتمتة في عطلة نهاية أسبوع واحدة فقط أي خلال 48 ساعة مما يمنحك نتائج عملية ورضا فورياً
وفي هذه المقالة سنستكشف ثمانية مشاريع أتمتة عملية تجمع بين الإبداع والبساطة والنتائج الفعّالة، بحيث يتضمن كل مشروع شرحاً مفصلاً وشيفرة برمجية جاهزة للتشغيل والتوسع
1. منظم الملفات: تنظيم الفوضى الرقمية
لنكن صريحين – يبدو مجلد التنزيلات لدى الجميع أشبه بساحة معركة
وملفات التثبيت ZIP والصور وملفات PDF فملفات
كلها تعيش معاً في فوضى رقمية، فمُنظّم الملفات يعدُّ أحد أبسط نصوص الأتمتة وأكثرها إرضاءً على الإطلاق فهو يفحص المجلد المُستهدف ويكتشف امتدادات الملفات ويُنشئ مجلدات فرعية مُصنّفة وينقل كل ملف إلى مكانه المُناسب، هذا يُوفّر الوقت ويُقلّل الفوضى ويُضفي على مساحة عملك لمسةً من التنظيم، وبعيداً عن الاستخدام الشخصي يُمكن توسيع نطاق هذه الأتمتة لتشمل المكاتب لتنظيم مجلدات التقارير وللمصممين لإدارة الأصول الإبداعية وللمصورين للفرز حسب نوع الملف، إنه أساس أتمتة الملفات – فهم كيفية التنقل بين المجلدات وتصنيف الملفات ومعالجتها برمجياً
يمكن تعديل هذا النص البرمجي للتجميع حسب التاريخ أو الحجم أو حتى أسماء المشاريع، وهي الخطوة الأولى المثالية نحو إدارة رقمية أكثر ذكاءً
2. مُرسِل البريد الإلكتروني التلقائي: لا مزيد من العمل البريدي المُكرّر
يُرسل كل مُحترف بريداً إلكترونياً واحداً على الأقل بشكل مُتكرر: تقارير، فواتير، تحديثات أسبوعية، أو رسائل إخبارية، فإرسالها يدوياً كل أسبوع مُضيعة للوقت، هنا يأتي دور مُرسِل البريد الإلكتروني التلقائي
والبريد الإلكتروني في بايثون smtplib فباستخدام مكتبات
يمكنك إنشاء الرسائل وإرسالها تلقائياً حتى مع المرفقات يمكنك دمجه مع نصوص التقارير لإرسال البيانات تلقائياً في نهاية كل عملية
والمصادقة الآمنة SMTP يُعلّمك هذا المشروع بروتوكولات
وأتمتة الاتصالات الرقمية، كما يُساعدك على فهم كيفية أتمتة الشركات لتدفقات البريد الإلكتروني بالكامل باستخدام النصوص أو المهام المجدولة، يمكنك لاحقاً إضافة محتوى مُخصص وديناميكي من جداول البيانات أو قواعد البيانات
باستخدام مُجدول ستحصل على مُساعد بريد إلكتروني لا ينسى ولا يتعب أبداً
3. بوت رسائل واتساب: تواصل ذكي سهل
تخيل إرسال تهنئة عيد ميلاد أو تذكيرات أو تنبيهات اجتماعات دون أي عناء
يُمكن لبايثون أتمتة رسائل واتساب مُباشرةً من سطح مكتبك pywhatkit فمع مكتبة
ما عليك سوى تحديد الرسالة والمُستلِم والوقت المُحدد – وسيتولى البوت الباقي، يُعرّفك هذا المشروع على أتمتة بسيطة تتفاعل مع تطبيقات الويب من خلال التحكم في المتصفح وهو مفيد بشكل خاص للشركات الصغيرة أو المستقلين الذين يديرون عملاء متعددين ويرغبون في إرسال تحديثات مخصصة وتلقائية في آنٍ واحد، كما أنه يُمثل مدخلاً سهلاً إلى الأتمتة المُدارة من خلال المتصفح وجدولة الوقت
بمجرد أن ترى جهاز الكمبيوتر الخاص بك يُرسل تلك الرسالة دون تدخل منك ستشعر بالرضا الحقيقي عن الأتمتة
4. كشط البيانات من الويب: اجمع البيانات أثناء نومك
يُعدّ كشط البيانات من الويب جوهر أتمتة البيانات، فهو طريقة لجمع المعلومات تلقائياً من مواقع الويب دون الحاجة إلى النسخ واللصق اليدوي، فسواءً كان الأمر يتعلق بكشط قوائم الوظائف أو أسعار المنتجات أو عناوين المدونات
ومكتبات الطلبات في بايثون BeautifulSoup فإن مكتبة
تجعل العملية بسيطة وفعالة، يمكن أن يُصبح كشط البيانات من الويب جزءاً من العديد من الأنظمة العملية مثل روبوتات تتبع الأسعار وأدوات البحث أو مُجمّعات المحتوى
لمواقع الويب HTML يُعرّفك على بنية
ويُعلّمك كيفية استخراج أنماط ذات معنى، كما أنه خطوة أولى ممتازة نحو تحليلات البيانات حيث تبدأ معظم التحليلات بجمع البيانات
بمجرد إتقان هذه الميزة يمكنك توسيعها لاستخراج صفحات متعددة وتخزين البيانات في ملفات CSV وحتى مراقبة التغييرات مع مرور الوقت
Advertisements
٥. إعادة تسمية الملفات المجمعة: تسمية مثالية في كل مرة
إذا سبق لك أن اضطررت لإعادة تسمية مئات الملفات ( مثل الصور أو المستندات أو التقارير ) فمهمتك مرهقة وصعبة للغاية، تُزيل أداة إعادة تسمية الملفات المجمعة هذه الصعوبة فوراً، فمن خلال تكرار الملفات في مجلد يمكنك إعادة تسميتها بنمط متسق مما يجعلها قابلة للبحث ومنظمة، هذا المشروع مفيد بشكل خاص للمحترفين المبدعين والمعلمين ومسؤولي المكاتب فهو يُقدم التكرار وتنسيق السلاسل النصية مع توفير فوائد عملية فورية
بعد تشغيله ستتبع ملفاتك فوراً اصطلاح تسمية مثالي – مكافأة بسيطة ولكنها مُرضية لمهاراتك في بايثون
٦. تطبيق إشعارات سطح المكتب: حافظ على تركيزك
الحياة العصرية مليئة بالمشتتات وأحياناً تُحقق أبسط الأتمتة التوازن، تطبيق إشعارات سطح المكتب هو أحد هذه التطبيقات، إذ يمكنك جعل بايثون يرسل لك إشعارات مثل تذكيرك بالتمدد أو شرب الماء أو زيارة موقع مهم، مساعدك المذهل في هذه العملية
فهي تُسهّل الأمر بشكل رائع Plyer هو مكتبة
لا يقتصر هذا المشروع على الإنتاجية فحسب؛ بل يُعلّمك كيفية تواصل التطبيقات مع نظام التشغيل لديك وكيف يُمكن للأتمتة أن تُعزز رفاهية الإنسان وليس الكفاءة فحسب
يمكنك أيضاً ربطه ببرامج نصية أخرى لإعلامك عند انتهاء مهمة خلفية أو عند تحديث موقع ويب
٧. أتمتة إكسل: تقارير تُبنى ذاتياً
إذا كان عملك يتضمن بيانات أو تقارير فإن أتمتة إكسل تُحدث نقلة نوعية، فبدلاً من تحديث جداول البيانات يدوياً
من بايثون OpenPyXL يُمكنك استخدام مكتبة
لملء البيانات وتطبيق الصيغ وحفظ تقارير إكسل المُنسّقة تلقائياً
هذه الأتمتة فعّالة بشكل خاص للمحللين والمحاسبين والمعلمين والمديرين الذين يُصدرون تقارير مُهيكلة بانتظام، إذ يُقدّم هذا الكتاب مفاهيم معالجة البيانات وكتابة الملفات وتكامل المكاتب – وهي مهارات أساسية لأتمتة الأعمال
بمجرد فهمك لهذه الأساسيات يمكنك أتمتة التقارير الشهرية ودمج مصادر بيانات متعددة أو حتى إنشاء مخططات بيانية مباشرةً من بايثون
8. بوت أتمتة الويب: بوابة الأتمتة المتقدمة
وأخيراً بوت أتمتة الويب وهنا تلتقي الأتمتة بالذكاء، فمع سيلينيوم يمكنك التحكم في متصفح حقيقي – فتح مواقع الويب وتسجيل الدخول والنقر على الأزرار واستخراج المعلومات – تماماً كما يفعل الإنسان، يُستخدم في الاختبارات الآلية وروبوتات وسائل التواصل الاجتماعي وحتى أدوات مراقبة التجارة الإلكترونية
يُعلّم هذا المشروع التحكم في المتصفح
ومحاكاة الأحداث (DOM) ومعالجة نماذج الكائنات
إنه أتمتة أكثر تقدماً ولكن بمجرد إنشائه ستدرك مدى قربك من إنشاء أنظمة أتمتة شاملة
من هنا يمكنك التوسع لأتمتة سير العمل بالكامل – تسجيل الدخول إلى لوحات المعلومات وتنزيل التقارير أو نشر التحديثات عبر الإنترنت
الخلاصة
يُمثل كلٌّ من هذه المشاريع نافذةً صغيرةً على عالمٍ أوسع بكثير – عالم التفكير المُدار بالأتمتة، ما يجعلها قيّمةً ليس فقط الكود بل العقلية التي تُكوّنها: فكرة أن كل مهمةٍ متكررةٍ يمكن تحويلها إلى نظامٍ يعملُ تلقائياً، فبمجرد البدء في بناء هذه الأتمتة ستبدأ برؤية الإمكانيات في كل مكان – من سطح المكتب إلى عمليات عملك، لذا استغل عطلة نهاية الأسبوع هذه للتجربة والتعلم والاستمتاع باللحظة التي يبدأ فيها جهاز الكمبيوتر بالعمل لصالحك بدلاً من العكس
There was a time when data engineers were the silent backbone of the digital world. They built invisible pipelines that powered analytics dashboards and business decisions while their work lived quietly in the background. Yet as we step into 2025, a powerful shift has begun. The era of artificial intelligence has changed everything. The same engineers who once shaped data flows are now shaping intelligence itself. The walls between data engineering and AI engineering are collapsing, giving birth to a new kind of professional — one who does not just move data but gives it meaning, logic, and life.
The Evolution of Data Engineering
For years data engineers were defined by the pipeline. Their mission was to extract, transform, and load massive amounts of data with precision. They were masters of efficiency and reliability since business intelligence depended on their craft. But as AI systems began to demand cleaner, smarter, and more contextual data, the traditional boundaries of their work started to blur. Data was no longer a static resource stored in warehouses. It became dynamic and intelligent, ready to be consumed by models that learn and adapt.
This transformation forced data engineers to rethink their purpose. They began to explore new languages, frameworks, and architectures that serve the needs of AI systems rather than just reports. The rise of feature stores, real-time data pipelines, and model-ready datasets became a natural evolution. What was once a backend support role is now a creative and strategic discipline deeply embedded in the core of AI development.
The Convergence of Data and Intelligence
In 2025 the distance between data and intelligence has nearly vanished. Companies realized that no AI model can thrive without a strong data foundation, and no data pipeline is meaningful unless it serves intelligent systems. This convergence turned data engineers into AI engineers almost by necessity. They are now the architects who design the flow of information that feeds neural networks, fine-tunes machine learning algorithms, and maintains the ethical integrity of data usage.
Instead of stopping at ETL processes, data engineers are now involved in designing feedback loops that help models learn from real-world behavior. They collaborate with machine learning experts to ensure that data quality aligns with algorithmic precision. They implement data observability tools that detect drift and bias. In short, they became the silent partners of artificial intelligence, merging data logic with machine cognition.
Advertisements
The Skills Defining the New AI Engineer
The modern AI engineer who once began as a data engineer no longer lives in a world of static scripts. He navigates dynamic ecosystems filled with streaming data, distributed architectures, and intelligent agents. Python and SQL remain essential, but so do TensorFlow, PyTorch, and MLOps tools. Understanding how to automate model deployment, monitor data pipelines, and handle ethical AI constraints has become part of their daily routine.
They have become fluent in the language of AI systems while never forgetting their roots in data infrastructure. Their expertise bridges two worlds — one of data reliability and another of model intelligence. The result is a new generation of engineers who see data as a living entity that must be nurtured, protected, and taught to think.
The Industry Demand and the Rise of Hybrid Roles
In 2025, technology companies are no longer hiring data engineers and AI engineers as separate positions. Instead, they are creating hybrid roles that demand deep data expertise combined with applied AI knowledge. Startups and enterprises alike seek professionals who can both build a data platform and deploy a model on top of it. This merging of skill sets has reshaped hiring patterns across industries from finance to healthcare to manufacturing.
Businesses now understand that the journey from raw data to intelligent decision-making must be seamless. The engineer who can handle that entire journey becomes priceless. They are not just developers anymore but system thinkers who shape the DNA of digital intelligence.
What This Means for the Future
The rise of AI engineers from the roots of data engineering tells a larger story about how technology evolves. Each generation of innovation absorbs the one before it. Just as web developers became full-stack engineers, data engineers are becoming full-intelligence engineers. The future belongs to those who understand both the flow of information and the architecture of intelligence.
This shift will not slow down. Automation tools will make traditional data work easier, but the demand for human insight will grow. The world will need engineers who can blend structure with creativity, logic with vision, and pipelines with perception. And that is precisely what this new wave of AI engineers represents — a bridge between the mechanical and the meaningful.
Conclusion
As we look ahead to the years beyond 2025, the title “data engineer” may fade, but its spirit will remain stronger than ever. The professionals who once built data pipelines are now shaping the veins of artificial intelligence. Their role is no longer about moving information but about awakening it. They have become the builders of intelligent systems that not only process data but understand it. The silent era of engineering has ended, and a new one has begun — where data engineers have become AI engineers, and intelligence is no longer a dream but a craft.
Advertisements
كيف يُعيد مهندسو البيانات رسم مستقبلهم في عصر الذكاء الاصطناعي
Advertisements
كان مهندسو البيانات في الماضي العمود الفقري الصامت للعالم الرقمي، فقد بنوا قنوات اتصال غير مرئية تُشغّل لوحات معلومات التحليلات وقرارات الأعمال بينما كان عملهم يُدار بهدوء في الخلفية، ومع حلول عام 2025 بدأ تحول جذري، إذ قد غيّر عصر الذكاء الاصطناعي كل شيء فالمهندسون أنفسهم الذين شكّلوا تدفقات البيانات يُشكّلون الآن الذكاء الاصطناعي نفسه، ومن الملاحظ أن الحواجز بين هندسة البيانات وهندسة الذكاء الاصطناعي بدأت تنهار، مما يُمهّد الطريق لظهور نوع جديد من المهنيين – مهني لا يكتفي بنقل البيانات فحسب بل يُضفي عليها معنىً ومنطقاً وحياة
تطور هندسة البيانات
لسنوات كان مهندسو البيانات يُعرّفون بقنوات الاتصال، إذ كانت مهمتهم استخراج كميات هائلة من البيانات وتحويلها وتحميلها بدقة، وكانوا بارعين في الكفاءة والموثوقية لأن ذكاء الأعمال يعتمد على حرفتهم، ولكن مع تزايد طلب أنظمة الذكاء الاصطناعي على بيانات أنظف وأذكى وأكثر ارتباطاً بالسياق فبدأت الحدود التقليدية لعملهم تتلاشى، ولم تعد البيانات مورداً ثابتاً مُخزّناً في المستودعات بل أصبحت البيانات ديناميكية وذكية وجاهزة للاستخدام من قبل النماذج التي تتعلم وتتكيف
أجبر هذا التحول مهندسي البيانات على إعادة التفكير في أهدافهم فبدأوا في استكشاف لغات وأطر عمل وهياكل جديدة تلبي احتياجات أنظمة الذكاء الاصطناعي بدلاً من مجرد التقارير، وأصبح ظهور مخازن الميزات وخطوط أنابيب البيانات الفورية ومجموعات البيانات الجاهزة للنماذج تطوراً طبيعياً وما كان في السابق دور دعم خلفي أصبح الآن تخصصاً إبداعياً واستراتيجياً متأصلاً بعمق في جوهر تطوير الذكاء الاصطناعي
التقاء البيانات والذكاء
في عام 2025 تلاشت تقريباً الفجوة بين البيانات والذكاء، إذ أدركت الشركات أنه لا يمكن لأي نموذج ذكاء اصطناعي أن يزدهر بدون أساس متين من البيانات ولا جدوى لأي خط أنابيب بيانات إلا إذا خدم الأنظمة الذكية، فحوّل هذا التقارب مهندسي البيانات إلى مهندسي ذكاء اصطناعي بحكم الضرورة، وهم الآن المهندسون الذين يصممون تدفق المعلومات الذي يغذي الشبكات العصبية ويضبط خوارزميات التعلم الآلي ويحافظ على النزاهة الأخلاقية لاستخدام البيانات
بدلاً من التوقف عند عمليات استخراج وتحويل وتحميل البيانات يشارك مهندسو البيانات الآن في تصميم حلقات التغذية الراجعة التي تساعد النماذج على التعلم من السلوك الواقعي، فيتعاونون مع خبراء التعلم الآلي لضمان توافق جودة البيانات مع دقة الخوارزميات ويطبقون أدوات مراقبة البيانات التي تكشف عن الانحراف والتحيز، إذاً باختصار أصبحوا بمثابة شركاء صامتين للذكاء الاصطناعي يدمجون منطق البيانات مع الإدراك الآلي
المهارات التي تُحدد مهندس الذكاء الاصطناعي الجديد
لم يعد مهندس الذكاء الاصطناعي الحديث الذي بدأ كمهندس بيانات يعيش في عالم البرامج النصية الثابتة، فهو يتنقل بين أنظمة بيئية ديناميكية مليئة ببيانات متدفقة وبنى موزعة ووكلاء أذكياء
أساسيتين SQL إذ لا تزال بايثون و
TensorFlow و PyTorch و MLOps وكذلك أدوات
وعليه أصبح فهم كيفية أتمتة نشر النماذج ومراقبة خطوط أنابيب البيانات والتعامل مع قيود الذكاء الاصطناعي الأخلاقية جزءاً من روتينهم اليومي
أصبحوا بارعين في لغة أنظمة الذكاء الاصطناعي مع الحفاظ على جذورهم في البنية التحتية للبيانات، بحيث تربط خبرتهم بين عالمين أحدهما موثوقية البيانات والآخر ذكاء النماذج، والنتيجة هي جيل جديد من المهندسين الذين يرون البيانات ككيان حي يجب رعايته وحمايته وتعليمه التفكير
Advertisements
الطلب الصناعي وظهور الأدوار الهجينة
في عام 2025 لم تعد شركات التكنولوجيا تُوظّف مهندسي البيانات ومهندسي الذكاء الاصطناعي كمناصب منفصلة بل إنها تُنشئ أدواراً هجينة تتطلب خبرةً عميقةً في البيانات إلى جانب معرفةٍ تطبيقيةٍ بالذكاء الاصطناعي، إذ تبحث الشركات الناشئة والمؤسسات التجارية على حدٍ سواء عن متخصصين قادرين على بناء منصة بيانات وتطبيق نموذجٍ قائمٍ عليها، وقد أعاد هذا الدمج بين المهارات تشكيل أنماط التوظيف في مختلف القطاعات من المالية إلى الرعاية الصحية إلى التصنيع
تُدرك الشركات الآن أن الرحلة من البيانات الخام إلى اتخاذ القرارات الذكية يجب أن تكون سلسة، ويصبح المهندس الذي يُدير هذه الرحلة بأكملها لا يُقدّر بثمن، فهم لم يعودوا مُجرّد مُطوّرين بل مُفكّرون نُظم يُشكّلون جوهر الذكاء الرقمي
ماذا يعني هذا للمستقبل؟
يُعبّر صعود مهندسي الذكاء الاصطناعي من جذور هندسة البيانات عن قصةٍ أعمق حول كيفية تطور التكنولوجيا، فكل جيلٍ من الابتكارات يستوعب الجيل الذي يسبقه وكما أصبح مُطوّرو الويب مهندسين مُتكاملين يُصبح مهندسو البيانات مهندسي ذكاءٍ كامل، المستقبل ملكٌ لأولئك الذين يفهمون تدفق المعلومات وبنية الذكاء
لن يتباطأ هذا التحول، إذ ستُسهّل أدوات الأتمتة العمل بالبيانات التقليدية لكن الطلب على البصيرة البشرية سيزداد، إذ سيحتاج العالم إلى مهندسين قادرين على مزج البنية بالإبداع والمنطق بالرؤية وخطوط الأنابيب بالإدراك، وهذا تحديداً ما تُمثّله هذه الموجة الجديدة من مهندسي الذكاء الاصطناعي – جسر بين الآلي والمعنى
الخلاصة
مع تطلعنا إلى ما بعد عام ٢٠٢٥ قد يتلاشى لقب “مهندس بيانات” لكن روحه ستبقى أقوى من أي وقت مضى فالمحترفون الذين بنوا خطوط أنابيب البيانات يُشكّلون الآن شرايين الذكاء الاصطناعي، فلم يعد دورهم نقل المعلومات بل إيقاظها، وعليه أصبحوا بناة أنظمة ذكية لا تُعالج البيانات فحسب بل تفهمها أيضاً، لقد انتهى عصر الهندسة الصامت وبدأ عصر جديد حيث أصبح مهندسو البيانات مهندسي ذكاء اصطناعي ولم يعد الذكاء حلماً بل حرفة
In the world of modern technology, satire writes itself. Our devices update while we sleep, our data travels through invisible clouds, and our AI assistants occasionally mistake sarcasm for affection. If an artist ever tried to sketch the digital age, it would look like a mix of confusion, brilliance, and a dash of existential dread — which is exactly what these six cartoon concepts capture.
Each cartoon is a humorous reflection of our uneasy friendship with data, intelligence, computers, and the all-powerful Cloud. You might laugh, or you might just recognize your daily struggle with a login screen. Either way, welcome to the funniest serious commentary you’ll read today.
1. The Data Lake That Became a Swamp
Concept: A business analyst stands beside a murky lake labeled “Data Lake”, holding a fishing rod tangled with broken dashboards. Behind him, a sign reads: “No Swimming — Undefined Values.”
Insight: Companies were promised crystal-clear insight, but without proper management, their “data lakes” turned into “data swamps.” This cartoon pokes fun at the irony that storing too much data without structure leads to less clarity — not more.
2. AI at the Therapy Session
Concept: An AI robot lies on a therapist’s couch saying, “Sometimes I feel like humans only like me for my predictions.” The therapist, another AI, takes notes on a tablet labeled “Machine Learning Journal.”
Insight: Artificial intelligence has become so “smart” that we project human emotions onto it. This scene satirizes our growing emotional dependence on technology — and how AI often mirrors our own insecurities back at us.
3. The Cloud with a Lightning Mood
Concept: A cheerful worker uploads files to the cloud, only for the next panel to show a thundercloud raining error messages: “Connection Lost,” “Try Again Later,” “Unknown Issue.”
Insight: The Cloud has become a symbol of both convenience and fragility. This cartoon reflects how our entire digital lives depend on invisible servers that sometimes just… don’t feel like cooperating.
Advertisements
4. The Computer That Needed a Break
Concept: An overworked laptop with dark circles under its webcam says, “I’ve been updating since 3 a.m. — can I go into sleep mode now?” Nearby, a human drinks coffee, exhausted from waiting.
Insight: Computers are our most loyal coworkers — until they decide to restart during a deadline. The humor here hides a truth about our digital burnout: even machines need downtime, and so do we.
5. Data Privacy: The Peekaboo Game
Concept: A smartphone hides behind its screen, whispering, “Don’t worry, I only listen sometimes.” Around it, dozens of tiny apps peek through keyholes.
Insight: This cartoon comments on the illusion of privacy in a world where every app quietly watches. It’s a funny — but unsettling — reminder that our devices might know us better than we know ourselves.
6. When the Algorithm Discovered Art
Concept: An AI proudly displays its painting — a surreal image that looks suspiciously like data charts turned into abstract art. The human critic says, “Impressive. But why is it signed ‘Version 2.3’?”
Insight: AI creativity blurs the line between logic and imagination. This cartoon captures the moment machines start expressing beauty through patterns — and we start questioning what it means to be “creative.”
Conclusion
Technology has always been serious business — but beneath the code, spreadsheets, and cloud servers lies a quietly comic story of human ambition. These six cartoons remind us that every algorithm reflects its creator, every dataset hides a human flaw, and every crash, update, or “unknown error” is just another way the universe keeps us humble.
The next time your computer freezes mid-task, don’t get angry — just imagine the cartoon. You’ll laugh, then reboot.
Advertisements
داخل عقل ذكاء اصطناعي مُربك- ستة سيناريوهات كرتونية
Advertisements
في عالم التكنولوجيا الحديثة تُكتب السخرية نفسها، إذ تُحدّث أجهزتنا أثناء نومنا وتنتقل بياناتنا عبر سُحُبٍ خفية وأحياناً ما يُخطئ مساعدونا بالذكاء الاصطناعي بين السخرية والمودة، فلو حاول فنانٌ رسم العصر الرقمي لبدا مزيجاً من الارتباك والبراعة وقليل من الخوف الوجودي وهو بالضبط ما تُجسّده هذه المفاهيم الكرتونية الستة
يُمثّل كل رسمٍ كاريكاتيري انعكاساً فكاهياً لصداقتنا المتوترة مع البيانات والذكاء وأجهزة الكمبيوتر والسحابة الإلكترونية الجبارة، قد تضحك أو قد تُدرك ببساطة معاناتك اليومية مع شاشة تسجيل الدخول، وعلى أي حال مرحباً بك في أطرف تعليقٍ جادٍّ ستقرأه اليوم
1. بحيرة البيانات التي تحولت إلى مستنقع
: الفكرة
يقف مُحلّل أعمال بجانب بحيرةٍ مُظلمةٍ كُتب عليها “بحيرة البيانات” حاملاً صنارة صيدٍ مُتشابكةٍ مع لوحات القيادة المُعطّلة وخلفه لافتةٌ كُتب عليها: “ممنوع السباحة – قيمٌ غير مُحدّدة”
:رؤية ثاقبة
وُعدت الشركات برؤية ثاقبة ولكن بدون إدارة سليمة تحولت “بحيرات بياناتها” إلى “مستنقعات بيانات”، يسخر هذا الرسم الكاريكاتوري من مفارقة أن تخزين بيانات كثيرة دون هيكلة يؤدي إلى وضوح أقل لا أكثر
2. الذكاء الاصطناعي في جلسة العلاج
:الفكرة
يرقد روبوت ذكاء اصطناعي على أريكة المعالج النفسي قائلاً: أحياناً أشعر أن البشر لا يحبونني إلا لتوقعاتي، فيدوّن المعالج وهو روبوت ذكاء اصطناعي آخر ملاحظات على جهاز لوحي يحمل عنوان “مجلة التعلم الآلي”
:رؤية ثاقبة
أصبح الذكاء الاصطناعي “ذكياً” لدرجة أننا نُسقط عليه المشاعر البشرية، إذ يسخر هذا المشهد من اعتمادنا العاطفي المتزايد على التكنولوجيا وكيف يعكس الذكاء الاصطناعي في كثير من الأحيان مخاوفنا الشخصية
٣. “السحابة في مزاجٍ مُشرق
:الفكرة
يُحمّل عاملٌ مُبتهج ملفاتٍ إلى السحابة فتُظهر اللوحة التالية سحابةً مُمطرةً تُمطر رسائل خطأ: “انقطع الاتصال”، “حاول مُجدداً لاحقاً”، “مشكلة غير معروفة”
:لمحة
أصبحت السحابة رمزاً للراحة والهشاشة، إذ يُجسّد هذا الرسم الكاريكاتوري كيف تعتمد حياتنا الرقمية بأكملها على خوادم غير مرئية والتي أحياناً لا تشعر بالرغبة في التعاون
Advertisements
٤. “الكمبيوتر الذي احتاج إلى استراحة
:الفكرة
يقول كمبيوتر محمول مُرهق وهالات سوداء أسفل كاميرا الويب: أُحدّث منذ الثالثة صباحاً هل يُمكنني الدخول في وضع السكون الآن؟” في الجوار يشرب شخصٌ قهوته مُنهكاً من الانتظار
:لمحة
أجهزة الكمبيوتر هي أكثر زملاء العمل إخلاصاً لنا حتى تُقرر إعادة تشغيلها خلال موعد نهائي، فتُخفي الفكاهة هنا حقيقةً حول إرهاقنا الرقمي : حتى الآلات تحتاج إلى وقتٍ للتوقف ونحن أيضاً
٥. “خصوصية البيانات: لعبة الغميضة
:الفكرة
هاتف ذكي يختبئ خلف شاشته ويهمس: “لا تقلق أنا أكتفي بالاستماع فقط أحياناً “، حوله تسترق عشرات التطبيقات الصغيرة النظر من خلال ثقوب المفاتيح
:لمحة
يُعلق هذا الرسم الكاريكاتوري على وهم الخصوصية في عالم تراقبه فيه كل التطبيقات بصمت، إنه تذكير طريف – ولكنه مُقلق – بأن أجهزتنا قد تعرفنا أفضل مما نعرف أنفسنا
٦. “عندما اكتشفت الخوارزمية الفن
:الفكرة
يعرض الذكاء الاصطناعي بفخر لوحته وهي عبارة عن صورة سريالية تبدو بشكل مُريب كرسوم بيانية مُحوَّلة إلى فن تجريدي، يقول الناقد البشري: “مُبهرة، لكن لماذا تحمل توقيع ” الإصدار ٢.٣”؟
:لمحة
يُطمس إبداع الذكاء الاصطناعي الخط الفاصل بين المنطق والخيال، إذ يُصوِّر هذا الرسم الكاريكاتوري اللحظة التي تبدأ فيها الآلات بالتعبير عن الجمال من خلال الأنماط – ونبدأ بالتساؤل عن معنى أن تكون “مُبدعاً”
الخلاصة
لطالما كانت التكنولوجيا عملاً جاداً ولكن وراء الأكواد البرمجية وجداول البيانات وخوادم السحابة تكمن قصةٌ هزليةٌ هادئةٌ عن طموح الإنسان، تُذكرنا هذه الرسوم الكاريكاتورية الستة بأن كل خوارزميةٍ تعكس مُنشئها وكل مجموعة بياناتٍ تُخفي عيباً بشرياً وكل عطلٍ أو تحديثٍ أو “خطأٍ غير معروف” هو مجرد وسيلةٍ أخرى
في المرة القادمة التي يتجمد فيها جهاز الكمبيوتر الخاص بك أثناء القيام بمهمةٍ ما لا تغضب ، بل تخيّل فقط الرسم الكاريكاتوري، ببساطة ستضحك ثم تُعيد تشغيله
Python is the language that made data handling accessible to both beginners and experts. Yet, many students often overlook its hidden tricks—those little shortcuts and powerful functions that can save hours of work. Whether you’re dealing with messy datasets, writing code for assignments, or preparing for data-driven jobs, knowing these techniques can make you more efficient and stand out among peers.
Below are nine Python data tricks, complete with explanations and real-life examples, that you’ll wish you had discovered back in college.
1. List Comprehensions for Clean Data Manipulation
Instead of writing long loops, Python allows you to process lists elegantly.
Example:
Use Case in College: Quickly filtering and transforming exam scores, like pulling out all passing grades above 60 and squaring them for analysis.
2. The Power of enumerate()
When you need both the index and the value from a list, enumerate() saves you from writing manual counters.
Example:
Output:
Why it helps: No more creating separate index = 0 counters in your assignments.
3. Unpacking with the Asterisk * Operator
The * operator allows you to grab multiple values at once.
Example:
In Practice: Splitting the top two highest exam grades from the rest.
4. Using zip() to Pair Data
When you have two lists that should be combined, zip() does the magic.
Example:
Why it matters: Perfect for combining student names with their grades.
Advertisements
5. Dictionary Comprehensions
Just like list comprehensions, but for key-value pairs.
Example:
In Research: Building quick lookup tables for datasets.
6. collections.Counter for Quick Statistics
Counting items in data doesn’t need manual loops—use Counter
Example:
Why it rocks: Instantly count survey responses or repeated items in experiments.
7. F-Strings for Fast String Formatting
Instead of using + or format(), f-strings keep your code clean.
Example:
College Hack: Quickly generate report summaries.
8. Lambda Functions for On-the-Fly Operations
Anonymous functions can make sorting or filtering seamless.
Example:
Application: Sorting students by grades in just one line.
9. Pandas One-Liners for DataFrames
If you’re working with larger datasets, Pandas is a must.
Example:
Why it matters in college: Easy statistical calculations on survey results or lab data.
Conclusion
These nine tricks are not about memorizing syntax but about thinking like a Pythonic problem solver. Whether you’re cleaning messy data, analyzing exam results, or preparing datasets for machine learning, these shortcuts save time and make your work more professional.
The earlier you adopt these techniques, the more efficient and confident you’ll become in handling real-world data problems.
Advertisements
٩ حيل بيانات بايثون ينبغي على كل طالب إتقانها
Advertisements
بايثون هي اللغة التي جعلت معالجة البيانات في متناول المبتدئين والخبراء على حد سواء، ومع ذلك غالباً ما يغفل العديد من الطلاب عن حيلها الخفية – تلك الاختصارات الصغيرة والوظائف القوية التي يمكن أن توفر ساعات من العمل، سواء كنت تتعامل مع مجموعات بيانات غير منظمة أو تكتب برمجيات لواجبات أو تستعد لوظائف تعتمد على البيانات فإن معرفة هذه التقنيات يمكن أن تجعلك أكثر كفاءة وتبرز بين أقرانك
فيما يلي تسع حيل بيانات في بايثون كاملة مع الشروحات وأمثلة واقعية ستتمنى لو اكتشفتها من قبل
1. فهم القوائم لمعالجة البيانات بدقة
بدلاً من كتابة حلقات طويلة تتيح لك بايثون معالجة القوائم بأناقة
:مثال
حالة استخدام في الكلية: تصفية وتحويل درجات الامتحانات بسرعة، مثل سحب جميع الدرجات الناجحة التي تزيد عن 60 وتربيعها للتحليل
2.enumerate() قوة دالة
عندما تحتاج إلى كل من الفهرس والقيمة من قائمة
توفر عليك عناء كتابة عدادات يدوية enumerate() فإن دالة
: مثال
: المخرجات
لماذا يُفيدك هذا: لم يعد هناك حاجة لإنشاء عدادات منفصلة لمؤشر = ٠ في واجباتك
*٣. فك الضغط باستخدام مُعامل النجمة
يُتيح لك مُعامل النجمة * الحصول على قيم متعددة في آنٍ واحد
: مثال
في التطبيق العملي: فصل أعلى درجتين في الامتحان عن البقية
Advertisements
لإقران البيانات zip() ٤. استخدام دالة
عندما يكون لديك قائمتان يجب دمجهما
المهمة على أكمل وجه zip() تُؤدي دالة
: مثال
لماذا يُفيدك هذا: مثالي لدمج أسماء الطلاب مع درجاتهم
٥. فهم القاموس
تماماً مثل فهم القوائم ولكن لأزواج المفتاح والقيمة
: مثال
في البحث: إنشاء جداول بحث سريعة لمجموعات البيانات
للإحصاءات السريعةcollections.Counter .٦
لا يحتاج عدّ العناصر في البيانات إلى حلقات يدوية – استخدم العداد
: مثال
أهميته: حساب استجابات الاستبيان أو العناصر المتكررة في التجارب فوراً
7. لتنسيق سريع للسلاسل F سلاسل
format() بدلاً من استخدام + أو
على نظافة الكود F تحافظ سلاسل
: مثال
خدعة جامعية : إنشاء ملخصات التقارير بسرعة
8.للعمليات الفوريةLambda دوال
يمكن للدوال المجهولة أن تجعل عملية الفرز أو التصفية سلسة
: مثال
تطبيق: فرز الطلاب حسب الدرجات في سطر واحد فقط
9. أحادية السطر لإطارات البيانات Pandas جمل
ضروري Pandas إذا كنت تعمل مع مجموعات بيانات أكبر فإن
: مثال
أهميته في الجامعة : حسابات إحصائية سهلة لنتائج الاستبيان أو بيانات المختبر
الخلاصة
لا تتعلق هذه الحيل التسع بحفظ قواعد اللغة بل بالتفكير كحلٍّ لمشكلات بايثونية، فسواء كنت تُنظّف بياناتٍ مُركّبة أو تُحلّل نتائج امتحانات أو تُجهّز مجموعات بيانات للتعلم الآلي فإن هذه الاختصارات تُوفّر الوقت وتُضفي على عملك طابعاً احترافياً
كلما اعتمدت هذه التقنيات مُبكراً كلما زادت كفاءتك وثقتك بنفسك في التعامل مع مشاكل البيانات الواقعية
The data-driven era we live in makes data science one of the most attractive and future-proof careers. In 2025, the role of the data scientist has expanded beyond crunching numbers—it has become central to shaping business decisions, driving innovation, and even influencing government policies. Organizations are no longer looking for just analysts; they want professionals who can handle complex data systems, embrace artificial intelligence, and clearly translate results into actionable strategies. If you are wondering how to step into this field today, you need a clear roadmap that balances technical depth, practical projects, and future-oriented skills.
Building the Core Foundation: Mathematics and Statistics
At the heart of data science lies mathematics. Concepts such as linear algebra, probability, and statistics form the backbone of nearly every model or algorithm. A solid understanding of these principles allows you to evaluate results instead of blindly trusting tools. For example, when analyzing medical data, statistical reasoning helps determine whether a correlation is real or just random. Without this foundation, you may end up with models that look impressive but produce misleading insights. In 2025, employers still prioritize this knowledge, as it ensures you are not just a tool user but also a problem solver.
Programming and Tools of the Modern Data Scientist
While math gives you theory, programming gives you power. Python remains the dominant language, with libraries like NumPy, Pandas, and Scikit-learn forming a data scientist’s daily toolkit. R continues to be valued for advanced statistics, while SQL remains essential for querying and managing databases. Beyond coding, cloud-based platforms like AWS SageMaker, Google BigQuery, and Azure ML have become industry standards. For example, a retail company dealing with millions of customer records will expect you to pull, clean, and model data directly in the cloud. Mastering these tools makes you adaptable in diverse working environments.
Learning by Doing: The Power of Projects
In 2025, companies care less about what courses you took and more about what you can actually do. That’s why building a portfolio of projects is non-negotiable. Real-world projects—such as predicting housing prices, analyzing stock market sentiment, or developing a COVID-19 data dashboard—showcase not just technical skills but also your ability to think critically and communicate results. When hiring, managers are impressed by candidates who can walk them through a portfolio project, explaining why they made certain choices and how their work can be applied to real business challenges.
Advertisements
Communication: Turning Data Into Action
The best model in the world is useless if you cannot explain its results. In 2025, data scientists are increasingly judged on their ability to communicate clearly. Visualization tools such as Tableau and Power BI allow you to turn complex analyses into simple, intuitive dashboards. More importantly, you must develop the skill of storytelling—framing your findings in ways that decision-makers can act on. For instance, telling an executive team that a model has 90% accuracy is not enough; you must translate that into what it means for revenue growth, customer retention, or operational efficiency.
Embracing AI and Automation
Artificial intelligence has transformed data science. Tools like AutoML and AI assistants now automate repetitive coding and model selection. While some fear this reduces the demand for data scientists, the reality is the opposite: it makes the role more strategic. Your job in 2025 is not to compete with AI, but to guide it, validate its outputs, and connect its insights to business objectives. Think of yourself less as a “programmer” and more as a “data strategist.” This shift means you must stay updated on the latest AI-powered workflows and learn how to use them as allies rather than competitors.
Networking and Lifelong Learning
The final piece of the puzzle is community. Data science evolves too quickly to master in isolation. Joining Kaggle competitions, contributing to GitHub projects, or attending industry conferences will keep you sharp and visible. Networking often leads to opportunities that technical skills alone cannot unlock. For example, someone you collaborate with in an online hackathon might later refer you for a role in a top tech company. Continuous learning—through courses, certifications, and research—is what keeps a data scientist relevant in the long run.
Conclusion
Becoming a data scientist in 2025 is both challenging and rewarding. It requires you to combine strong mathematical knowledge, practical programming expertise, and hands-on project experience with the ability to tell compelling stories from data. It also means embracing AI as a partner and staying connected with the global data science community. If you commit to this journey, you’ll be preparing not just for a job, but for a career that places you at the heart of the digital revolution. Start small, stay consistent, and remember: the future belongs to those who can turn information into insight.
Advertisements
المهارات اللازمة لتصبح عالم بيانات في عام ٢٠٢٥
Advertisements
يجعل عصر البيانات الذي نعيش فيه من علم البيانات أحد أكثر المهن جاذبيةً واستعداداً للمستقبل، ففي عام ٢٠٢٥ توسّع دور عالم البيانات ليتجاوز مجرد تحليل الأرقام ليصبح محورياً في صياغة قرارات الأعمال ودفع عجلة الابتكار وحتى التأثير على السياسات الحكومية، إذ لم تعد المؤسسات تبحث عن محللين فحسب بل تريد متخصصين قادرين على التعامل مع أنظمة البيانات المعقدة وتبني الذكاء الاصطناعي وترجمة النتائج بوضوح إلى استراتيجيات عملية
إذا كنت تتساءل عن كيفية دخول هذا المجال اليوم فأنت بحاجة إلى خارطة طريق واضحة تُوازن بين العمق التقني والمشاريع العملية والمهارات المستقبلية
بناء الأساس : الرياضيات والإحصاء
تكمن الرياضيات في جوهر علم البيانات، إذ تُشكل مفاهيم مثل الجبر الخطي والاحتمالات والإحصاء العمود الفقري لكل نموذج أو خوارزمية تقريباً، ويتيح لك الفهم المتين لهذه المبادئ تقييم النتائج بدلاً من الاعتماد بشكل أعمى على الأدوات، فعلى سبيل المثال: عند تحليل البيانات الطبية يُساعد الاستدلال الإحصائي في تحديد ما إذا كان الارتباط حقيقياً أم مجرد عشوائي، فبدون هذا الأساس قد ينتهي بك الأمر بنماذج تبدو مبهرة ولكنها تُقدم رؤىً مُضللة، وفي عام ٢٠٢٥ لا يزال أصحاب العمل يُعطون الأولوية لهذه المعرفة لأنها تضمن لك ليس فقط استخدام الأدوات بل أيضاً القدرة على حل المشكلات
البرمجة وأدوات عالِم البيانات الحديث
بينما تُعطيك الرياضيات النظرية تُعطيك البرمجة القوة، إذ لا يزال بايثون هو اللغة السائدة حيث تُشكل مكتبات
NumPy و Pandas و Scikit-learn مثل
مجموعة الأدوات اليومية لعالم البيانات
تُقدر بقيمتها للإحصاءات المتقدمة R ولا تزال لغة
أساسية للاستعلام عن قواعد البيانات وإدارتها SQL بينما لا تزال
إلى جانب البرمجة أصبحت المنصات السحابية
AWS SageMaker و Google BigQuery و Azure ML مثل
معايير صناعية، فعلى سبيل المثال تتوقع منك شركة تجزئة تتعامل مع ملايين سجلات العملاء سحب البيانات وتنظيفها ونمذجتها مباشرةً في السحابة، وعليه فإن إتقان هذه الأدوات يُتيح لك القدرة على التكيف في بيئات العمل المتنوعة
التعلم بالممارسة : قوة المشاريع
مؤخراً أصبحت الشركات أقل اهتماماً بالدورات التي التحقتَ بها وأكثر اهتماماً بما يمكنك إنجازه فعلياً، ولذلك يُعدّ بناء محفظة مشاريع أمراً لا غنى عنه فالمشاريع الواقعية مثل التنبؤ بأسعار المساكن وتحليل اتجاهات سوق الأسهم أو تطوير لوحة معلومات بيانات كوفيد ١٩ لا تُظهر المهارات التقنية فحسب بل تُظهر أيضاً قدرتك على التفكير النقدي وتوصيل النتائج، وعند التوظيف يُعجب المدراء بالمرشحين الذين يستطيعون شرح مشروع المحفظة لهم وشرح أسباب اتخاذهم قرارات معينة وكيفية تطبيق عملهم على تحديات الأعمال الحقيقية
Advertisements
التواصل: تحويل البيانات إلى أفعال
أفضل نموذج في العالم لا قيمة له إذا لم تتمكن من شرح نتائجه، ففي عام ٢٠٢٥ يُقيّم علماء البيانات بشكل متزايد بناءً على قدرتهم على التواصل بوضوح
Tableau و Power BI إذ تتيح لك أدوات التصور مثل
تحويل التحليلات المعقدة إلى لوحات معلومات بسيطة وسهلة الاستخدام، والأهم من ذلك يجب عليك تطوير مهارة سرد القصص – صياغة نتائجك بطرق يمكن لصانعي القرار العمل عليها، فعلى سبيل المثال: لا يكفي إخبار فريق تنفيذي بأن دقة نموذج ما تبلغ 90% بل يجب ترجمة ذلك إلى ما يعنيه ذلك لنمو الإيرادات أو الحفاظ على العملاء أو الكفاءة التشغيلية
احتضان الذكاء الاصطناعي والأتمتة
أحدَثَ الذكاء الاصطناعي تحولاً جذرياً في علم البيانات
AutoML إذ تُؤتمت أدوات مثل
ومساعدي الذكاء الاصطناعي الآن عمليات الترميز المتكررة واختيار النماذج، وبينما يخشى البعض من أن يُقلل هذا من الطلب على علماء البيانات فإن الواقع هو عكس ذلك، فهو يجعل الدور أكثر استراتيجية، وعليه فإن وظيفتك في عام 2025 ليست منافسة الذكاء الاصطناعي بل توجيهه والتحقق من صحة مخرجاته وربط رؤاه بأهداف العمل، فكّر في نفسك أقل كـ”مبرمج” وأكثر كـ”استراتيجي بيانات”، هذا التحول يعني أنه يجب عليك البقاء على اطلاع دائم بأحدث سير العمل المدعومة بالذكاء الاصطناعي وتعلم كيفية استخدامها كحلفاء بدلاً من منافسين
التواصل والتعلم مدى الحياة
الجزء الأخير من اللغز هو المجتمع، إذ يتطور علم البيانات بسرعة كبيرة جداً بحيث لا يمكن إتقانه بمعزل عن الآخرين
Kaggle فالمشاركة في مسابقات
GitHub أو المساهمة في مشاريع
أو حضور مؤتمرات الصناعة ستُبقيك متألقاً وواضحاً، فغالباً ما يُتيح لك التواصل فرصاً لا تُتاح لك بالمهارات التقنية وحدها، فعلى سبيل المثال قد يُرشّحك شخصٌ تتعاون معه في هاكاثون إلكتروني لاحقاً لوظيفة في شركة تقنية رائدة، وعليه فالتعلم المستمر من خلال الدورات والشهادات والبحث هو ما يُبقي عالم البيانات ذا صلة على المدى الطويل
الخلاصة
يُعدّ العمل كعالم بيانات في عام ٢٠٢٥ تحدياً ومكافأة في آنٍ واحد، إذ يتطلب منك الجمع بين المعرفة الرياضية القوية والخبرة العملية في البرمجة والخبرة العملية في المشاريع والقدرة على سرد قصص مُلهمة من البيانات، كما يعني ذلك تبني الذكاء الاصطناعي كشريك والبقاء على تواصل مع مجتمع علوم البيانات العالمي، وبالالتزام بهذه الرحلة لن تُهيئ نفسك لوظيفة فحسب بل لمهنة تضعك في قلب الثورة الرقمية، ابدأ بخطوات صغيرة والتزم بالثبات وتذكر: المستقبل لمن يُحوّل المعلومات إلى رؤى
The field of data science has become one of the most sought-after career paths in today’s digital economy. With industries relying on data-driven decisions more than ever, companies are constantly searching for skilled professionals who can turn raw information into meaningful insights. Yet for newcomers, the biggest question remains: where do you start, and how do you navigate the overwhelming list of tools, concepts, and frameworks? The truth is, you don’t need to learn everything. You just need a clear, structured roadmap that leads directly to employability.
In this article, I will walk you through the only data science roadmap you need to get a job, breaking down each stage into practical, narrative-driven steps that ensure you not only learn but also position yourself as a competitive candidate.
Building the Mathematical Foundation
Every strong data scientist begins with mathematics, not because you need to become a mathematician, but because the language of data is built on numbers, probability, and patterns. Concepts like linear algebra, calculus, and statistics serve as the bedrock of understanding how algorithms work and how predictions are made. For example, understanding the gradient in calculus is not about solving equations on paper, but about recognizing how optimization happens in machine learning models like gradient descent. Similarly, grasping probability helps you evaluate risks, detect biases, and interpret uncertainty in predictions. Without this foundation, you may find yourself relying blindly on libraries without ever comprehending what’s happening behind the scenes. And in interviews, recruiters often test this depth of knowledge. Think of this stage as building the grammar before you start writing in the language of data.
Mastering Programming for Data Science
Once the mathematics is in place, the next step is to learn how to communicate with data effectively—and this is where programming comes in. Python has emerged as the undisputed king of data science languages, thanks to its simplicity and vast ecosystem of libraries like NumPy, Pandas, Scikit-learn, and TensorFlow. However, R also remains valuable, particularly in research and academic environments. Learning programming is not just about syntax; it is about developing problem-solving skills. Imagine being handed a messy dataset full of missing values, outliers, and inconsistent formatting. Your task as a data scientist is to clean, transform, and prepare that data so that it can tell a story. Through consistent coding practice, such as participating in Kaggle competitions or working on personal projects, you start developing an intuition for handling real-world data challenges. This hands-on experience becomes your proof of competence in job applications.
Diving into Data Analysis and Visualization
At its heart, data science is about storytelling, and visualization is the way you make data’s story come alive. Employers want to see if you can take complex, multi-dimensional datasets and simplify them into insights that decision-makers can understand. This is why mastering tools like Matplotlib, Seaborn, or Plotly is crucial. Beyond Python libraries, platforms such as Power BI or Tableau also enhance your ability to create compelling dashboards. For example, imagine presenting a sales forecast to a boardroom—numbers alone may seem abstract, but a clear line chart showing trends or a heatmap highlighting problem areas instantly resonates with the audience. The ability to visualize effectively often becomes the deciding factor in whether your work is recognized and implemented within an organization.
Advertisements
Understanding Machine Learning Concepts
With foundations in mathematics, programming, and visualization established, the next step is venturing into machine learning. This is where theory meets practice, and you begin to teach machines how to make decisions. Start with supervised learning methods such as linear regression, logistic regression, and decision trees, then gradually move into more advanced algorithms like random forests, gradient boosting, and support vector machines. From there, unsupervised learning methods like clustering or dimensionality reduction broaden your perspective. What matters most is not memorizing formulas but understanding the intuition behind each algorithm—why you would use it, what kind of data it works best with, and how to evaluate its performance using metrics like accuracy, precision, or recall. Recruiters often focus on your ability to explain machine learning concepts in plain language, which shows that you don’t just “know” the algorithm but truly understand it.
Gaining Practical Experience Through Projects
No matter how many courses you complete or how many books you read, employers ultimately look for proof of application. This is where projects become the centerpiece of your roadmap. Start with small, guided projects like predicting housing prices or analyzing customer churn, then move toward larger, end-to-end case studies. For instance, you could build a sentiment analysis model for social media data or create a recommendation system similar to what Netflix or Amazon uses. Beyond showcasing your technical ability, projects demonstrate initiative and creativity. The key is to document your work on platforms like GitHub and share your learning journey on LinkedIn or personal blogs. In today’s job market, recruiters often review your portfolio before they even invite you for an interview, and a strong collection of projects can significantly set you apart.
Preparing for the Job Market
The final step in the roadmap is translating all your skills into employability. This means learning how to craft a resume that highlights not just your technical tools but also the impact of your projects. Instead of listing “Python, Pandas, Scikit-learn,” focus on what you achieved with them, such as “Developed a machine learning model that improved prediction accuracy by 15%.” Equally important is preparing for interviews, which often include both technical tests and behavioral questions. You might be asked to code live, solve case studies, or explain your approach to a data problem. Beyond the technical side, employers want to know if you can communicate with non-technical teams, adapt quickly, and think critically under pressure. Networking also plays a huge role—attending meetups, joining online communities, and seeking mentorship can open doors to opportunities you wouldn’t find on job boards.
Conclusion
The journey to becoming a data scientist may appear overwhelming at first glance, but with the right roadmap, it becomes a structured and achievable process. Start with building your mathematical foundation, then progress into programming, analysis, machine learning, and projects, before finally polishing your professional profile for the job market. Remember, the goal is not to learn everything at once but to follow a step-by-step path that steadily builds both competence and confidence. Employers are not just looking for people who know the tools—they want problem-solvers, storytellers, and innovators who can bring data to life. Follow this roadmap with persistence, and you will not only become job-ready but also set yourself on the path toward a rewarding career in data science.
Advertisements
خارطة الطريقالمثالية لعلم البيانات لتحقيق وظيفة أحلامك
Advertisements
أصبح مجال علم البيانات من أكثر المسارات المهنية رواجاً في الاقتصاد الرقمي اليوم، ومع اعتماد القطاعات على القرارات القائمة على البيانات أكثر من أي وقت مضى تبحث الشركات باستمرار عن متخصصين مهرة قادرين على تحويل المعلومات الخام إلى رؤى قيّمة، ومع ذلك يبقى السؤال الأهم بالنسبة للمبتدئين: من أين تبدأ وكيف تتعامل مع القائمة الهائلة من الأدوات والمفاهيم والأطر؟ في الحقيقة لستَ بحاجة إلى تعلم كل شيء، كل ما تحتاجه هو خارطة طريق واضحة ومنظمة تُفضي مباشرةً إلى فرص التوظيف
وفي هذه المقالة سأشرح لك خارطة الطريق الوحيدة التي تحتاجها في علم البيانات للحصول على وظيفة مُقسّماً كل مرحلة إلى خطوات عملية مبنية على سرد قصصي تضمن لك ليس فقط التعلم بل أيضاً وضع نفسك كمرشح تنافسي
بناء الأساس الرياضي
يبدأ كل عالِم بيانات قوي بالرياضيات ليس لأنك بحاجة إلى أن تصبح عالم رياضيات ولكن لأن لغة البيانات مبنية على الأرقام والاحتمالات والأنماط، إذ تُشكّل مفاهيم مثل الجبر الخطي وحساب التفاضل والتكامل والإحصاء أساساً لفهم كيفية عمل الخوارزميات وكيفية التنبؤ، فعلى سبيل المثال لا يقتصر فهم التدرج في حساب التفاضل والتكامل على حل المعادلات على الورق بل يشمل إدراك كيفية حدوث التحسين في نماذج التعلم الآلي مثل انحدار التدرج، وبالمثل يُساعدك فهم الاحتمالات على تقييم المخاطر واكتشاف التحيزات وتفسير عدم اليقين في التنبؤات، فبدون هذا الأساس قد تجد نفسك تعتمد بشكل أعمى على المكتبات دون فهم ما يحدث خلف الكواليس، وفي المقابلات غالباً ما يختبر مسؤولو التوظيف هذا العمق من المعرفة، تخيّل هذه المرحلة كبناء القواعد قبل البدء في الكتابة بلغة البيانات
إتقان البرمجة لعلم البيانات
بمجرد إتقان الرياضيات فإن الخطوة التالية هي تعلم كيفية التواصل مع البيانات بفعالية وهنا يأتي دور البرمجة، برزت بايثون كملكة لغات علم البيانات بلا منازع بفضل بساطتها ونطاقها الواسع من المكتبات
NumPy و Pandas و Scikit-learn و TensorFlow مثل
قيّمة R ومع ذلك لا تزال لغة
لا سيما في البيئات البحثية والأكاديمية، تعلّم البرمجة لا يقتصر على بناء الجملة فحسب بل يشمل أيضاً تطوير مهارات حل المشكلات، فتخيّل أنك تُسلّم مجموعة بيانات مُربكة مليئة بالقيم الناقصة والقيم الشاذة والتنسيق غير المتسق، مهمتك كعالِم بيانات هي تنظيف هذه البيانات وتحويلها وتجهيزها بحيث تُمكّنك من سرد قصة، إذاً من خلال ممارسة البرمجة بانتظام
Kaggle مثل المشاركة في مسابقات
أو العمل على مشاريع شخصية تبدأ في تطوير حدسك للتعامل مع تحديات البيانات الواقعية تُصبح هذه التجربة العملية دليلاً على كفاءتك في طلبات التوظيف
التعمق في تحليل البيانات وتصورها
في جوهره يتمحور علم البيانات حول سرد القصص والتصور هو الطريقة التي تُضفي بها الحيوية على قصة البيانات، إذ يرغب أصحاب العمل في معرفة ما إذا كان بإمكانك استخدام مجموعات البيانات المعقدة ومتعددة الأبعاد وتبسيطها إلى رؤى يمكن لصانعي القرار فهمها، ولهذا السبب
Plotly أو Seaborn أو Matplotlib يُعدّ إتقان أدوات مثل
أمراً بالغ الأهمية
Tableau أو Power BI إلى جانب مكتبات بايثون تُعزز منصات مثل
قدرتك على إنشاء لوحات معلومات جذابة، وعلى سبيل المثال تخيّل عرض توقعات مبيعات أمام مجلس إدارة قد تبدو الأرقام وحدها مجردة لكن مخططاً خطياً واضحاً يُظهر الاتجاهات أو خريطة حرارية تُبرز مواطن الخلل تلقى صدى فورياً لدى الجمهور، وعليه غالباً ما تُصبح القدرة على التصور الفعّال العامل الحاسم في تقدير عملك وتطبيقه داخل المؤسسة
Advertisements
فهم مفاهيم التعلم الآلي
بعد إرساء أسس الرياضيات والبرمجة والتصور تأتي الخطوة التالية وهي الانغماس في التعلم الآلي، وهنا تلتقي النظرية بالتطبيق وتبدأ بتعليم الآلات كيفية اتخاذ القرارات، لذا ابدأ بأساليب التعلم المُشرف مثل الانحدار الخطي والانحدار اللوجستي وأشجار القرار ثم انتقل تدريجياً إلى خوارزميات أكثر تقدماً مثل الغابات العشوائية وتعزيز التدرج وآلات المتجهات الداعمة، من هنا تُوسّع أساليب التعلم غير المُشرف مثل التجميع أو تقليل الأبعاد آفاقك، وتذكر دائماً الأهم ليس حفظ الصيغ بل فهم جوهر كل خوارزمية أي سبب استخدامها ونوع البيانات التي تعمل معها بشكل أفضل وكيفية تقييم أدائها باستخدام مقاييس مثل الدقة والإتقان والتذكر، فغالباً ما يركز مسؤولو التوظيف على قدرتك على شرح مفاهيم التعلم الآلي بلغة واضحة مما يدل على أنك لا “تعرف” الخوارزمية فحسب بل تفهمها فهماً حقيقياً
اكتساب الخبرة العملية من خلال المشاريع
بغض النظر عن عدد الدورات التي تُكملها أو عدد الكتب التي تقرأها يبحث أصحاب العمل في النهاية عن دليل على طلبك للوظيفة، وهنا تصبح المشاريع محور خارطة طريقك، لذا ابدأ بمشاريع صغيرة وموجهة مثل التنبؤ بأسعار المساكن أو تحليل معدل فقدان العملاء ثم انتقل إلى دراسات حالة أكبر وأكثر شمولية، فعلى سبيل المثال يمكنك بناء نموذج لتحليل المشاعر لبيانات وسائل التواصل الاجتماعي أو إنشاء نظام توصيات مشابه لما تستخدمه نتفليكس أو أمازون، إلى جانب إبراز قدراتك التقنية تُظهر المشاريع روح المبادرة والإبداع
GitHub ويكمن السر في توثيق عملك على منصات مثل
LinkedIn ومشاركة رحلة التعلم الخاصة بك على
أو المدونات الشخصية، ففي سوق العمل اليوم غالباً ما يُراجع مسؤولو التوظيف ملف أعمالك قبل دعوتك لإجراء مقابلة ويمكن لمجموعة قوية من المشاريع أن تُميزك بشكل كبير
التحضير لسوق العمل
الخطوة الأخيرة في خارطة الطريق هي ترجمة جميع مهاراتك إلى فرص عمل، وهذا يعني تعلم كيفية صياغة سيرة ذاتية تُبرز ليس فقط أدواتك التقنية ولكن أيضاً تأثير مشاريعك، فبدلاً من ذكر “بايثون، باندا، سكيت ليرن”، ركّز على ما حققته باستخدامها مثل “طوّرت نموذج تعلّم آلي حسّن دقة التنبؤ بنسبة 15%”، ولا يقلّ أهميةً التحضير للمقابلات والتي غالباً ما تشمل اختبارات تقنية وأسئلة سلوكية، قد يُطلب منك البرمجة مباشرةً أو حلّ دراسات حالة أو شرح منهجك في حل مشكلة بيانات، إضافة إلى الجانب التقني يرغب أصحاب العمل بمعرفة قدرتك على التواصل مع الفرق غير التقنية والتكيّف بسرعة والتفكير النقدي تحت الضغط، كما يلعب التواصل دوراً هاماً – فحضور اللقاءات والانضمام إلى المجتمعات الإلكترونية والبحث عن الإرشاد كلها عوامل تفتح لك آفاقاً جديدة لفرص عمل لم تكن لتجدها في مواقع التوظيف
الخلاصة
قد تبدو رحلة التحول إلى عالم بيانات شاقة للوهلة الأولى ولكن مع خارطة الطريق الصحيحة تصبح عملية منظمة وقابلة للتحقيق، لذا ابدأ ببناء أساسك الرياضي ثم تقدّم نحو البرمجة والتحليل والتعلّم الآلي والمشاريع قبل أن تُحسّن ملفك المهني لسوق العمل، تذكر أن الهدف ليس تعلم كل شيء دفعةً واحدة بل اتباع مسار تدريجي يبني الكفاءة والثقة بالنفس باستمرار، إذ لا يبحث أصحاب العمل فقط عن أشخاص يجيدون استخدام الأدوات بل يريدون من يجيد حل المشاكل ويروي القصص، ومبتكرين قادرين على تجسيد البيانات، لذا اتبع هذه الخارطة بإصرار ولن تصبح جاهزاً للوظيفة فحسب بل ستضع نفسك أيضاً على الطريق نحو مهنة مجزية في مجال علوم البيانات
A data pipeline is a structured workflow that transports raw data from multiple sources (databases, APIs, logs, IoT sensors, etc.) through a sequence of processes such as cleaning, transformation, feature extraction, and storage before feeding it into machine learning models. Unlike ad-hoc scripts, pipelines are automated, repeatable, and scalable—ensuring consistent results over time.
Real-life example: Imagine a fraud detection system at a bank. Every transaction stream needs to be captured in real-time, validated, enriched with customer history, and transformed into numerical features that a model can understand. Without a pipeline, data would be chaotic and models would fail.
Core Components of a Data Pipeline Architecture
Designing a robust ML pipeline involves breaking it into logical components, each handling a specific responsibility.
Data Ingestion – The entry point of data from structured (SQL databases) or unstructured sources (social media feeds, images).
Data Storage – Raw data is stored in data lakes (e.g., AWS S3, Hadoop) or structured warehouses (e.g., Snowflake, BigQuery).
Data Processing & Transformation – Cleaning, normalizing, and feature engineering using frameworks like Apache Spark or Pandas.
Feature Store – A centralized repository to manage and serve features consistently across training and inference.
Model Serving Layer – Once trained, models consume data from the pipeline for real-time predictions.
Monitoring & Logging – Ensures pipeline stability, detects anomalies, and triggers alerts when failures occur.
Diagram: High-Level ML Data Pipeline Architecture
Here’s a simple conceptual diagram of the flow:
[ Data Sources ] ---> [ Ingestion Layer ] ---> [ Storage ] ---> [ Processing & Transformation ] ---> [ Feature Store ] ---> [ ML Model ] ---> [ Predictions ]
This modular architecture ensures flexibility: you can swap out technologies at each stage (e.g., Kafka for ingestion, Spark for processing) without breaking the pipeline.
Batch vs. Streaming Pipelines
Not all machine learning applications require the same data speed. Choosing between batch and streaming pipelines is a crucial design decision.
Batch Pipelines: Data is processed in chunks at scheduled intervals (daily, weekly). Example: an e-commerce company analyzing customer purchase data every night to update recommendation models.
Streaming Pipelines: Data is processed continuously in real-time. Example: ride-hailing apps (like Uber) that use live GPS signals to predict ETAs.
Hybrid architectures often combine both—batch pipelines for historical insights and streaming for instant responses.
Advertisements
Best Practices for Designing ML Data Pipelines
Automation First – Manual steps increase error probability. Automate ingestion, validation, and monitoring.
Data Quality Gates – Validate data at every stage (e.g., schema checks, missing value detection).
Scalability – Use distributed processing frameworks (Spark, Flink) for large datasets.
[ IoT Sensors ] --> [ Kafka Stream ] --> [ Data Lake ] --> [ Spark Processing ] --> [ Feature Store ] --> [ ML Model API ] --> [ Maintenance Alerts ]
Conclusion
Designing a data pipeline for machine learning is not just about moving data—it is about engineering trust in the data lifecycle. A well-structured pipeline ensures that models receive clean, timely, and relevant inputs, thereby improving their accuracy and reliability. Whether it’s batch or streaming, the key lies in building modular, automated, and scalable architectures. For organizations investing in AI, strong pipelines are the invisible backbone of their success.
Advertisements
من البيانات الخام إلى مدخلات النموذج: كيفية تصميم خطوط أنابيب بيانات فعّالة
Advertisements
ما هو خط أنابيب البيانات في التعلم الآلي؟
خط أنابيب البيانات هو سير عمل مُنظّم ينقل البيانات الخام من مصادر متعددة (قواعد البيانات، واجهات برمجة التطبيقات، السجلات، أجهزة استشعار إنترنت الأشياء، إلخ) عبر سلسلة من العمليات مثل التنظيف والتحويل واستخراج الميزات والتخزين قبل إدخالها في نماذج التعلم الآلي، فعلى عكس البرامج النصية المخصصة تتميز خطوط الأنابيب بالأتمتة والتكرار والقابلية للتطوير مما يضمن نتائج متسقة مع مرور الوقت
مثال: تخيّل نظاماً للكشف عن الاحتيال في أحد البنوك، يجب التقاط كل تدفق من المعاملات في الوقت الفعلي والتحقق من صحته وإثرائه بسجلات العملاء وتحويله إلى خصائص رقمية يمكن للنموذج فهمها، إذاً بدون خط أنابيب ستكون البيانات فوضوية وستفشل النماذج
المكونات الأساسية لبنية خط أنابيب البيانات
يتضمن تصميم خط أنابيب قوي للتعلم الآلي تقسيمه إلى مكونات منطقية كل منها يتعامل مع مسؤولية محددة
١. استيعاب البيانات : نقطة إدخال البيانات من مصادر مُهيكلة
أو غير مُهيكلة SQL مثل قواعد بيانات
مثل موجزات وسائل التواصل الاجتماعي والصور
٢. تخزين البيانات : تخزن البيانات الخام في بحيرات بيانات
Hadoop و AWS S3 :مثل
BigQuery و Snowflake :ومستودعات مهيكلة، مثل
٣. معالجة البيانات وتحويلها : التنظيف وهندسة الميزات
Pandas أو Apache Spark باستخدام أطر عمل مثل
٤. مخزن الميزات : مستودع مركزي لإدارة الميزات وتقديمها باستمرار عبر التدريب والاستدلال
٥. طبقة تقديم النماذج : بمجرد تدريبها تستهلك النماذج البيانات من خط الأنابيب للتنبؤات في الوقت الفعلي
٦. المراقبة والتسجيل : يضمن استقرار خط الأنابيب ويكتشف أي تشوهات ويُطلق تنبيهات عند حدوث أعطال
مخطط: بنية خط أنابيب بيانات التعلم الآلي عالي المستوى
فيما يلي مخطط مفاهيمي بسيط للتدفق
[ Data Sources ] ---> [ Ingestion Layer ] ---> [ Storage ] ---> [ Processing & Transformation ] ---> [ Feature Store ] ---> [ ML Model ] ---> [ Predictions ]
تضمن هذه البنية المعيارية المرونة: يمكنك تبديل التقنيات في كل مرحلة
للمعالجة Spark للاستيعاب و Kafka : مثل
دون تعطيل خط الأنابيب
Advertisements
الدفعات مقابل خطوط أنابيب التدفق
لا تتطلب جميع تطبيقات التعلم الآلي نفس سرعة البيانات، إذ يُعد الاختيار بين خطوط أنابيب الدفعات والتدفق قراراً تصميمياً حاسماً
خطوط أنابيب الدفعات: تُعالج البيانات في مجموعات على فترات زمنية مجدولة (يومياً، أسبوعياً)، فعلى سبيل مثال: شركة تجارة إلكترونية تُحلل بيانات مشتريات العملاء كل ليلة لتحديث نماذج التوصيات
خطوط أنابيب التدفق: تُعالج البيانات باستمرار وفي الوقت الفعلي، ومثالاً على ذلك: تطبيقات حجز السيارات (مثل أوبر)
GPS التي تستخدم إشارات
المباشرة للتنبؤ بوقت الوصول المتوقع
غالباً ما تجمع البنى الهجينة بين الاثنين : خطوط أنابيب الدفعات للرؤى التاريخية والتدفق للاستجابات الفورية
أفضل الممارسات لتصميم خطوط أنابيب بيانات التعلم الآلي
الأتمتة أولاً : الخطوات اليدوية تزيد من احتمالية الخطأ، لذا يوصى بأتمتة عمليات الاستيعاب والتحقق والمراقبة *
بوابات جودة البيانات : التحقق من صحة البيانات في كل مرحلة (مثل: فحص المخططات واكتشاف القيم المفقودة) *
(Spark وFlink) قابلية التوسع : استخدام أطر المعالجة الموزعة *
لمجموعات البيانات الكبيرة
إعادة الاستخدام والتركيبية : بناء خطوط الأنابيب ككتل قابلة لإعادة الاستخدام (استخراج وتحويل وتحميل البيانات، واستخراج الميزات)
إدارة الإصدارات : تتبع إصدارات كل من مجموعات البيانات والنماذج لضمان إمكانية إعادة الإنتاج *
الأمان والامتثال : حماية البيانات الحساسة (خاصةً في مجال الرعاية الصحية أو التمويل) *
مثال: خط أنابيب للصيانة التنبؤية في التصنيع
يرغب مصنع في التنبؤ بأعطال الآلات باستخدام بيانات المستشعر
Kafka الاستيعاب : تُرسل أجهزة إنترنت الأشياء البيانات إلى *
التخزين : تُحفظ سجلات المستشعر الخام في بحيرة بيانات سحابية *
القراءات غير المرغوب فيها Spark المعالجة : يُنظف *
نشر النموذج : يتنبأ نموذج التصنيف باحتمالية الأعطال ويرسل تنبيهات إلى المهندسين *
يُقلِّل هذا الخط من وقت التوقف عن العمل ويُوفِّر التكاليف من خلال تمكين الإجراءات الوقائية
مخطط: خط أنابيب الصيانة التنبؤية الشامل
[ IoT Sensors ] --> [ Kafka Stream ] --> [ Data Lake ] --> [ Spark Processing ] --> [ Feature Store ] --> [ ML Model API ] --> [ Maintenance Alerts ]
الخلاصة
لا يقتصر تصميم خط أنابيب بيانات للتعلم الآلي على نقل البيانات فحسب بل يشمل أيضاً بناء الثقة الهندسية في دورة حياة البيانات، يضمن خط الأنابيب المُنظَّم جيداً تلقي النماذج لمدخلات دقيقة وفي الوقت المناسب وذات صلة مما يُحسِّن دقتها وموثوقيتها، سواءً كان ذلك بنظام الدفعات أو البث يكمن السر في بناء هياكل معيارية وآلية وقابلة للتطوير، فبالنسبة للمؤسسات التي تستثمر في الذكاء الاصطناعي تُشكِّل خطوط الأنابيب القوية العمود الفقري غير المرئي لنجاحها
In the rapidly evolving world of data analytics, the difference between an average analyst and one in the top 1% often comes down to the tools they use. While many professionals still rely heavily on spreadsheets and basic dashboards, the elite class of analysts integrates artificial intelligence into their workflow. These tools allow them to move faster, uncover patterns others miss, and tell compelling stories with data. What separates them from the rest is not only their skill set but also their ability to harness AI as an extension of their expertise.
ChatGPT: The Analyst’s On-Demand Assistant
ChatGPT has quickly become the quiet partner of many top analysts. Beyond its obvious role as a conversational AI, it functions as a code assistant, a research aide, and even a data storytelling companion. Instead of spending hours debugging SQL queries or rewriting Python scripts, analysts turn to ChatGPT to speed up technical tasks. Even more importantly, it helps explain statistical concepts in clear, client-friendly language, turning complicated findings into digestible insights. A financial analyst, for example, may rely on ChatGPT to reformat client reports instantly, saving hours that would have been spent manually editing.
Power BI with Copilot: Turning Data into Stories
Microsoft’s Power BI has long been a cornerstone of business intelligence, but with the integration of Copilot, it has transformed into something even more powerful. Analysts now rely on Copilot to generate DAX formulas from plain English prompts, summarize entire dashboards, and automatically provide executive-ready insights. Instead of creating static reports, elite analysts craft data stories that speak directly to decision-makers. Copilot doesn’t just make the process faster—it makes it smarter, empowering analysts to focus on interpretation rather than technical execution.
Tableau with Einstein AI: Predicting the Future of Data
Tableau has always excelled in visualization, but when combined with Einstein AI, it offers predictive capabilities that make analysts stand out. Elite professionals use it not only to present data beautifully but also to forecast trends, detect anomalies, and run natural language queries without writing a single line of code. A marketing analyst, for instance, may ask Tableau’s AI to predict customer churn, receiving accurate forecasts that once required complex modeling. This ability to blend visualization with prediction is what makes Tableau a secret weapon for top analysts.
DataRobot: Automating Machine Learning with Precision
While building machine learning models used to be the domain of data scientists, tools like DataRobot have democratized the process. The world’s top analysts use it to rapidly build, test, and deploy predictive models without sacrificing accuracy. What makes DataRobot essential is not just automation, but also explainability—it helps analysts understand and communicate how the model works. This transparency is crucial when executives ask, “Why does the model recommend this decision?” With DataRobot, analysts can provide both speed and clarity.
Advertisements
MonkeyLearn: Unlocking Insights from Unstructured Text
Data is not always structured, and some of the richest insights come from unstructured text such as customer reviews, survey responses, and support tickets. This is where MonkeyLearn proves indispensable. Elite analysts use it to extract keywords, classify topics, and perform sentiment analysis in minutes. Instead of manually coding NLP models, they rely on MonkeyLearn’s AI-driven automation to unlock meaning from text-heavy datasets. A company looking to understand thousands of customer complaints can gain actionable insights almost instantly, something that would otherwise take weeks of manual work.
Alteryx: Streamlining Workflows with AI
For analysts dealing with large and messy datasets, Alteryx is a game-changer. Its AI-powered workflow automation allows analysts to clean, prepare, and analyze data with drag-and-drop ease. But what makes it invaluable to top professionals is its ability to integrate predictive analytics directly into workflows. Elite analysts use Alteryx not just to save time, but to build smart, repeatable processes that scale. This frees them to focus on higher-level thinking—finding the “why” behind the numbers instead of wrestling with raw data.
Google Cloud Vertex AI: Scaling AI to Enterprise Levels
When it comes to enterprise-scale analytics, Google Cloud’s Vertex AI is the tool of choice for the top tier of analysts. It allows them to train and deploy machine learning models at scale, integrate pre-trained APIs for natural language processing and computer vision, and connect seamlessly with BigQuery to analyze massive datasets. For a retail analyst managing thousands of SKUs across multiple markets, Vertex AI provides demand forecasting that is both powerful and precise. The ability to scale AI across global datasets is what makes this platform indispensable for the elite.
Conclusion
The difference between a good analyst and a world-class one often comes down to how effectively they integrate AI into their daily work. The top 1% are not just skilled in analysis—they are skilled in choosing the right tools. ChatGPT helps them work faster, Power BI Copilot and Tableau Einstein allow them to tell richer stories, DataRobot accelerates machine learning, MonkeyLearn unlocks text data, Alteryx streamlines workflows, and Vertex AI delivers enterprise-level scale. Together, these tools give analysts a competitive edge that turns raw data into strategic power. If you want to step into the ranks of the top 1%, these are the tools to master today.
Advertisements
أدوات الذكاء الاصطناعي لنخبة محللي البيانات في العالم
Advertisements
مقدمة
في عالم تحليلات البيانات سريع التطور غالباً ما يكمن الفرق بين المحلل التقليدي والمحلل المصنف من بين أفضل 1% في الأدوات التي يستخدمونها، فبينما لا يزال العديد من المحترفين يعتمدون بشكل كبير على جداول البيانات ولوحات المعلومات الأساسية تُدمج النخبة من المحللين الذكاء الاصطناعي في سير عملهم، بحيث تُمكّنهم هذه الأدوات من العمل بشكل أسرع واكتشاف الأنماط التي يغفل عنها الآخرون وسرد قصص مُقنعة باستخدام البيانات، ما يميزهم عن غيرهم ليس فقط مهاراتهم بل أيضاً قدرتهم على تسخير الذكاء الاصطناعي كامتداد لخبرتهم
مساعد المحلل عند الطلب : ChatGPT
الشريك الأمثل للعديد من كبار المحللين ChatGPT سرعان ما أصبح
فبالإضافة إلى دوره الواضح كذكاء اصطناعي مُحادث
كمساعد برمجي ومساعد بحثي ChatGPT يعمل
وحتى رفيق في سرد قصص البيانات
SQL فبدلاً من قضاء ساعات في تصحيح أخطاء استعلامات
Python أو إعادة كتابة نصوص
لتسريع المهام التقنية ChatGPT يلجأ المحللون إلى
والأهم من ذلك أنه يُساعد في شرح المفاهيم الإحصائية بلغة واضحة وسهلة الفهم مما يُحوّل النتائج المعقدة إلى رؤى واضحة
ChatGPT فعلى سبيل المثال قد يعتمد المحلل المالي على
لإعادة تنسيق تقارير العملاء فوراً مما يوفر ساعات كان من الممكن قضاؤها في التحرير اليدوي
تحويل البيانات إلى قصص : Copilot مع Power BI
Power BI لطالما كان
من مايكروسوفت حجر الزاوية في استخبارات الأعمال
أصبح أكثر فعالية Copilot ولكن مع دمج
DAX لإنشاء صيغ Copilot يعتمد المحللون الآن على
من خلال مطالبات بسيطة وتلخيص لوحات معلومات كاملة وتقديم رؤى جاهزة للتنفيذيين تلقائياً، فبدلاً من إنشاء تقارير ثابتة يصمم المحللون المتميزون قصص بيانات تخاطب صانعي القرار مباشرةً
على تسريع العملية Copilot ولا يقتصر دور
فحسب بل يجعلها أكثر ذكاءً مما يُمكّن المحللين من التركيز على التفسير بدلاً من التنفيذ الفني
التنبؤ بمستقبل البيانات:Einstein AIمعTableau
في مجال التصور Tableau لطالما تميز
فإنه يوفر قدرات تنبؤية Einstein AI ولكن عند دمجه مع
تجعل المحللين متميزين، إذ يستخدمه نخبة المحترفين ليس فقط لعرض البيانات بشكل جميل بل أيضاً للتنبؤ بالاتجاهات واكتشاف الشذوذ وتشغيل استعلامات اللغة الطبيعية دون الحاجة لكتابة سطر واحد من التعليمات البرمجية، وعلى سبيل المثال قد يطلب محلل تسويق
Tableau من الذكاء الاصطناعي في
التنبؤ بمعدل فقدان العملاء ليحصل على توقعات دقيقة كانت تتطلب في السابق نمذجة معقدة
Tableau هذه القدرة على دمج التصور مع التنبؤ هي ما يجعل
سلاحاً سرياً لكبار المحللين
Advertisements
أتمتة التعلم الآلي بدقة : DataRobot
في حين كان بناء نماذج التعلم الآلي حكراً على علماء البيانات
DataRobot إلا أن أدوات مثل
جعلت العملية أكثر سهولة، بحيث يستخدمه كبار المحللين في العالم لبناء نماذج تنبؤية واختبارها ونشرها بسرعة دون التضحية بالدقة
أساسياً ليس الأتمتة فحسب بل أيضاً سهولة الشرح DataRobot ما يجعل
( فهو يساعد المحللين على فهم كيفية عمل النموذج والتواصل معه )
وتُعد هذه الشفافية أمراً بالغ الأهمية عندما يسأل المدراء التنفيذيون: ” لماذا يوصي النموذج بهذا القرار”؟
يمكن للمحللين توفير السرعة والوضوح DataRobot مع
استخلاص رؤى من نصوص غير منظمة : MonkeyLearn
البيانات ليست دائماً منظمة وتأتي بعض أغنى الرؤى من نصوص غير منظمة مثل تقييمات العملاء وردود الاستبيانات وتذاكر الدعم
MonkeyLearn وهنا تبرز أهمية
إذ يستخدمه محللون محترفون لاستخراج الكلمات المفتاحية وتصنيف المواضيع وإجراء تحليلات المشاعر في دقائق، فبدلاً من برمجة نماذج معالجة اللغة الطبيعية يدوياً
المدعومة بالذكاء الاصطناعي MonkeyLearn يعتمدون على أتمتة
لاستخلاص المعنى من مجموعات البيانات الغنية بالنصوص، إذ يمكن للشركة التي تسعى لفهم آلاف شكاوى العملاء الحصول على رؤى عملية على الفور تقريباً وهو أمر قد يستغرق أسابيع من العمل اليدوي
تبسيط سير العمل باستخدام الذكاء الاصطناعي : Alteryx
بالنسبة للمحللين الذين يتعاملون مع مجموعات بيانات كبيرة ومعقدة
أداةً ثورية Alteryx يُعد
إذ تتيح أتمتة سير العمل المدعومة بالذكاء الاصطناعي للمحللين تنظيف البيانات وإعدادها وتحليلها بسهولة السحب والإفلات، لكن ما يجعله لا يُقدّر بثمن بالنسبة لكبار المهنيين هو قدرته على دمج التحليلات التنبؤية مباشرةً في سير العمل، وعليه يستخدم المحللون المتميزون هذه الأداة ليس فقط لتوفير الوقت فحسب بل لبناء عمليات ذكية وقابلة للتكرار وقابلة للتوسع، وهذا يُتيح لهم التركيز على التفكير على مستوى أعلى إيجاد “السبب” وراء الأرقام بدلاً من التعامل مع البيانات الخام
Google Cloud Vertex AI
توسيع نطاق الذكاء الاصطناعي إلى مستويات المؤسسات
عندما يتعلق الأمر بالتحليلات على مستوى المؤسسات
Google Cloud من Vertex AI يُعد
الأداة المُفضلة لكبار المحللين، فهو يُمكّنهم من تدريب ونشر نماذج التعلم الآلي على نطاق واسع ودمج واجهات برمجة التطبيقات المُدربة مسبقاً لمعالجة اللغة الطبيعية والرؤية الحاسوبية
لتحليل مجموعات البيانات الضخمة BigQuery والاتصال بسلاسة مع
إذاً بالنسبة لمحللي التجزئة
(SKUs) الذين يُديرون آلاف وحدات التخزين
Vertex AI عبر أسواق مُتعددة يُوفر
تنبؤات قوية ودقيقة بالطلب
إن القدرة على توسيع نطاق الذكاء الاصطناعي عبر مجموعات البيانات العالمية هي ما يجعل هذه المنصة لا غنى عنها للنخبة
الخلاصة
غالباً ما يكمن الفرق بين محلل جيد ومحلل عالمي المستوى في مدى فعالية دمج الذكاء الاصطناعي في عملهم اليومي، إذ لا يقتصر تفوق الـ 1% على مهارة التحليل فحسب بل يتعداه إلى مهارة اختيار الأدوات المناسبة
على العمل بشكل أسرع ChatGPT يساعدهم
Tableau Einstein و Power BI Copilot ويتيح لهم
سرد قصص أكثر ثراءً
التعلم الآلي DataRobot ويُسرّع
تحليل البيانات النصية MonkeyLearn ويُتيح
سير العمل Alteryx ويُبسط
Vertex AI ويُتيح
توسعاً على مستوى المؤسسات، تمنح هذه الأدوات مجتمعةً المحللين ميزة تنافسية تُحوّل البيانات الخام إلى قوة استراتيجية، إذا كنت ترغب في الانضمام إلى صفوف الـ 1% فهذه هي الأدوات التي يجب إتقانها اليوم
A calendar is more than a way to track dates—it’s a powerful tool for analyzing patterns over time. In Power BI, building a dynamic calendar visual allows you to explore performance across days, weeks, months, and years in an interactive and visually appealing way.
In this guide, we’ll walk step by step through creating a professional dynamic calendar visualization in Power BI, supported with examples and DAX code.
1. Why Do You Need a Dynamic Calendar in Power BI?
Most reports rely heavily on the time dimension, but traditional charts often fail to highlight day-by-day patterns. A calendar visual helps you:
Spot distributions: Identify the busiest and slowest days at a glance.
Enable easy comparisons: Compare performance across weeks or months.
Deliver visual impact: Present data in a format users instantly understand.
example: An e-commerce store uses a dynamic calendar to see which days drive the most orders, helping the marketing team plan promotions strategically.
2. Create a Date Table
Before building the visual, you need a proper Date Table. You can generate one in Power BI using DAX:
Tip: Don’t forget to mark it as a Date Table in Power BI.
Advertisements
3. Build the Calendar Layout with Matrix Visual
Now let’s transform this into a calendar view using the Matrix visual:
Add a Matrix visual.
Place Month and Year on the rows.
Place Weekday on the columns.
Use Day or a measure (like total sales) in the values field.
The Matrix will now display your data in a grid resembling a calendar.
4. Make It Interactive
To turn the static calendar into an interactive tool:
Conditional formatting: Color cells based on values (e.g., green = high sales, red = low).
Slicers: Allow users to filter by year, month, or product.
Tooltips: Show detailed insights when hovering over a specific day.
Real-world example: A service company uses tooltips to display daily customer visits and revenue when hovering over a date.
5. Add Dynamic Measures
Measures make your calendar more insightful. For example, to calculate sales:
Total Sales = SUM(Sales[SalesAmount])
Or count daily orders:
Total Orders = COUNTROWS(Sales)
You can then display these measures inside the calendar, making each cell a mini insight point.
6. Enhance the Visual Design
To polish your calendar visualization:
Use Custom Visuals like Calendar by MAQ Software from AppSource.
Apply Themes that align with your company branding.
Add Year-over-Year comparisons for more advanced analytics.
Conclusion
Building a dynamic calendar visual in Power BI is not just about aesthetics—it’s about making time-based insights accessible and actionable. With a Date Table, a Matrix visual, and some interactivity, you can transform raw numbers into a calendar that tells a story.
Next time you design a Power BI report, try including a calendar visual—you’ll be surprised how much clarity it brings to your data.
Advertisements
Power BI من التواريخ إلى الرؤى – إنشاء تقويم تفاعلي في
Advertisements
مقدمة
التقويم ليس مجرد وسيلة لتتبع التواريخ، بل هو أداة فعّالة لتحليل الأنماط بمرور الوقت
: يتيح لك إنشاء عرض مرئي ديناميكي للتقويم Power BI ففي
استكشاف الأداء على مدار الأيام والأسابيع والأشهر والسنوات بطريقة تفاعلية وجذابة بصرياً
في هذا الدليل سنشرح خطوة بخطوة كيفية إنشاء عرض احترافي
DAX مدعوماً بأمثلة وأكواد Power BI للتقويم الديناميكي في
1. Power BIلماذا تحتاج إلى تقويم ديناميكي في
تعتمد معظم التقارير بشكل كبير على بُعد الوقت ولكن المخططات التقليدية غالباً ما تفشل في إبراز الأنماط اليومية، يساعدك عرض التقويم المرئي على
تحديد التوزيعات: تحديد الأيام الأكثر ازدحاماً والأبطأ في لمحة
تسهيل المقارنات: مقارنة الأداء على مدار الأسابيع أو الأشهر
تقديم تأثير بصري: عرض البيانات بتنسيق يفهمه المستخدمون فوراً
مثال: يستخدم متجر للتجارة الإلكترونية تقويماً ديناميكياً لمعرفة الأيام التي تشهد أكبر عدد من الطلبات مما يساعد فريق التسويق على التخطيط الاستراتيجي للحملات الترويجية
Matrix Visual لنحوّل الآن هذا إلى عرض تقويم باستخدام
Matrix Visual أضف
ضع الشهر والسنة في الصفوف
ضع يوم الأسبوع في الأعمدة
استخدم اليوم أو مقياساً (مثل إجمالي المبيعات) في حقل القيم
الآن بياناتك في شبكة تشبه التقويم Matrix ستعرض
مثال: تخطيط تقويم يعرض عدد الطلبات اليومية في عرض شهري
٤. اجعله تفاعلياً
لتحويل التقويم الثابت إلى أداة تفاعلية
التنسيق الشرطي: لوّن الخلايا بناءً على القيم (مثلاً: الأخضر = أعلى مبيعات، الأحمر = أقل مبيعات)
المُقسّمات: تسمح للمستخدمين بالتصفية حسب السنة أو الشهر أو المنتج
تلميحات الأدوات: عرض رؤى تفصيلية عند تمرير مؤشر الماوس فوق يوم محدد
مثال: تستخدم شركة خدمات تلميحات لعرض زيارات العملاء اليومية والإيرادات عند تمرير مؤشر الماوس فوق تاريخ معين
5. إضافة مقاييس ديناميكية
:تجعل المقاييس تقويمك أكثر دقة، فعلى سبيل المثال، لحساب المبيعات
Total Sales = SUM(Sales[SalesAmount])
: أو لحساب الطلبات اليومية
Total Orders = COUNTROWS(Sales)
يمكنك بعد ذلك عرض هذه المقاييس داخل التقويم مما يجعل كل خلية بمثابة نقطة إدراك صغيرة
6. تحسين التصميم المرئي
لتحسين عرض تقويمك: استخدم عناصر مرئية مخصصة
AppSource من MAQ Software من Calendar مثل
طبّق سمات تتوافق مع هوية شركتك
أضف مقارنات سنوية لتحليلات أكثر تقدماً
الخلاصة
Power BI لا يقتصر إنشاء عرض تقويم ديناميكي في
على الجانب الجمالي فحسب بل يهدف أيضاً إلى جعل الرؤى الزمنية في متناول الجميع وقابلة للتنفيذ، فباستخدام جدول بيانات وعرض مصفوفة وبعض التفاعل يمكنك تحويل الأرقام الخام إلى تقويم يروي قصة
Power BI في المرة القادمة التي تصمم فيها تقرير
جرّب تضمين عرض تقويم – ستندهش من مدى الوضوح الذي يُضفيه على بياناتك
In the world of data visualization, small details often make the biggest difference. One of the most powerful yet simple visuals in Power BI is the KPI card. It may look minimal, but when designed correctly, it can turn raw numbers into quick, actionable insights. In this article, I’ll walk you through how I created my best Power BI KPI card, the thought process behind it, and why it made such a strong impact on reporting and decision-making.
What is a KPI Card in Power BI?
A KPI card in Power BI is a visual element that highlights one key number—such as revenue, profit margin, or customer retention rate. It provides quick snapshots of performance without overwhelming users with too much detail.
Example: Instead of showing a whole sales report, a KPI card might just show “Monthly Sales: $120,000”, making it clear and easy to digest.
Why I Focused on Designing a Better KPI Card
When I started using Power BI, my KPI cards were plain—just numbers in a box. While functional, they didn’t tell a story or give enough context. I realized that a great KPI card should not only show a value but also:
Indicate progress toward a goal
Highlight changes over time
Use colors and icons to guide attention
For example, a sales KPI card showing $120,000 (up 15%) in green is much more insightful than just showing $120,000.
Steps I Took to Build My Best KPI Card
1. Choosing the Right Metric
I picked Net Profit Margin as the main KPI because it reflects both sales and costs, offering a balanced view of performance.
2. Adding Context with Targets
I set a target margin of 20%. Instead of just showing the current margin, the KPI card displayed:
Current Margin: 18%
Target: 20%
Status: Slightly below target
Advertisements
3. Using Conditional Formatting
I applied colors to quickly signal performance:
Green if margin ≥ 20%
Yellow if between 15–19%
Red if < 15%
This way, managers could immediately see performance without reading details.
4. Enhancing with Trend Indicators
I included an up/down arrow to show whether the margin improved compared to last month. A simple arrow added huge clarity.
Why This Card Became My Best
This KPI card stood out because it wasn’t just a number—it was a decision-making tool. Executives could glance at it and instantly know:
Current performance
How close we were to the goal
Whether we were improving or declining
It turned reporting into actionable insights, and that’s the ultimate goal of Power BI.
Real-Life Example
Imagine a retail company using this KPI card.
January Margin: 18% (red arrow down)
February Margin: 21% (green arrow up)
Within seconds, leadership knows that February outperformed expectations and that corrective actions taken in January worked.
Conclusion
A well-designed KPI card in Power BI is more than a simple number. It’s a visual story that provides clarity, direction, and impact. My best KPI card combined clear metrics, contextual targets, color coding, and trend indicators—transforming data into meaningful insights.
If you haven’t experimented with KPI cards yet, start small but design with purpose. A single card can be more powerful than a whole dashboard if done right.
Advertisements
Power BI في KPI كيف صممت أفضل بطاقة
Advertisements
مقدمة
في عالم تصور البيانات غالباً ما تُحدث التفاصيل الصغيرة فرقاً كبيراً
KPI إذ تُعد بطاقة مؤشرات الأداء الرئيسية
Power BI من أقوى العناصر المرئية وأكثرها بساطةً في
وهي قد تبدو بسيطة ولكن عند تصميمها بشكل صحيح يُمكنها تحويل الأرقام الخام إلى رؤى سريعة وقابلة للتنفيذ، وفي هذه المقالة سأشرح لكم
Power BI في KPI كيف صممتُ أفضل بطاقة
والعملية الفكرية وراءها ولماذا كان لها هذا التأثير القوي على إعداد التقارير واتخاذ القرارات
Bower BI فيKPIما هي بطاقة مؤشرات الأداء الرئيسية
Power BI في KPI بطاقة
هي عنصر مرئي يُبرز رقماً رئيسياً واحداً مثل الإيرادات أو هامش الربح أو معدل الاحتفاظ بالعملاء، فتُوفر البطاقة لمحات سريعة عن الأداء دون إثقال كاهل المستخدمين بتفاصيل كثيرة
مثال: بدلاً من عرض تقرير مبيعات كامل قد تعرض بطاقة مؤشرات الأداء الرئيسية ” المبيعات الشهرية : 120,000 دولار أمريكي” مما يجعلها واضحة وسهلة الفهم
لماذا ركزتُ على تصميم بطاقة مؤشرات أداء رئيسية أفضل؟
KPI كانت بطاقات Power BI عندما بدأتُ باستخدام
الخاصة بي بسيطة مجرد أرقام في مربع، وعلى الرغم من فعاليتها إلا أنها لم تسرد قصة أو تُقدم سياقاً كافياً، حينها أدركتُ أن بطاقة مؤشرات الأداء الرئيسية الفعّالة لا ينبغي أن تُظهر قيمةً فحسب بل ينبغي أيضاً أن تتضمن
• الإشارة إلى التقدم نحو هدف
• إبراز التغييرات بمرور الوقت
• استخدام الألوان والأيقونات لتوجيه الانتباه
على سبيل المثال: بطاقة مؤشرات أداء رئيسية للمبيعات تُظهر 120,000 دولار أمريكي (بزيادة 15%) باللون الأخضر تُعدّ أكثر ثراءً من مجرد إظهار 120,000 دولار أمريكي
Advertisements
الخطوات التي اتبعتها لإنشاء أفضل بطاقة مؤشرات أداء رئيسية
1. اختيار المقياس المناسب
اخترتُ هامش صافي الربح كمؤشر أداء رئيسي لأنه يعكس كلاً من المبيعات والتكاليف مما يُقدم رؤية متوازنة للأداء
2. إضافة سياق للأهداف
حددتُ هامش ربح مستهدفاً بنسبة 20% بدلاً من مجرد عرض الهامش الحالي، وعليه عرضت بطاقة مؤشر الأداء الرئيسي ما يلي
18% : الهامش الحالي
20% : الهدف
الحالة: أقل بقليل من الهدف
٣. استخدام التنسيق الشرطي
استخدمتُ ألواناً للإشارة بسرعة إلى الأداء
• ٪أخضر إذا كان الهامش ≥ ٢٠
• ٪ أصفر إذا كان بين ١٥٪ و١٩
• أحمر إذا كان أقل من ٪١٥
بهذه الطريقة تمكن المدراء من رؤية الأداء فوراً دون الحاجة إلى قراءة التفاصيل
٤. التحسين باستخدام مؤشرات الاتجاه
أضفتُ سهماً لأعلى/لأسفل لإظهار ما إذا كان الهامش قد تحسن مقارنةً بالشهر الماضي، بحيث أضاف سهم بسيط وضوحاً كبيراً
لماذا أصبحت هذه البطاقة هي الأفضل بالنسبة لي؟
برزت بطاقة مؤشر الأداء الرئيسي هذه لأنها لم تكن مجرد رقم بل كانت أداة لاتخاذ القرارات، فيمكن للمديرين التنفيذيين إلقاء نظرة سريعة عليها ومعرفة ما يلي
• الأداء الحالي
• مدى قربنا من الهدف
• ما إذا كنا نتحسن أم نتراجع
لقد حوّلت التقارير إلى رؤى عملية
Power BI وهذا هو الهدف الرئيسي لدى
: مثال
تخيل شركة تجزئة تستخدم بطاقة مؤشرات الأداء الرئيسية هذه
• هامش يناير: ١٨٪ (سهم أحمر للأسفل)
• هامش فبراير: ٢١٪ (سهم أخضر للأعلى)
في غضون ثوانٍ تُدرك القيادة أن أداء فبراير فاق التوقعات وأن الإجراءات التصحيحية المتخذة في يناير نجحت
:الخلاصة
Power BI بطاقة مؤشرات الأداء الرئيسية المُصممة جيداً في
هي أكثر من مجرد رقم بسيط، إنها قصة بصرية تُقدم الوضوح والتوجيه والتأثير، أفضل بطاقة مؤشرات أداء رئيسية لديّ جمعت بين مقاييس واضحة وأهداف سياقية وترميز ألوان ومؤشرات اتجاهات مما يُحوّل البيانات إلى رؤى قيّمة
إذا لم تُجرّب بطاقات مؤشرات الأداء الرئيسية بعد فابدأ بمشاريع صغيرة ولكن صمّمها بهدف، فبطاقة واحدة يُمكن أن تكون أقوى من لوحة معلومات كاملة إذا تم تنفيذها بشكل صحيح
When people hear “machine learning,” they often imagine advanced algorithms, massive datasets, and futuristic applications. But at the heart of all of this lies a very old discipline: mathematics.
It is the language that powers every neural network, regression model, and recommendation system. Many learners feel intimidated because they think they need to master every single branch of math. The truth is, you don’t — you only need to focus on the specific areas that drive machine learning forward.
This article will guide you step by step through the math you need, why it matters, and how to actually learn it without getting lost.
1. Linear Algebra: The Language of Data
Linear algebra forms the foundation of machine learning. Data in machine learning is often represented as vectors and matrices. For example, a grayscale image can be thought of as a matrix where each element corresponds to the brightness of a pixel. When you feed that image into a machine learning model, it performs matrix operations to detect patterns such as edges, shapes, and textures.
To get comfortable, focus on the basics: vectors, matrices, matrix multiplication, dot products, and eigenvalues. Once you understand these, you’ll see why every deep learning library (like TensorFlow or PyTorch) is essentially a giant machine for matrix operations.
Real-life example: When Netflix recommends movies, it uses linear algebra to represent both users and movies in a shared space. By comparing the “distance” between your vector and a movie’s vector, the system decides whether to recommend it.
2. Calculus: The Engine of Learning
While linear algebra structures the data, calculus drives the learning process. Machine learning models improve themselves by minimizing error — and that is achieved through derivatives and gradients.
For instance, the popular Gradient Descent algorithm is simply an application of calculus. By taking the derivative of the loss function with respect to model parameters, the algorithm knows which direction to move to reduce errors. You don’t need to master every integration trick, but you should feel comfortable with derivatives, partial derivatives, and gradients.
Real-life example: Imagine training a self-driving car’s vision system. The model makes a mistake identifying a stop sign. Gradient Descent kicks in, adjusting the model’s internal parameters (weights) slightly so that next time, the probability of recognizing the stop sign is higher. That entire process is powered by calculus.
3. Probability and Statistics: The Logic of Uncertainty
Machine learning is about making predictions under uncertainty, and that’s exactly where probability and statistics come in. Without them, you can’t evaluate models, understand error rates, or deal with randomness in data.
Key concepts include probability distributions, expectation, variance, conditional probability, and hypothesis testing. These tools help you answer questions like: How confident is the model in its prediction? Is this result meaningful, or just random noise?
Real-life example: In spam detection, a model doesn’t “know” for sure if an email is spam. Instead, it assigns a probability, such as 95% spam vs. 5% not spam. That probability comes from statistical modeling and probability theory.
Advertisements
4. Optimization: The Art of Improvement
Every machine learning model has one ultimate goal: optimization. Whether it’s minimizing the error in predictions or maximizing the accuracy of classification, optimization ensures the model keeps getting better.
Basic optimization concepts include cost functions, convexity, constraints, and gradient-based optimization methods. Even complex deep learning boils down to solving optimization problems efficiently.
Real-life example: Support Vector Machines (SVMs), one of the classic ML algorithms, rely entirely on optimization to find the best decision boundary between two classes. Without optimization, the algorithm wouldn’t know which boundary is the “best.”
5. Discrete Math and Logic: The Algorithmic Backbone
Though sometimes overlooked, discrete mathematics provides the foundation for algorithms and data structures — both critical in machine learning. Concepts like sets, combinatorics, and graph theory help us design efficient models and handle structured data.
Real-life example: Decision trees, widely used in machine learning, depend heavily on concepts from discrete math. They split data based on logical conditions and count possible outcomes — exactly the kind of reasoning that discrete math teaches.
How to Learn Efficiently
Start small, but stay consistent. Pick one math topic and dedicate short daily sessions to it.
Apply while you learn. Don’t study math in isolation. Code small ML models in Python to see concepts like gradients or matrices in action.
Use visual resources. Channels like 3Blue1Brown make abstract concepts like eigenvectors and gradient descent easy to grasp visually.
Practice problems. Work through exercises, not just theory. Solving problems cements your understanding.
Conclusion
You don’t need to be a mathematician to succeed in machine learning, but you do need the right mathematical foundations. Focus on linear algebra for data representation, calculus for learning dynamics, probability and statistics for handling uncertainty, optimization for model improvement, and discrete math for algorithmic thinking. When you learn these topics gradually and connect them to coding practice, math stops being an obstacle and becomes your greatest ally in building powerful machine learning models.
Advertisements
إتقان الرياضيات للتعلم الآلي
دليل خطوة بخطوة
Advertisements
مقدمة
عندما يسمع الناس عن “التعلم الآلي” غالباً ما يتخيلون خوارزميات متقدمة ومجموعات بيانات ضخمة وتطبيقات مستقبلية، لكن في جوهر كل هذا يمكن تلخيص الموضوع باختصاص شامل : الرياضيات
إنها اللغة التي تُشغّل كل شبكة عصبية ونموذج انحدار ونظام توصية، إذ يشعر العديد من المتعلمين بالرهبة لأنهم يعتقدون أنهم بحاجة إلى إتقان كل فرع من فروع الرياضيات لكن الحقيقة ليست كذلك، فما عليك سوى التركيز على المجالات المحددة التي تُمكّن التعلم الآلي من التقدم
سترشدك هذه المقالة خطوة بخطوة خلال الرياضيات التي تحتاجها وأهميتها وكيفية تعلمها فعلياً دون أن تضيع
1. الجبر الخطي: لغة البيانات
يُشكّل الجبر الخطي أساس التعلم الآلي، فغالباً ما تُمثّل البيانات في التعلم الآلي كمتجهات ومصفوفات، فعلى سبيل المثال يمكن اعتبار صورة تدرج الرمادي مصفوفة حيث يُقابل كل عنصر سطوع بكسل، وعند إدخال تلك الصورة في نموذج تعلّم آلي يُجري عمليات مصفوفة لاكتشاف أنماط مثل الحواف والأشكال والقوام للتعود على الأساسيات ركّز على المتجهات والمصفوفات وضرب المصفوفات وحاصل الضرب النقطي والقيم الذاتية، فبمجرد فهمك لهذه الأساسيات ستدرك لماذا تُعدّ كل مكتبة تعلّم عميق
PyTorch أو TensorFlow :مثل
في جوهرها آلة عملاقة لعمليات المصفوفات
: وعلى سبيل المثال
بأفلام Netflix عندما تُوصي
فإنها تستخدم الجبر الخطي لتمثيل كلٍّ من المستخدمين والأفلام في مساحة مشتركة بمقارنة “المسافة” بين متجهك ومتجه الفيلم يُقرر النظام ما إذا كان سيُوصي به أم لا
2. التفاضل والتكامل: محرك التعلم
بينما يُنظّم الجبر الخطي البيانات يُحرّك التفاضل والتكامل عملية التعلم، إذ تُحسّن نماذج تعلّم الآلة نفسها من خلال تقليل الأخطاء ويتحقق ذلك من خلال المشتقات والتدرجات
على سبيل المثال: خوارزمية الانحدار التدرجي الشائعة هي ببساطة تطبيق للتفاضل والتكامل، فبأخذ مشتقة دالة الخسارة بالنسبة لمعلمات النموذج تعرف الخوارزمية الاتجاه الذي يجب أن تتحرك فيه لتقليل الأخطاء، إذاً لستَ بحاجة إلى إتقان جميع حيل التكامل ولكن يجب أن تكون مُلِماً بالمشتقات والمشتقات الجزئية والتدرجات
ومثالنا على ذلك: تخيّل تدريب نظام رؤية لسيارة ذاتية القيادة يرتكب النموذج خطأً في تحديد إشارة توقف، يبدأ الانحدار التدريجي مع تعديل المعلمات الداخلية للنموذج (الأوزان) قليلاً بحيث يكون احتمال التعرف على إشارة التوقف في المرة القادمة أعلى، تعتمد هذه العملية برمتها على حساب التفاضل والتكامل
3. الاحتمالات والإحصاء: منطق عدم اليقين
يتعلق التعلم الآلي بالتنبؤات في ظل التفاوت بين الشك واليقين، وهنا تحديداً يأتي دور الاحتمالات والإحصاء، فبدونهما لا يمكنك تقييم النماذج أو فهم معدلات الخطأ أو التعامل مع العشوائية في البيانات
تشمل المفاهيم الرئيسية توزيعات الاحتمالات والتوقع والتباين والاحتمال الشرطي واختبار الفرضيات، إذ تساعدك هذه الأدوات في الإجابة على أسئلة مثل: ما مدى ثقة النموذج في تنبؤاته؟ هل هذه النتيجة ذات معنى أم أنها مجرد ضوضاء عشوائية؟
مثال: في عملية اكتشاف البريد العشوائي لا “يتأكد” النموذج من كون البريد الإلكتروني بريداً عشوائياً، فبدلاً من ذلك يُحدد احتمالاً مثل 95% بريد عشوائي مقابل 5% ليس بريداً عشوائياً ، يأتي هذا الاحتمال من النمذجة الإحصائية ونظرية الاحتمالات
Advertisements
4. فن التحسين
لكل نموذج تعلم آلي هدف نهائي واحد: التحسين، فسواء كان ذلك تقليل الخطأ في التنبؤات أو زيادة دقة التصنيف إلى أقصى حد فإن التحسين يضمن استمرار تحسن النموذج
تشمل مفاهيم التحسين الأساسية دوال التكلفة والتحدب والقيود وطرق التحسين القائمة على التدرج، حتى التعلم العميق المعقد يتلخص في حل مشاكل التحسين بكفاءة فعلي سبيل المثال
SVMs إن آلات دعم المتجهات
وهي إحدى خوارزميات التعلم الآلي الكلاسيكية تعتمد كلياً على التحسين لإيجاد أفضل حدود القرار بين فئتين، فبدون التحسين لن تعرف الخوارزمية أي الحدود “الأفضل”
٥. الرياضيات المنفصلة والمنطق: العمود الفقري للخوارزميات
على الرغم من إغفالها أحياناً تُوفر الرياضيات المنفصلة الأساس للخوارزميات وهياكل البيانات وكلاهما أساسي في التعلم الآلي، بحيث تساعدنا مفاهيم مثل المجموعات والتوافقيات ونظرية الرسوم البيانية في تصميم نماذج فعّالة ومعالجة البيانات المُهيكلة
مثال من الحياة الواقعية: تعتمد أشجار القرار المُستخدمة على نطاق واسع في التعلم الآلي بشكل كبير على مفاهيم من الرياضيات المنفصلة، فهي تُقسّم البيانات بناءً على الشروط المنطقية وتُحصي النتائج المُحتملة وهو بالضبط نوع التفكير الذي تُعلّمه الرياضيات المنفصلة
كيفية التعلم بكفاءة
ابدأ بخطوات صغيرة ولكن حافظ على الاتساق، اختر موضوعاً رياضياً واحداً وخصص له جلسات يومية قصيرة *
طبّق ما تعلمته أثناء الدرس ولا تدرس الرياضيات بمعزل عن غيرها، ثم برمج نماذج تعلم آلي صغيرة باستخدام بايثون لرؤية مفاهيم مثل التدرجات أو المصفوفات عملياً
استخدم الموارد البصرية *
تجعل المفاهيم المجردةBlue1Brown3قنوات مثل
مثل المتجهات الذاتية وانحدار التدرج سهلة الفهم بصرياً
تدرب على حل المسائل، حلّ التمارين وليس فقط النظريات، فحل المسائل يعزز فهمك *
الخلاصة
لست بحاجة إلى أن تكون عالم رياضيات لتنجح في التعلم الآلي ولكنك تحتاج إلى الأسس الرياضية الصحيحة، ركّز على الجبر الخطي لتمثيل البيانات وحساب التفاضل والتكامل لتعلم الديناميكيات والاحتمالات والإحصاء لمعالجة عدم اليقين والتحسين لتحسين النماذج والرياضيات المنفصلة للتفكير الخوارزمي، فعندما تتعلم هذه المواضيع تدريجياً وتربطها بممارسة البرمجة تتوقف الرياضيات عن كونها عائقاً وتصبح حليفك الأكبر في بناء نماذج تعلم آلي فعّالة
In 2025, Artificial Intelligence is no longer just a buzzword—it’s a goldmine for career growth. Companies across tech, finance, healthcare, and even creative industries are willing to pay $120K to $200K+ for professionals with the right AI skills. But here’s the truth: having just AI knowledge isn’t enough. Employers want proof you can apply it—and that’s where top-tier AI certifications come in.
These credentials not only validate your expertise but also give you a competitive edge in a job market that’s moving faster than ever. In this article, we’ll break down the best AI certifications to land you a high-paying role in 2025, plus real-world salary examples to show their impact.
1. Google Professional Machine Learning Engineer
1. Google Professional Machine Learning Engineer
Why It’s Worth It: Offered by Google Cloud, this certification focuses on designing, building, and deploying ML models at scale. It’s highly respected because it tests your real-world problem-solving skills, not just theory.
Average Salary: $150K–$180K+ Key Skills Covered:
ML pipeline design and optimization
Google Cloud AI tools (Vertex AI, BigQuery ML)
Model deployment and monitoring
Example: A certified ML engineer at a fintech startup earned a $40K raise within six months after getting this credential.
2. Microsoft Certified: Azure AI Engineer Associate
Why It’s Worth It: Microsoft’s Azure platform powers thousands of AI-driven applications worldwide. This certification ensures you can design AI solutions using Azure Cognitive Services, Language Understanding (LUIS), and Computer Vision.
Average Salary: $140K–$165K+ Key Skills Covered:
Building chatbots and NLP models
Deploying AI solutions in the cloud
Integrating AI with enterprise apps
Example: A mid-level developer transitioned into an AI engineer role with a $30K salary jump after earning this cert.
Advertisements
3. IBM AI Engineering Professional Certificate (Coursera)
Why It’s Worth It: A beginner-to-intermediate track that’s perfect if you want hands-on exposure to AI and ML using Python, Scikit-learn, and TensorFlow. Recognized globally due to IBM’s brand reputation.
Average Salary: $120K–$150K+ Key Skills Covered:
Machine learning fundamentals
Deep learning with Keras and PyTorch
AI application deployment
Example: A data analyst used this cert to switch to AI project management, boosting income by 45%.
4. AWS Certified Machine Learning – Specialty
Why It’s Worth It: Amazon Web Services dominates the cloud market, and this certification proves you can build and deploy ML models using AWS SageMaker, Rekognition, and Comprehend.
Average Salary: $155K–$200K+ Key Skills Covered:
Data engineering for ML
Model training and tuning
AI-driven automation
Example: A senior developer became a cloud AI consultant post-certification and now bills $150/hour.
Why It’s Worth It: Taught by Andrew Ng, this program is a global benchmark for AI education. While not a “vendor” certification, it opens doors to research and product innovation roles.
Average Salary: $140K–$175K+ Key Skills Covered:
Core ML algorithms
Neural networks
Real-world AI deployment strategies
Example: A startup co-founder used this credential to attract investors by showcasing technical credibility.
Pro Tips for Choosing the Right Certification
Match with your career goal: Cloud AI certs (AWS, Azure, Google) are great for deployment-heavy roles, while academic certs (Stanford, IBM) suit research or product innovation paths.
Check employer demand: Use LinkedIn or Indeed to see which certifications appear most in job postings.
Leverage your background: If you already know Python and data analysis, go for intermediate/advanced tracks; beginners should start with foundational certs.
Conclusion
AI is not just the future—it’s the present. With the right certification, you can break into a high-paying career, shift to a more in-demand role, or even launch your own AI-powered startup. The key is choosing a certification that aligns with your skills and ambitions, then applying it to solve real-world problems.
Your next step? Pick one of the certifications above, commit to the training, and let 2025 be the year your career skyrockets.
AI Certification Comparison Table (2025)
Certification
Provider
Cost (Approx.)
Duration
Key Skills
Avg. Salary After Completion
Google Professional Machine Learning Engineer
Google Cloud
$200 USD (exam fee)
3–6 months prep
ML pipeline design, Google Cloud AI tools, deployment
$150K–$180K+
Microsoft Certified: Azure AI Engineer Associate
Microsoft
$165 USD (exam fee)
2–4 months prep
Azure Cognitive Services, NLP, Computer Vision
$140K–$165K+
IBM AI Engineering Professional Certificate
IBM (via Coursera)
$39/month subscription
4–6 months
Python, Deep Learning, Scikit-learn, PyTorch
$120K–$150K+
AWS Certified Machine Learning – Specialty
Amazon Web Services
$300 USD (exam fee)
4–7 months prep
AWS SageMaker, AI-driven automation, model tuning
$155K–$200K+
Machine Learning Specialization
Stanford University (Andrew Ng)
$79/month (Coursera)
3–5 months
Core ML algorithms, neural networks, real-world AI
$140K–$175K+
Advertisements
شهادات الذكاء الاصطناعي التي تضمن رواتب عالية هذا العام
Advertisements
مقدمة
في عام ٢٠٢٥ لم يعد الذكاء الاصطناعي مجرد مصطلح شائع بل أصبح منجماً ذهبياً للنمو المهني، فالشركات في قطاعات التكنولوجيا والمالية والرعاية الصحية وحتى الصناعات الإبداعية مستعدة لدفع مبالغ تتراوح بين ١٢٠ ألف دولار و٢٠٠ ألف دولار أمريكي للمتخصصين ذوي المهارات المناسبة في مجال الذكاء الاصطناعي، ولكن الحقيقة هي أن امتلاك المعرفة بالذكاء الاصطناعي وحده لا يكفي، فأصحاب العمل يريدون إثباتاً على قدرتهم على تطبيق هذه المعرفة وهنا يأتي دور شهادات الذكاء الاصطناعي المرموقة
لا تُثبت هذه الشهادات خبرتك فحسب بل تمنحك أيضاً ميزة تنافسية في سوق عمل يشهد تطوراً متسارعاً
في هذا المقال سنستعرض أفضل شهادات الذكاء الاصطناعي التي تضمن لك وظيفة براتب مرتفع في عام ٢٠٢٥ قد يصل إلى مئات الآلاف من الدولارات بالإضافة إلى أمثلة واقعية على الرواتب لتوضيح تأثيرها
١. مهندس تعلم الآلة المحترف من جوجل
لماذا تستحق هذه الشهادة العناء ؟
تُقدم هذه الشهادة من جوجل كلاود وتُركز على تصميم وبناء ونشر نماذج تعلم الآلة على نطاق واسع إذ تحظى هذه الشهادة باحترام كبير لأنها تختبر مهاراتك في حل المشكلات العملية وليس النظرية فقط
متوسط الراتب: ١٥٠ ألف دولار أمريكي – ١٨٠ ألف دولار أمريكي فأكثر
:المهارات الرئيسية المشمولة
تصميم وتحسين خط أنابيب التعلم الآلي *
Google Cloud أدوات الذكاء الاصطناعي من *
نشر النماذج ومراقبتها *
مثال: حصل مهندس تعلم آلي معتمد في شركة ناشئة في مجال التكنولوجيا المالية على زيادة قدرها ٤٠ ألف دولار أمريكي خلال ستة أشهر من حصوله على هذه الشهادة
2. Azureشهادة مايكروسوفت المعتمدة: مهندس ذكاء اصطناعي مساعد في
ما أهمية هذه الشهادة ؟
آلاف التطبيقات Microsoft من Azure تدعم منصة
التي تعتمد على الذكاء الاصطناعي حول العالم، بحيث تضمن لك هذه الشهادة القدرة على تصميم حلول الذكاء الاصطناعي
المعرفية Azure باستخدام خدمات
والرؤية الحاسوبية LUIS وفهم اللغة
متوسط الراتب: ١٤٠ ألف دولار أمريكي – ١٦٥ ألف دولار أمريكي فأكثر
:المهارات الرئيسية المشمولة
بناء روبوتات الدردشة ونماذج معالجة اللغة الطبيعية *
نشر حلول الذكاء الاصطناعي في السحابة *
دمج الذكاء الاصطناعي مع تطبيقات المؤسسات *
مثال: انتقل مطور متوسط المستوى إلى وظيفة مهندس ذكاء اصطناعي وراتبه ارتفع بمقدار ٣٠ ألف دولار أمريكي بعد حصوله على هذه الشهادة
Advertisements
3. الاحترافية في هندسة الذكاء الاصطناعي (كورسيرا)IBMشهادة
لماذا تستحق الدراسة ؟ مسار من المستوى المبتدئ إلى المتوسط، مثالي إذا كنت ترغب في اكتساب خبرة عملية في الذكاء الاصطناعي والتعلم الآلي
TensorFlow و Scikit-learn باستخدام بايثون و
التجارية IBM معترف به عالمياً بفضل سمعة
متوسط الراتب: ١٢٠ ألف دولار أمريكي – ١٥٠ ألف دولار أمريكي فأكثر
:المهارات الرئيسية المشمولة
أساسيات تعلم الآلة *
PyTorch و Keras التعلم العميق باستخدام *
نشر تطبيقات الذكاء الاصطناعي *
مثال: استخدم محلل بيانات هذه الشهادة للانتقال إلى إدارة مشاريع الذكاء الاصطناعي، مما زاد دخله بنسبة %٤٥
4. المعتمدة في تعلم الآلة – تخصصAWSشهادة
لماذا تستحق العناء؟
على سوق الحوسبة السحابية Amazon Web Services تهيمن
وتثبت هذه الشهادة قدرتك على بناء ونشر نماذج تعلم الآلة
Comprehend و Rekognition و AWS SageMaker باستخدام
متوسط الراتب: ١٥٥ ألف دولار أمريكي – ٢٠٠ ألف دولار أمريكي فأكثر
:المهارات الرئيسية المشمولة
هندسة البيانات لتعلم الآلة *
تدريب النماذج وضبطها *
الأتمتة المعتمدة على الذكاء الاصطناعي *
مثال: أصبح مطور كبير مستشاراً في مجال الذكاء الاصطناعي السحابي بعد حصوله على الشهادة ويتقاضى الآن ١٥٠ دولاراً أمريكياً في الساعة
٥. تخصص تعلم الآلة في جامعة ستانفورد
لماذا يستحق الدراسة ؟
Andrew Ng يُدرّس هذا البرنامج
وهو معيار عالمي في تعليم الذكاء الاصطناعي
vendor ورغم أنه ليس شهادة
إلا أنه يفتح آفاقاً واسعة لوظائف البحث وابتكار المنتجات
متوسط الراتب: ١٤٠ ألف دولار أمريكي – ١٧٥ ألف دولار أمريكي فأكثر
:المهارات الرئيسية
خوارزميات تعلم الآلة الأساسية *
الشبكات العصبية *
استراتيجيات نشر الذكاء الاصطناعي في العالم الحقيقي *
مثال: استخدم أحد مؤسسي شركة ناشئة هذه الشهادة لجذب المستثمرين من خلال إبراز مصداقيته التقنية
لمعرفة الشهادات الأكثر ظهوراً Indeed أو LinkedIn استخدم
في إعلانات الوظائف
:استفد من خبرتك
إذا كنتَ مُلِماً بلغة بايثون وتحليل البيانات، فاختر مساراتٍ متوسطة /متقدمة ، أما المبتدئون فعليهم البدء بشهاداتٍ أساسية
:الخلاصة
الذكاء الاصطناعي ليس مجرد مستقبل بل هو الحاضر، فمع الشهادة المناسبة يمكنكَ اقتحام مهنةٍ براتبٍ عالٍ أو الانتقال إلى وظيفةٍ مطلوبةٍ أكثر أو حتى إطلاق مشروعك الخاص المُدعّم بالذكاء الاصطناعي يكمن السر في اختيار شهادةٍ تُناسب مهاراتك وطموحاتك ثم تطبيقها لحل مشاكل العالم الحقيقي
خطوتك التالية : اختر إحدى الشهادات المذكورة أعلاه والتزم بالتدريب واجعلها انطلاقة قوية في مسيرتك المهنية
AI Certification Comparison Table (2025)
Certification
Provider
Cost (Approx.)
Duration
Key Skills
Avg. Salary After Completion
Google Professional Machine Learning Engineer
Google Cloud
$200 USD (exam fee)
3–6 months prep
ML pipeline design, Google Cloud AI tools, deployment
$150K–$180K+
Microsoft Certified: Azure AI Engineer Associate
Microsoft
$165 USD (exam fee)
2–4 months prep
Azure Cognitive Services, NLP, Computer Vision
$140K–$165K+
IBM AI Engineering Professional Certificate
IBM (via Coursera)
$39/month subscription
4–6 months
Python, Deep Learning, Scikit-learn, PyTorch
$120K–$150K+
AWS Certified Machine Learning – Specialty
Amazon Web Services
$300 USD (exam fee)
4–7 months prep
AWS SageMaker, AI-driven automation, model tuning
$155K–$200K+
Machine Learning Specialization
Stanford University (Andrew Ng)
$79/month (Coursera)
3–5 months
Core ML algorithms, neural networks, real-world AI
If you’ve ever stared at rows of messy data in a CSV file and felt overwhelmed, you’re not alone. Like many newcomers to data analysis, I once struggled with cleaning, transforming, and analyzing datasets—until I discovered the true power of Pandas, Python’s go-to data manipulation library. In this article, I’ll walk you through the data workflow I wish I had known when I first started. Whether you’re a beginner or someone who’s used Pandas but still feels stuck, this guide will make your data tasks smoother and more intuitive.
1. Start with the Right Mindset: Think in DataFrames
When I first learned Pandas, I treated it like a spreadsheet with some coding on top. Big mistake. I would manipulate lists or dictionaries and use Pandas only occasionally. It wasn’t until I fully embraced the DataFrame as my primary data structure that things started making sense.
The moment everything clicked was when I started thinking in DataFrames—as in, blocks of data that you manipulate with chainable methods. Imagine each operation as a transformation on a flowing river of data, rather than discrete manual edits. This mental shift makes complex operations easier to reason through and structure logically.
Pro Tip: Always load your data into a DataFrame, not a list, dict, or array, unless you absolutely have to.
2. Cleaning is Not Optional (But It’s Easier Than You Think)
Data rarely comes clean. It usually arrives with missing values, duplicates, inconsistent types, or poorly named columns. If you skip this step, you’ll run into problems down the line when performing analysis.
The workflow I now follow (and recommend) is:
Check data types to understand what you’re dealing with
Handle missing values to prevent errors
Remove duplicates to avoid skewed results
Normalize column names for readability and easier access
Pandas makes this easy and consistent, especially once you get familiar with the basic syntax.
These simple commands can clean up even the messiest CSV files.
3. Use Chaining for Readable, Efficient Code3. Use Chaining for Readable, Efficient Code
Instead of assigning intermediate results to new variables and cluttering your notebook or script, Pandas allows for method chaining. This style improves both readability and maintainability of your code.
When you chain methods, each step is like a filter or transformer in a pipeline. You can clearly see what’s happening to the data at each point. It reduces the cognitive load and removes the need for multiple temporary variables.
By chaining, your logic stays close together and easy to trace.
4. Master the Power Trio: groupby(), agg(), and pivot_table()
Once your data is clean, analysis becomes a breeze if you master these three powerful tools: groupby(), agg(), and pivot_table(). They are the backbone of summary statistics, trend spotting, and dimensional analysis.
GroupBy lets you split your data into groups and apply computations on each group.
Agg lets you define multiple aggregation functions like sum, mean, count, etc.
Pivot tables reshape your data for cross-comparisons across categories.
These are key steps to go from raw data to valuable insight.
You’ll use these in nearly every project, so it’s worth getting comfortable with them early.
Advertisements
5. Visualize Early, Not Late
Pandas integrates smoothly with Matplotlib and Seaborn, two of the most popular Python plotting libraries. Rather than waiting until the end of your analysis, it’s often smarter to visualize as you go.
Early plotting helps catch outliers, understand distributions, and spot anomalies or trends. You don’t need fancy dashboards—even a simple histogram or line chart can provide key insights that numbers alone can’t.
Making visualization part of your standard workflow will greatly improve your understanding of the data.
6. Export Your Final Output Like a Pro
After cleaning, analyzing, and visualizing your data, you need to share or store the results. Pandas makes it effortless to export your DataFrame in various formats.
Exporting your data isn’t just about saving your work—it’s about creating reusable, shareable assets for collaborators or clients. Whether it’s a clean CSV or a styled Excel file, always include this final step.
Don’t let your insights live only in your notebook—get them out there.
7. Automate Repetitive Tasks
If you notice you’re repeating the same steps across projects or datasets, it’s time to automate. This can be as simple as creating a reusable function or as advanced as building an entire pipeline script.
Functions help encapsulate logic and make your code modular. It also makes onboarding easier when sharing your work with teammates or revisiting it months later.
Start small, and automate more as you go.
Conclusion: Pandas Is a Superpower, Once You Master the Flow
At first, Pandas felt clunky to me—too many functions, too many options. But once I embraced the data workflow mindset—clean, chain, group, visualize, export—it all made sense.
If you’re new to Pandas, don’t try to memorize every method. Instead, focus on the workflow. Build your foundation around practical tasks, and Pandas will become your favorite tool in no time.
Bonus Cheat Sheet: My Go-To Workflow
read_csv()
df.info(), df.describe()
dropna(), drop_duplicates()
assign(), query()
groupby(), agg(), pivot_table()
plot()
to_csv() or to_excel()
Advertisements
طريقة عملي مع البيانات إلى الأبدPandasكيف غيّرت
Advertisements
إذا سبق لك أن حدقت في صفوف
CSV من البيانات غير المرتبة في ملف
وشعرت بالإرهاق فأنت لست وحدك، وكالعديد من المبتدئين في تحليل البيانات واجهتُ صعوبةً في تنظيف مجموعات البيانات وتحويلها وتحليلها
Pandas حتى اكتشفتُ القوة الحقيقية لـ
مكتبة بايثون المُفضلة لمعالجة البيانات، وفي هذه المقالة سأشرح لك سير عمل البيانات الذي كنت أتمنى لو عرفته عندما بدأتُ
Pandas سواءً كنتَ مبتدئاً أو شخصاً استخدم
ولكنه لا يزال يشعر بالتعثر سيجعل هذا الدليل مهامك المتعلقة بالبيانات أكثر سلاسةً وبديهية
1. DataFrames ابدأ بعقلية صحيحة: فكّر في
لأول مرة Pandas عندما تعلمتُ
تعاملتُ معه كجدول بيانات مُضاف إليه بعض الأكواد البرمجية، وهذا كان خطأً فادحاً، إذ كنتُ أتعامل مع القوائم أو القواميس
من حين لآخر فقط Pandas وأستخدم
DataFrame ولم أبدأ في فهم الأمور إلا بعد أن اعتمدتُ
بالكامل كهيكل بياناتي الأساسي، كانت اللحظة التي أدركت فيها كل شيء هي اللحظة التي بدأت فيها التفكير في أطر البيانات – أي كتل البيانات التي تُعالج بطرق متسلسلة، تخيل كل عملية كتحويل على سيل متدفق من البيانات بدلاً من عمليات التحرير اليدوية المنفصلة، هذا التحول الفكري يُسهّل فهم العمليات المعقدة وهيكلتها منطقياً
DataFream نصيحة احترافية: حمّل بياناتك دائماً في
وليس قائمة أو قاموس أو مصفوفة إلا إذا كنتَ مضطراً لذلك
2. التنظيف ليس اختيارياً (ولكنه أسهل مما تظن)
نادراً ما تكون البيانات سليمة، فعادةً ما تصل بقيم ناقصة أو بيانات مكررة أو أنواع غير متسقة أو أعمدة بأسماء غير صحيحة، فإذا تخطيتَ هذه الخطوة فستواجه مشاكل لاحقاً عند إجراء التحليل
:سير العمل الذي أتبعه الآن (وأوصي به) هو
التحقق من أنواع البيانات لفهم ما تتعامل معه *
معالجة القيم المفقودة لتجنب الأخطاء *
إزالة التكرارات لتجنب النتائج غير الدقيقة *
توحيد أسماء الأعمدة لسهولة القراءة وسهولة الوصول *
هذا الأمر ويجعله متسقاً Pandas يُسهّل
خاصةً بعد التعود على أساسيات بناء الجملة
يمكن لهذه الأوامر البسيطة
الأكثر فوضوية CSV تنظيف حتى ملفات
3. استخدم التسلسل للحصول على كود برمجي سهل القراءة وفعال
بدلاً من تعيين نتائج وسيطة لمتغيرات جديدة وإرباك دفتر ملاحظاتك أو نصك البرمجي
بتسلسل الدوال Pandas يسمح
إذ يُحسّن هذا الأسلوب من سهولة قراءة الكود وصيانته
عند تسلسل الدوال تكون كل خطوة بمثابة مُرشِّح أو مُحوِّل في خط أنابيب، فيمكنك رؤية ما يحدث للبيانات بوضوح في كل نقطة، فيُقلل هذا من العبء المعرفي ويُلغي الحاجة إلى متغيرات مؤقتة متعددة
من خلال التسلسل يبقى منطقك مترابطاً وسهل التتبع
groupby() و agg() و pivot_table() :٤. إتقان الأدوات الثلاثة القوية
:بمجرد أن تصبح بياناتك واضحة سيصبح التحليل سهلاً للغاية إذا أتقنت هذه الأدوات الثلاث القوية
groupby() و agg() و pivot_table()
تُعدّ هذه الأدوات أساساً لإحصاءات التلخيص ورصد الاتجاهات وتحليل الأبعاد
تقسيم بياناتك إلى مجموعات GroupBy تتيح لك *
وتطبيق الحسابات على كل مجموعة
تعريف دوال تجميع متعددة Agg تتيح لك *
مثل المجموع والمتوسط والعدد.. إلخ
تشكيل بياناتك Pivot تُعيد جداول *
لإجراء مقارنات متقاطعة عبر الفئات
هذه خطوات أساسية للانتقال من البيانات الخام إلى رؤى قيّمة
ستستخدم هذه الأدوات في كل مشروع تقريباً لذا يُنصح بالتدرب عليها مُبكراً
Advertisements
٥. التصور مُبكراً لا مُتأخراً
Seabornو Matplotlib بسلاسة مع Pandas يتكامل
وهما من أشهر مكتبات رسم بايثون، فبدلاً من الانتظار حتى نهاية التحليل غالباً ما يكون من الأذكى التصور أثناء العمل، ويساعد التخطيط المبكر على رصد القيم الشاذة وفهم التوزيعات ورصد الشذوذ أو الاتجاهات، فلستَ بحاجة إلى لوحات معلومات معقدة – حتى مُدرج تكراري أو مخطط خطي بسيط يُمكنه توفير رؤى رئيسية لا تستطيع الأرقام وحدها توفيرها
إن جعل التصور جزءاً من سير عملك القياسي سيُحسّن فهمك للبيانات بشكل كبير
6. تصدير مُخرجاتك النهائية باحتراف
بعد تنظيف بياناتك وتحليلها وتصورها ستحتاج إلى مشاركة النتائج أو تخزينها
تصدير إطار البيانات الخاص بك بتنسيقات مُختلفة Pandas يُسهّل
لا يقتصر تصدير بياناتك على حفظ عملك فحسب بل يشمل إنشاء أصول قابلة لإعادة الاستخدام والمشاركة للمتعاونين أو العملاء
Excel نظيفاً أو ملف CSV فسواءً كان ملف
مُنسقاً احرص دائماً على تضمين هذه الخطوة الأخيرة
لا تدع رؤاك تُحفظ في دفتر ملاحظاتك فقط انشرها
٧. أتمتة المهام المتكررة
إذا لاحظتَ أنك تُكرر نفس الخطوات في المشاريع أو مجموعات البيانات فقد حان وقت الأتمتة، فقد يكون هذا بسيطاً كإنشاء دالة قابلة لإعادة الاستخدام أو متقدماً كإنشاء نص برمجي كامل لخط أنابيب
تساعد الدوال على تغليف المنطق وجعل شيفرتك معيارية، كما أنها تُسهّل عملية الإدماج عند مشاركة عملك مع زملائك في الفريق أو إعادة النظر فيه بعد أشهر
ابدأ بخطوات صغيرة وأتمت المزيد مع مرور الوقت
الخلاصة: باندا قوة خارقة بمجرد إتقانها
في البداية شعرتُ أن باندا غير عملي فوظائفه وخياراته كثيرة جداً، لكن بمجرد أن اتبعتُ عقلية سير عمل البيانات : التنظيف والتسلسل والتجميع والتصور ثم التصدير أصبح كل شيء منطقياً
إذا كنتَ جديداً على باندا فلا تحاول حفظ جميع الطرق، وبدلاً من ذلك ركّز على سير العمل وابنِ أساسك حول المهام العملية وسيصبح باندا أداتك المفضلة في وقت قصير
As a Python developer, I used to pride myself on writing everything from scratch. Whether it was a quick script to clean a dataset or a complex automation workflow, I found joy in crafting each line of code myself. But over time, I realized that reinvention isn’t always smart — especially when the Python ecosystem offers libraries so powerful and polished, they simply outshine any homegrown solution. Here are the eight libraries that made me retire my own scripts.
1. Pandas– My Go-To Data Wrangler
I used to write long, clunky loops to clean and manipulate CSV files. Then I discovered Pandas. With one-liners like df.dropna() or df.groupby(), I was doing in seconds what used to take hours. Whether I’m merging datasets or reshaping tables, Pandas has become my Swiss Army knife for data.
Before Pandas: 50 lines of nested loops After Pandas: 3 lines of elegance
2. BeautifulSoup – No More Manual HTML Parsing
Scraping the web used to be a nightmare of regex and fragile string manipulation. BeautifulSoup changed that. With its intuitive syntax, parsing HTML and XML now feels like reading a book. I stopped worrying about malformed tags and started focusing on insights.
That one line replaced dozens of lines of messy parsing logic.
3. Requests – The End of urllib Torture
Ever tried to use urllib.request? I did — once. Then I met Requests. It made HTTP calls human-friendly. With simple methods like .get() and .post(), Requests reads like plain English. I no longer need to wrestle with headers, sessions, or cookies on my own.
It just works. Every time.
4. Typer – Command-Line Interfaces Without the Pain
For CLI tools, I used to rely on argparse. It worked, but the syntax was verbose. Typer changed my world. Built on top of Click, it lets me build rich CLI apps using Python type hints. It’s intuitive, readable, and scalable — even for complex tools.
With Typer, I shipped tools 3x faster.
Advertisements
5. OpenPyXL – Automating Excel the Right Way
I once wrote a monstrous VBA script to generate Excel reports. That ended the day I found OpenPyXL. It lets me create, read, and edit .xlsx files natively in Python. I can style cells, create charts, and update formulas without opening Excel.
Excel automation is now just another Python script — no macros, no drama.
6. Rich – Console Output That Makes Me Look Good
Debugging output and CLI logs were always boring, until I started using Rich. This library transformed my terminal output into a colorful, styled experience with progress bars, tables, markdown, and even live updates.
Rich made my tools feel like apps, not scripts.
7. Schedule – Human-Readable Task Scheduling
Instead of writing cron jobs or manually handling datetime logic, I now use schedule. It lets me define jobs in a language that almost reads like English.
It’s like having a built-in personal assistant for Python.
8. PyAutoGUI – The End of Repetitive Clicks
I once wrote scripts to automate workflows in specific apps, relying on API access (if available). But many apps don’t have APIs. That’s where PyAutoGUI comes in. It controls the mouse, keyboard, and screen like a robot assistant.
I’ve used it to batch-edit images, generate reports, and even auto-fill web forms — no backend access required.
Final Thoughts: Stop Reinventing, Start Reusing
There’s pride in writing original code. But there’s power in knowing when not to. These libraries saved me hours of frustration, reduced bugs, and supercharged my productivity. If you’re still writing your own scripts for tasks that are already solved — maybe it’s time to stop.
Let Python’s ecosystem do the heavy lifting. You’ve got better things to build.
Advertisements
مكتبات بايثون التي حلت محل نصوصي البرمجية التي كنتُ أُعدّها بنفسي
Advertisements
بصفتي مطور بايثون كنت أفتخر بكتابة كل شيء من الصفر، سواءً كان نصاً برمجياً سريعاً لتنظيف مجموعة بيانات أو سير عمل أتمتة معقداً، كنت أجد متعة في صياغة كل سطر من الشيفرة بنفسي، لكن مع مرور الوقت أدركت أن إعادة الابتكار ليست دائماً ذكية خاصةً عندما يوفر نظام بايثون مكتبات قوية ومتطورة لدرجة أنها ببساطة تتفوق على أي حل محلي
إليكم هذه المكتبات الثماني التي دفعتني للتخلي عن نصوصي البرمجية الخاصة
1. معالج البيانات المفضل لدي : Pandas
ومعالجتها CSV كنت أكتب حلقات طويلة ومعقدة لتنظيف ملفات
ثم اكتشفت باندا، فباستخدام جمل قصيرة
df.groupby() أو df.dropna() مثل
كنت أنجز في ثوانٍ ما كان يستغرق ساعات، سواءً كنت أدمج مجموعات البيانات أو أعيد تشكيل الجداول
قبل باندا: 50 سطراً من الحلقات المتداخلة بعد باندا: 3 أسطر بشكل أنيق
2.اليدوي HTML لا مزيد من تحليل BeautifulSoup
كان استخراج بيانات الويب كابوساً من التعبيرات العادية والتلاعب الهش بالسلاسل النصية
ذلك BeautifulSoup غيّر
بفضل بنيته النحوية البديهية
الآن أشبه بقراءة كتاب HTML و XML أصبح تحليل
لم أعد أقلق بشأن العلامات المشوهة وبدأت بالتركيز على الأفكار
حلّ هذا السطر محل عشرات الأسطر من منطق التحليل الفوضوي
3. urllib نهاية عذاب Requests
؟ urllib.request هل سبق لك أن حاولت استخدام
Requests فعلت ذلك مرة واحدة ثم وجدت
سهلة الاستخدام HTTP جعل مكالمات
.get() و .post() باستخدام طرق بسيطة مثل
سهلة القراءة Requests أصبحت
لم أعد بحاجة إلى التعامل مع الرؤوس أو الجلسات أو ملفات تعريف الارتباط بمفردي
إنه يعمل ببساطة في كل مرة
4. واجهات سطر أوامر سهلة Typer
،في أدوات سطر الأوامر argparse كنت أعتمد على
كان يعمل، لكن بناء الجملة كان مُطوّلاً
حياتي Typer غيّر
Click بُني على
Python وهو يُتيح لي بناء تطبيقات سطر أوامر غنية باستخدام تلميحات نوع
إنه بديهي وسهل القراءة وقابل للتطوير حتى للأدوات المُعقدة
أصبحت الأدوات أسرع بثلاث مرات Typer مع
Advertisements
5. بالطريقة الصحيحة Excel أتمتة OpenPyXL
Excel لإنشاء تقارير VBA كتبتُ ذات مرة نصًا برمجيًا ضخمًا بلغة
OpenPyXL انتهى ذلك اليوم الذي اكتشفتُ فيه
Python وقراءتها وتحريرها تلقائيًا في .xlsx يُتيح لي إنشاء ملفات
يُمكنني تنسيق الخلايا، وإنشاء المخططات البيانية
Excel وتحديث الصيغ دون الحاجة لفتح
Python الآن مجرد نص برمجي آخر في Excel أصبحت أتمتة
بدون وحدات ماكرو بدون تعقيدات
6. مخرجات وحدة التحكم التي تُحسّن مظهري Rich
لطالما كان تصحيح الأخطاء وسجلات سطر الأوامر مُملاً
Rich حتى بدأتُ باستخدام
حوّلت هذه المكتبة مخرجات طرفيتي إلى تجربة زاهية الألوان وأنيقة
Markdown مع أشرطة تقدم وجداول ورموز
وحتى تحديثات مباشرة
7. جدولة مهام سهلة القراءة Schedule
Datetime أو التعامل يدوياً مع cron بدلاً من كتابة مهام
Schedule أستخدم الآن
يتيح لي هذا تحديد المهام بلغة تُشبه الإنجليزية تقريباً
Python يشبه الأمر وجود مساعد شخصي مدمج في
8. نهاية النقرات المتكررة PyAutoGUI
كتبتُ سابقاً نصوصاً برمجية لأتمتة سير العمل في تطبيقات محددة بالاعتماد على الوصول إلى واجهة برمجة التطبيقات (إن وُجدت). لكن العديد من التطبيقات لا تحتوي على واجهات برمجة تطبيقات
PyAutoGUI وهنا يأتي دور
فهو يتحكم في الماوس ولوحة المفاتيح والشاشة كمساعد آلي
لقد استخدمته لتحرير الصور دفعةً واحدة وإنشاء التقارير وحتى ملء نماذج الويب تلقائيًا دون الحاجة إلى الوصول إلى الواجهة الخلفية
أفكار أخيرة: توقف عن إعادة الابتكار وابدأ بإعادة الاستخدام
يكمن الفخر في كتابة أكواد أصلية ولكن تكمن القوة في معرفة متى لا تفعل ذلك، لقد وفرت عليّ هذه المكتبات ساعات من الإحباط وقللت من الأخطاء البرمجية وعززت إنتاجيتي بشكل كبير، فإذا كنت لا تزال تكتب نصوصك البرمجية الخاصة لمهام تم حلها بالفعل فربما حان الوقت للتوقف
دع بيئة بايثون تتولى المهمة الصعبة، لديك أشياء أفضل لتفعلها
In the age of information, data science has quietly transformed from a buzzword to a secret weapon behind every great customer experience. Companies today don’t just rely on good training and courteous staff — they also lean heavily on the silent force of algorithms and predictive models that keep their customer support running like a well-oiled machine.
So, what’s the hidden magic that makes data science so powerful in this space? Let’s break it down.
Turning Conversations Into Insights
Every chat message, support ticket, or phone call holds a wealth of information. Traditionally, companies would handle these one by one, reactively solving issues. But modern customer support teams harness data science to process thousands — even millions — of interactions and distill them into meaningful trends.
By applying natural language processing (NLP), support teams can analyze what customers are talking about in real-time: Are there recurring complaints? Where are customers getting stuck? What product features are confusing?
This insight doesn’t just help solve individual cases faster — it feeds back into product improvements, FAQ updates, and proactive outreach that stops problems before they spread.
Predicting Problems Before They Happen
One of the secret superpowers of data science is prediction. By analyzing historical patterns, machine learning models can flag customers who are likely to churn, escalate, or leave a bad review.
Imagine knowing which users will probably run into payment errors or shipping delays — and reaching out with helpful guidance before they even file a ticket. That’s the next level of support.
Big companies like Amazon, Netflix, and telecom giants have invested millions in this approach — but the same technology is becoming accessible for small businesses through SaaS platforms and affordable AI tools.
Automating the Repetitive, Empowering the Human
Not all support interactions need a human agent. Bots powered by data science handle routine questions 24/7: order tracking, password resets, account updates. These AI assistants learn from massive datasets to answer with near-human fluency — but the real magic is that they free up human agents for high-value conversations that require empathy and nuanced judgment.
This hybrid approach means customers get faster replies for simple requests and more personalized help for complex ones — a win-win for satisfaction and operational costs.
Advertisements
Personalization at Scale
Data science also powers personalization. With the right models, a support team can instantly pull up a customer’s past purchases, preferences, and issues — and tailor the conversation accordingly.
Instead of asking a customer to repeat their story for the fifth time, the agent (or the AI) knows exactly what they bought, when they called last, and what solutions worked before. This level of context not only saves time but builds trust.
Real-Time Performance Tuning
Support managers used to rely on static reports — now, live dashboards powered by data analytics track agent performance, ticket volumes, resolution times, and customer sentiment in real-time.
This visibility lets teams spot bottlenecks as they happen, shift resources quickly, and reward top performers. Data-driven coaching has become the norm, not the exception.
Final Thoughts: The Silent Advantage
When done right, customers never even notice the data science humming in the background — they just feel heard, understood, and helped.
For businesses, the ROI is clear: fewer support costs, happier customers, and a constant stream of insights to improve products and services. The secret power of data science in customer support isn’t about replacing people — it’s about making them smarter, faster, and better equipped to deliver experiences that keep customers coming back.
Advertisements
كواليس دور علم البيانات في خدمة عملاء متميزة
Advertisements
في عصر المعلومات تحوّل علم البيانات بهدوء من مجرد مصطلح شائع إلى سلاح سري وراء كل تجربة عملاء رائعة، إذ لا تعتمد الشركات اليوم على التدريب الجيد والموظفين المهذبين فحسب، بل تعتمد أيضاً بشكل كبير على القوة الصامتة للخوارزميات والنماذج التنبؤية التي تُبقي دعم العملاء يعمل بكفاءة عالية، إذاً ما هو السر الكامن وراء قوة علم البيانات في هذا المجال؟ دعونا نوضح ذلك
:تحويل المحادثات إلى رؤى
تحمل كل رسالة دردشة أو تذكرة دعم أو مكالمة هاتفية ثروة من المعلومات، فتقليدياً كانت الشركات تتعامل مع هذه المعلومات واحدة تلو الأخرى وتحل المشكلات بشكل تفاعلي، لكن فرق دعم العملاء الحديثة تُسخّر علم البيانات لمعالجة آلاف – بل ملايين – التفاعلات وتحويلها إلى اتجاهات هادفة
(NLP) فمن خلال تطبيق معالجة اللغة الطبيعية
يُمكن لفرق الدعم تحليل ما يتحدث عنه العملاء في الوقت الفعلي: هل هناك شكاوى متكررة؟ أين يواجه العملاء صعوبة؟ ما هي ميزات المنتج المُربكة؟ لا تقتصر هذه الرؤية على حل الحالات الفردية بشكل أسرع فحسب، بل تُسهم أيضاً في تحسينات المنتج وتحديثات الأسئلة الشائعة والتواصل الاستباقي الذي يُوقف المشاكل قبل انتشارها
:التنبؤ بالمشاكل قبل حدوثها
يُعدّ التنبؤ إحدى القوى العظمى السرية لعلم البيانات، فمن خلال تحليل الأنماط التاريخية يُمكن لنماذج التعلم الآلي تحديد العملاء الذين يُحتمل أن يُغادروا الخدمة أو يُصعّدوا التعامل أو يتركوا تقييماً سيئاً، تخيل معرفة المستخدمين الذين يُحتمل أن يواجهوا أخطاء في الدفع أو تأخيراً في الشحن – والتواصل معهم بإرشادات مفيدة حتى قبل تقديمهم للشكوى، هذا هو المستوى التالي من الدعم وعليه استثمرت شركات كبيرة مثل أمازون ونتفليكس وشركات الاتصالات العملاقة ملايين الدولارات في هذا النهج، لكن التكنولوجيا نفسها
SaaS أصبحت متاحة للشركات الصغيرة من خلال منصات
وأدوات الذكاء الاصطناعي بأسعار معقولة
:أتمتة التكرار وتمكين العنصر البشري
لا تحتاج جميع تفاعلات الدعم إلى موظف بشري، إذ تتعامل الروبوتات المُدعمة بعلم البيانات مع الأسئلة الروتينية على مدار الساعة طوال أيام الأسبوع: تتبُّع الطلبات وإعادة تعيين كلمات المرور وتحديثات الحساب، بحيث يتعلم مساعدو الذكاء الاصطناعي من مجموعات بيانات ضخمة للإجابة بطلاقة تكاد تكون بشرية، لكن السر يكمن في أنهم يُتيحون للوكلاء البشريين إجراء محادثات عالية القيمة تتطلب التعاطف والحكم الدقيق، هذا النهج الهجين يعني حصول العملاء على ردود أسرع للطلبات البسيطة ومساعدة أكثر تخصيصاً للطلبات المعقدة وهو أمر مربح للطرفين من حيث الرضا وتكاليف التشغيل
Advertisements
:التخصيص على نطاق واسع
يُعزز علم البيانات التخصيص أيضاً، فباستخدام النماذج المناسبة يمكن لفريق الدعم الاطلاع فوراً على مشتريات العميل السابقة وتفضيلاته ومشاكله وتصميم المحادثة وفقاً لذلك، فبدلاً من مطالبة العميل بتكرار قصته للمرة الخامسة يعرف الوكيل (أو الذكاء الاصطناعي) بالضبط ما اشتراه ومتى اتصل آخر مرة والحلول التي نجحت سابقاً، وهذا المستوى من السياق لا يوفر الوقت فحسب بل يبني الثقة أيضاً
:ضبط الأداء في الوقت الفعلي
كان مديرو الدعم يعتمدون في السابق على التقارير الثابتة، أمّا الآن فتُتيح لوحات معلومات مباشرة مدعومة بتحليلات البيانات تتبع أداء الوكلاء وحجم الطلبات وأوقات الحل وتفاعل العملاء في الوقت الفعلي، فتتيح هذه الرؤية للفرق رصد الاختناقات فور حدوثها وتحويل الموارد بسرعة ومكافأة أفضل الموظفين أداءً، وعليه أصبح التدريب القائم على البيانات هو القاعدة وليس الاستثناء
خاتمة : الميزة الصامتة
عند تطبيقها بشكل صحيح لا يلاحظ العملاء حتى عمل علم البيانات في الخلفية بل يشعرون فقط بأنه مسموع ومفهوم ومدعوم، فبالنسبة للشركات فإن عائد الاستثمار واضح: تكاليف دعم أقل وعملاء أكثر رضا وتدفق مستمر من الأفكار لتحسين المنتجات والخدمات، بحيث لا تكمن القوة الخفية لعلم البيانات في دعم العملاء في استبدال الموظفين، بل في جعلهم أكثر ذكاءً وسرعةً وتجهيزاً لتقديم تجارب تجذب العملاء للعودة
In today’s world, Artificial Intelligence feels like an unavoidable buzzword — and with good reason. It’s transforming industries, reshaping how we work, and opening up opportunities that didn’t exist a decade ago. Naturally, thousands of eager learners flock to online AI courses hoping to become AI experts overnight. But here’s the uncomfortable truth: jumping from one random course to another often leaves you with shallow, disconnected knowledge and no real ability to solve real-world problems.
Too many people buy yet another course, hoping this one will finally “click.” They skim through a few video lessons, copy some code snippets, maybe run a basic neural network — but when it comes time to build something meaningful or troubleshoot an issue, they feel completely lost. That’s because real understanding doesn’t come from binge-watching lectures. It comes from deliberate, structured learning — and for that, you still can’t beat good books.
Why Random Courses Are Failing You
It’s not that online courses are bad. Many are well-produced and taught by experts. But when you hop from one to the next without a plan, you’re patching together fragments of knowledge with no strong foundation underneath. You might learn to run someone else’s code — but do you really understand why it works? Could you adapt it to a new problem? Could you explain it to someone else?
This shallow learning leaves you vulnerable. The field of AI evolves quickly, and tools and libraries change all the time. If you don’t understand the core principles, you’ll constantly feel like you’re playing catch-up — and sooner or later, you’ll burn out or give up altogether.
Books force you to slow down. They take you deeper than any 3-hour video course ever will. When you work through a book — with a pen, paper, and plenty of time to think — you build a mental framework that helps you connect ideas, question assumptions, and truly own what you learn.
The Books That Will Make You Truly Understand AI
So, if you’re ready to ditch the random course cycle, here are a few books that can build your AI knowledge from the ground up and make you a better practitioner for years to come.
1. “Pattern Recognition and Machine Learning” by Christopher M. Bishop
This book is a heavyweight classic for a reason. It’s not an easy read — but it lays out the mathematical and statistical foundations that power modern machine learning. Expect to revisit your linear algebra and probability knowledge. Work through the derivations. Try to implement the algorithms from scratch. By the time you’re done, you’ll see behind the curtain of so many “black box” models you find online.
2. “Deep Learning” by Ian Goodfellow, Yoshua Bengio, and Aaron Courville
Think of this book as your deep dive into the world of neural networks and modern AI systems. It explains the mechanics behind deep learning architectures, why they work, where they fail, and how to build better models. If you want to understand how the tools like TensorFlow or PyTorch are built — not just how to call their functions — this is your map.
3. “Artificial Intelligence: A Modern Approach” by Stuart Russell and Peter Norvig
This is the standard textbook in university-level AI courses. It doesn’t just cover machine learning — it explores the entire landscape of AI, including logic, planning, knowledge representation, robotics, and even the philosophical questions we face when building intelligent machines. It’s a book that broadens your view and shows you that AI is more than just training models.
Advertisements
4. “The Hundred-Page Machine Learning Book” by Andriy Burkov
If Bishop’s and Goodfellow’s tomes feel intimidating, this book is a perfect starting point. It condenses core ML concepts into a readable, concise format. You won’t master every detail from it alone, but it’s excellent for building a mental map before you go deeper — or for refreshing key ideas when you need a quick reference.
5. “You Look Like a Thing and I Love You” by Janelle Shane
Learning AI isn’t only about equations and algorithms — it’s also about understanding its quirks and limitations. This book is a witty, accessible look at how AI works (and fails) in the real world, through hilarious experiments and relatable explanations. It reminds you not to take every AI claim at face value, and gives you a healthy sense of skepticism — an essential trait for any serious AI learner.
How to Make the Most of These Books
Don’t treat these books like bedtime reading. Slow down. Take notes. Highlight passages. Rework the math by hand. Build small projects to test the theories you read about. The goal isn’t just to finish the book — it’s to absorb it so well that you can explain what you learned to someone else.
When you do need a course — and sometimes you will — you’ll approach it with intention. You’ll know exactly what you want to learn: a specific framework, tool, or implementation detail. That way, the course becomes a practical supplement, not your only source of truth.
Build a Knowledge Foundation That Lasts
The tech world is full of shiny tools and short-lived trends, but the principles that power AI — probability, statistics, optimization, and logic — don’t go out of style. If you build your learning on a solid foundation, you’ll always be able to pick up new skills, adapt to changing tools, and stay ahead of the hype.
So next time you’re tempted to buy yet another AI crash course, pause. Pick up a good book instead. Make some coffee, find a quiet place, and give yourself permission to dig deep. Your future self — the one solving real-world AI problems with confidence — will thank you.
Advertisements
توقف عن إهدار المال على دورات الذكاء الاصطناعي العشوائية – هذه الكتب هي كل ما تحتاجه
Advertisements
في عالمنا اليوم يبدو الذكاء الاصطناعي مصطلحاً شائعاً لا مفر منه، ولسبب وجيه فهو يُحدث تحولات في الصناعات ويُعيد تشكيل أساليب عملنا ويفتح آفاقاً جديدة لم تكن موجودة قبل عقد من الزمان، وبطبيعة الحال يتوافد آلاف المتعلمين المتحمسين على دورات الذكاء الاصطناعي عبر الإنترنت أملاً في أن يصبحوا خبراء في الذكاء الاصطناعي بين عشية وضحاها، ولكن إليكم الحقيقة الصادمة: إن الانتقال من دورة عشوائية إلى أخرى غالباً ما يُخلّف لديك معرفة سطحية ومنفصلة ويفقدك القدرة الحقيقية على حل مشاكل العالم الحقيقي
يشتري الكثيرون دورة أخرى على أمل أن تُجدي هذه الدورة نفعاً، فيُشاهدون بعض دروس الفيديو بسرعة وينسخون بعض مقتطفات الأكواد البرمجية وربما يُشغّلون شبكة عصبية أساسية ولكن عندما يحين وقت بناء شيء ذي معنى أو استكشاف مشكلة ما يشعرون بالضياع التام، ذلك لأن الفهم الحقيقي لا يأتي من كثرة مشاهدة المحاضرات بل يأتي من التعلم المُتأني والمنظم، ولهذا لا يُمكنك التغلب على الكتب الجيدة
لماذا الدورات العشوائية لا تفي بالغرض؟
ليس الأمر أن الدورات عبر الإنترنت سيئة، فالعديد منها مُعدّة جيداً ويُدرّسها خبراء لكن عندما تتنقل من واحد إلى آخر دون خطة مدروسة فأنت تُجمّع شظايا من المعرفة دون أساس متين، قد تتعلم تشغيل شيفرة شخص آخر – ولكن هل تفهم حقاً سبب نجاحها؟ هل يمكنك تكييفها مع مشكلة جديدة؟ هل يمكنك شرحها لشخص آخر؟
هذا التعلم السطحي يجعلك عرضة للخطر، فمجال الذكاء الاصطناعي يتطور بسرعة والأدوات والمكتبات تتغير باستمرار، فإذا لم تفهم المبادئ الأساسية ستشعر باستمرار وكأنك تحاول اللحاق بالركب وعاجلاً أم آجلاً ستُنهك أو تستسلم تماماً
الكتب تُجبرك على التباطؤ فهي تأخذك إلى عمق أكبر من أي دورة فيديو مدتها ثلاث ساعات، فعندما تُمعن النظر في كتاب – بقلم وورقة ووقت كافٍ للتفكير – فإنك تبني إطاراً ذهنياً يساعدك على ربط الأفكار وطرح الأسئلة وامتلاك ما تتعلمه حقاً
الكتب التي ستجعلك تفهم الذكاء الاصطناعي فهماً حقيقياً
إذا كنت مستعداً للتخلي عن الدورات الدراسية العشوائية فإليك بعض الكتب التي يمكنها بناء معرفتك بالذكاء الاصطناعي من الصفر وجعلك ممارساً أفضل لسنوات قادمة
1. بقلم كريستوفر بيشوب“Pattern Recognition and Machine Learning”
يُعد هذا الكتاب من الكتب الكلاسيكية المهمة لسبب وجيه، صحيح أنه ليس سهل القراءة لكنه يُرسي الأسس الرياضية والإحصائية التي تُعزز التعلم الآلي الحديث، توقع إعادة النظر في معرفتك بالجبر الخطي والاحتمالات واعمل على الاشتقاقات وحاول تطبيق الخوارزميات من الصفر، وعند الانتهاء سترى خلف الستار العديد من نماذج “الصندوق الأسود” التي تجدها على الإنترنت
اعتبر هذا الكتاب بمثابة رحلة متعمقة في عالم الشبكات العصبية وأنظمة الذكاء الاصطناعي الحديثة، إذ يشرح هذا الكتاب آليات هياكل التعلم العميق وأسباب نجاحها ومواطن فشلها وكيفية بناء نماذج أفضل، فإذا كنت ترغب في فهم كيفية بناء أدوات
PyTorch أو TensorFlow مثل
وليس فقط كيفية استدعاء وظائفها فهذا هو دليلك
Advertisements
3. بقلم ستيوارت راسل وبيتر نورفيج “Artificial Intelligence: A Modern Approach”
هذا الكتاب هو المرجع الأساسي في دورات الذكاء الاصطناعي على مستوى الجامعات، إذ لا يقتصر على تغطية التعلم الآلي فحسب بل يستكشف آفاق الذكاء الاصطناعي بالكامل بما في ذلك المنطق والتخطيط وتمثيل المعرفة والروبوتات وحتى الأسئلة الفلسفية التي نواجهها عند بناء الآلات الذكية، إنه كتاب يوسع آفاقك ويوضح لك أن الذكاء الاصطناعي أكثر من مجرد نماذج تدريب
5. بقلم جانيل شين “You Look Like a Thing and I Love You”
لا يقتصر تعلم الذكاء الاصطناعي على المعادلات والخوارزميات، بل يشمل أيضاً فهم خصائصه وحدوده، فيقدم هذا الكتاب نظرة بارعة وسهلة الفهم على كيفية عمل الذكاء الاصطناعي (وفشله) في العالم الواقعي، فمن خلال تجارب شيقة وشروحات واقعية يذكرك الكتاب بألا تأخذ كل ادعاء يتعلق بالذكاء الاصطناعي على محمل الجد ويمنحك شعوراً صحياً بالشك وهي سمة أساسية لأي متعلم جاد للذكاء الاصطناعي
كيف تحقق الاستفادة القصوى من هذه الكتب ؟
لا تتعامل مع هذه الكتب كقراءة قبل النوم، بل دوّن ملاحظاتك وحدّد بعض المقاطع وأعد حل المسائل الرياضية يدوياً ثم أنشئ مشاريع صغيرة لاختبار النظريات التي قرأتها، فالهدف ليس مجرد إنهاء الكتاب بل استيعابه جيداً بما يكفي لشرح ما تعلمته لشخص آخر
عندما تحتاج إلى دورة تدريبية ستتعامل معها بوعي، ستعرف بالضبط ما تريد تعلمه: إطار عمل محدد أو أداة أو تفاصيل تطبيقية، وبهذه الطريقة تصبح الدورة مُكمّلاً عملياً وليست مصدرك الوحيد للحقيقة
: ابنِ أساساً معرفياً يدوم
عالم التكنولوجيا مليء بالأدوات اللامعة والاتجاهات قصيرة الأمد، لكن المبادئ التي تُحرّك الذكاء الاصطناعي كالاحتمالات والإحصاء والتحسين والمنطق لا تفقد رونقها، فإذا بنيتَ تعلّمك على أساس متين ستتمكن دائماً من اكتساب مهارات جديدة والتكيف مع الأدوات المتغيرة والبقاء في صدارة هذا الصخب العلمي السريع التطور
لذا في المرة القادمة التي تُغريك فيها فكرة شراء دورة مكثفة أخرى في الذكاء الاصطناعي توقف قليلاً، التقط كتاباً جيداً بدلاً من ذلك، حضّر بعض القهوة وابحث عن مكان هادئ وامنح نفسك الإذن للتعمق، ستشكرك ذاتك المستقبلية التي ستحل مشاكل الذكاء الاصطناعي في العالم الحقيقي بثقة على هذا الصنيع
The data science job market is booming, but so is the competition. Companies want data scientists who are not just technically strong, but also able to communicate insights and solve real problems. To stand out, you need to understand what employers value most. Technical skills, soft skills, and industry-specific knowledge all play an important role.
Build a Strong Portfolio
One of the best ways to get noticed is to have a portfolio that proves what you can do. Don’t rely only on your resume. Create a portfolio website where you showcase your projects. Include case studies, GitHub repositories, and even visual dashboards if possible. Make sure each project tells a clear story — what was the problem, what data did you use, how did you solve it, and what impact did it have?
Master the Essential Tools
Recruiters expect you to know popular tools and programming languages like Python, R, SQL, and frameworks like TensorFlow or PyTorch for machine learning. But beyond just listing them, show that you’ve applied them. For example, share a project where you used Python for web scraping or R for statistical analysis. This practical application makes your skills credible.
Develop Soft Skills
Technical skills alone won’t guarantee you a job. Companies love data scientists who can explain complex findings in simple terms, work well in teams, and communicate with non-technical stakeholders. Practice storytelling with data — try presenting your projects in videos or blog posts. It shows you know how to translate data into decisions.
Gain Real-World Experience
If you’re just starting out, internships, volunteering, or freelancing can make a huge difference. Contribute to open-source data science projects or participate in hackathons. These experiences help you learn teamwork, solve real-world problems, and make connections in the field.
Advertisements
Network Like a Pro
Don’t underestimate the power of networking. Attend data science meetups, webinars, and conferences. Engage in online communities like LinkedIn groups or Kaggle forums. Many opportunities come through word of mouth, so let people know you’re looking and ready.
Tailor Every Application
Customize your resume and cover letter for each job. Highlight the skills and projects that match the job description. Use keywords that recruiters use. This small effort can help your application pass automated screening tools and reach a real human.
Keep Learning
The field of data science evolves fast. Stay updated by taking new courses, earning certifications, or learning emerging tools and trends. Showing that you’re committed to growth makes you a stronger candidate.
Final Thoughts
Standing out in the data science job market is about more than just technical skills. Build a portfolio that proves your abilities, develop your communication skills, gain experience, and make real connections. If you do this consistently, you’ll position yourself ahead of the competition.
Advertisements
كيف تتألق في سوق عمل علوم البيانات اليوم
Advertisements
افهم المنافسة
يشهد سوق عمل علوم البيانات ازدهاراً ملحوظاً وكذلك المنافسة، إذ تبحث الشركات عن علماء بيانات لا يتمتعون بالكفاءة التقنية فحسب بل أيضاً بالقدرة على توصيل الأفكار وحل المشكلات الحقيقية، ولكي تتميز عليك أن تفهم أكثر ما يُقدّره أصحاب العمل، تلعب المهارات التقنية والمهارات الشخصية والمعرفة المتخصصة دوراً هاماً
أنشئ محفظة أعمال قوية
من أفضل الطرق لجذب الانتباه هي إنشاء محفظة أعمال تُثبت قدراتك، لا تعتمد فقط على سيرتك الذاتية، بل أنشئ موقعاً إلكترونياً لعرض مشاريعك
GitHub وأدرج دراسات الحالة ومستودعات
وحتى لوحات المعلومات المرئية إن أمكن وتأكد من أن كل مشروع يروي قصة واضحة – ما هي المشكلة وما البيانات التي استخدمتها وكيف حلّتها وما هو تأثيرها
أتقن الأدوات الأساسية
يتوقع منك مسؤولو التوظيف معرفة الأدوات الشائعة
SQL و R ولغات البرمجة مثل بايثون و
للتعلم الآلي PyTorch أو TensorFlow وأطر عمل مثل
ولكن بالإضافة إلى مجرد ذكرها أظهر أنك طبقتها، فعلى سبيل المثال شارك مشروعاً استخدمت فيه بايثون
للتحليل الإحصائي R لاستخراج البيانات من الويب أو
هذا التطبيق العملي يجعل مهاراتك موثوقة
طوّر مهاراتك الشخصية
المهارات التقنية وحدها لا تضمن لك وظيفة، إذ تُفضل الشركات علماء البيانات الذين يستطيعون شرح النتائج المعقدة بعبارات بسيطة والعمل بكفاءة ضمن فرق والتواصل مع أصحاب المصلحة غير التقنيين، لذا مارس سرد القصص باستخدام البيانات – حاول عرض مشاريعك في مقاطع فيديو أو منشورات مدونة، هذا يُظهر لك قدرتك على ترجمة البيانات إلى قرارات
اكتسب خبرة عملية
إذا كنت مبتدئاً فإن التدريب العملي أو التطوع أو العمل الحر يُمكن أن يُحدث فرقاً كبيراً، لذا ساهم في مشاريع علوم البيانات مفتوحة المصدر أو شارك في هاكاثونات، إذ تساعدك هذه التجارب على تعلم العمل الجماعي وحل المشكلات الواقعية وبناء علاقات في هذا المجال
Advertisements
تواصل باحتراف
لا تستهن بقوة التواصل واحرص على حضور لقاءات وندوات ومؤتمرات علم البيانات وشارك في مجتمعات إلكترونية
Kaggle أو منتديات LinkedIn مثل مجموعات
فالعديد من الفرص تأتي من خلال التواصل الشفهي لذا أخبر الناس أنك تبحث عن وظيفة ومستعد لها
صمّم كل طلب توظيف حسب ذوقك
خصّص سيرتك الذاتية وخطاب التغطية لكل وظيفة وسلّط الضوء على المهارات والمشاريع التي تتوافق مع وصف الوظيفة واستخدم الكلمات المفتاحية التي يستخدمها مسؤولو التوظيف، هذا الجهد البسيط يمكن أن يساعد طلبك على اجتياز أدوات الفرز الآلية والوصول إلى شخص حقيقي
واصل التعلم
يتطور مجال علم البيانات بسرعة، لذا ابقَ على اطلاع دائم من خلال الالتحاق بدورات جديدة أو الحصول على شهادات أو تعلّم الأدوات والاتجاهات الناشئة، إن إظهار التزامك بالنمو يجعلك مرشحاً أقوى
خاتمة
التميز في سوق عمل علم البيانات لا يقتصر على المهارات التقنية فحسب، لذا أنشئ ملف أعمال يُثبت قدراتك وطوّر مهاراتك في التواصل واكتسب الخبرة وكوّن علاقات حقيقية إذا فعلت ذلك باستمرار فستضع نفسك في صدارة المنافسة
Freelance software development remains one of the most practical and flexible ways to earn money with coding skills. As a freelancer, you have the freedom to choose your clients, negotiate your rates, and decide which projects align with your interests and skill level. Many freelancers start small, working on simple website projects, bug fixes, or feature enhancements, and gradually move on to larger, higher-paying contracts as their reputation grows. Platforms like Upwork, Fiverr, and Toptal make it easier than ever to connect with clients worldwide who need everything from full-stack web development to custom mobile apps and automation scripts. While freelancing demands good communication skills, time management, and the ability to deliver clean, maintainable code on time, it also builds your portfolio, widens your network, and provides a constant flow of diverse challenges that help you grow technically and professionally. Whether you do it as a side hustle or a full-time business, freelancing gives you the freedom to earn on your own terms.
Example 1: Build a custom WordPress website for a local business.
Example 2: Develop a mobile app for a startup looking to launch an MVP (Minimum Viable Product).
Example 3: Offer bug fixing or code optimization services on platforms like Upwork or Fiverr.
2. Create and Sell Digital Products
Building and selling digital products is one of the most scalable ways to make money with coding. Unlike freelancing, where you trade time for money, digital products can generate passive income for years after you create them. Coders often build plugins, SaaS tools, website themes, or automation scripts that solve a common problem for a niche audience. Once your product is built, you can sell it on marketplaces or directly through your own website, and focus on marketing and support instead of constantly coding new projects from scratch. Many developers find success by listening to user feedback and continually improving their product, which keeps customers happy and attracts new buyers. This approach demands upfront effort, but the long-term reward is the possibility of recurring revenue streams without needing to negotiate with new clients for every dollar you earn.
Example 1: Design a Shopify theme and sell it on the Shopify Theme Store.
Example 2: Develop a time-tracking app and offer it as a subscription service.
Example 3: Build and sell custom scripts or automation tools for repetitive tasks.
3. Teach Coding Online
Sharing your coding knowledge through teaching is another powerful way to earn an income. If you enjoy explaining technical ideas in simple, clear ways, you can turn that skill into online courses, video tutorials, ebooks, or even live one-on-one lessons. Many beginners are willing to pay for well-organized, structured learning experiences rather than piecing together free resources. Platforms like Udemy, Skillshare, and Teachable allow you to create courses once and earn passive income every time someone enrolls. You could also offer personalized tutoring sessions, webinars, or coding bootcamps for those who prefer interactive learning. Teaching not only generates income but also strengthens your own understanding of programming, keeps you up-to-date with new technologies, and builds a personal brand as an expert in your field.
Example 1: Launch a Udemy course about building REST APIs with Node.js.
Example 2: Write an ebook that explains JavaScript for absolute beginners.
Example 3: Offer private tutoring sessions through a platform like Superprof or Wyzant.
4. Work Remotely for Companies
Remote work has transformed the job market for coders, offering stable income, benefits, and a steady flow of projects — all without being tied to a physical office. Companies around the world increasingly hire developers who can work from anywhere, which gives you the freedom to choose employers that align with your values and interests. Working remotely means you can collaborate with global teams, contribute to large-scale projects, and build long-term relationships that grow your skills and professional network. Many remote developers find opportunities in areas like web development, cloud services, mobile apps, and backend infrastructure. This route is ideal if you prefer the stability of a salary and a team environment over managing your own clients.
Example 1: Get hired as a front-end developer for a SaaS company.
Example 2: Work as a backend engineer maintaining cloud services.
Example 3: Join a remote team as a full-stack developer building web platforms.
Advertisements
5. Build and Monetize a Blog or YouTube Channel
If you enjoy creating content and helping others learn, you can build an audience by sharing your coding insights for free — then earn money through monetization. Many successful developers run blogs or YouTube channels where they post tutorials, deep dives, or personal experiences about the tech industry. Once you grow a loyal audience, you can monetize through ads, sponsorships, or affiliate marketing, recommending tools and services that you genuinely use. Though it takes time and consistency to build trust and attract viewers or readers, the long-term benefit is that your content can generate passive income while also boosting your reputation and opening up new career or business opportunities.
Example 1: Write detailed tutorials on your blog and earn through ad revenue and affiliate links.
Example 2: Create coding tutorial videos on YouTube and join the YouTube Partner Program.
Example 3: Partner with tech companies to sponsor your content and promote their tools.
6. Contribute to Open Source and Get Sponsorships
Open-source development is more than just a way to give back to the community — it can also become a revenue stream if you build something useful enough to attract sponsorships or donations. Many developers maintain open-source libraries, frameworks, or tools that others rely on for their own work. As your project grows in popularity, companies and individuals may sponsor you to keep the project maintained and secure. Platforms like GitHub Sponsors, Patreon, or Buy Me a Coffee make it simple for supporters to contribute financially. Some developers also offer premium add-ons, consulting, or custom integrations around their open-source projects, creating even more ways to generate income while keeping the core product free for the community.
Example 1: Develop a popular JavaScript library and get sponsorship from companies using it.
Example 2: Maintain a free tool for developers and receive donations via Buy Me a Coffee.
Example 3: Offer premium support or custom add-ons for your open-source software.
7. Develop Mobile Apps and Games
Creating your own mobile apps or games gives you the chance to earn money while exercising full creative control over what you build. Many successful indie developers design simple, addictive apps that solve a specific need or entertain users. Once published on app stores like Google Play or the Apple App Store, your app can earn money through paid downloads, ads, or in-app purchases. While the competition is fierce, the low cost of publishing and the massive user base of smartphones worldwide make it an attractive option for coders who want to build something of their own. Continuous updates, user feedback, and good marketing are essential to stand out and keep your app relevant.
Example 1: Create a simple productivity app and charge a small one-time fee.
Example 2: Build a casual game and earn revenue from in-game ads.
Example 3: Offer premium features via subscriptions within your app.
8. Automate Business Solutions for Clients
Automation is a goldmine for coders who understand how to connect tools, build scripts, or develop bots that save time and money. Many small and medium-sized businesses are eager to pay developers who can automate repetitive tasks like data entry, reporting, customer service, or marketing processes. With the growing use of APIs and cloud services, the demand for tailored automation solutions keeps increasing. Coders who specialize in automation often find themselves in high demand because they directly help clients increase efficiency and profits, which makes their services valuable and justifies premium rates.
Example 1: Develop a custom Python script to automate report generation for an e-commerce company.
Example 2: Create a chatbot that handles customer support on a client’s website.
Example 3: Integrate multiple web services to automate tasks like lead generation and email marketing.
Final Thoughts
The beauty of coding lies in its endless flexibility. Whether you want to build your own product, teach others, create content, freelance, or solve problems for clients, your skills can be turned into income streams that match your interests and lifestyle. The key is to experiment, stay curious, and keep adding value — because when you do, the opportunities to earn will keep growing alongside your skills.
Advertisements
البرمجة لتحقيق دخل: ٨ استراتيجيات لتحويل المهارات إلى دخل
Advertisements
: تطوير البرمجيات المستقل
يُعدّ تطوير البرمجيات المستقل من أكثر الطرق عملية ومرونة لكسب المال من خلال مهارات البرمجة، فبصفتك مستقلاً لديك حرية اختيار عملائك والتفاوض على أسعارك وتحديد المشاريع التي تناسب اهتماماتك ومستوى مهاراتك، إذ يبدأ العديد من المستقلين مشاريع صغيرة فيعملون على مشاريع مواقع ويب بسيطة أو إصلاح الأخطاء أو تحسين الميزات ثم ينتقلون تدريجياً إلى عقود أكبر وأكثر ربحية مع نمو سمعتهم
Toptal و Fiverrو Upwork تُسهّل منصات مثل
التواصل مع العملاء حول العالم الذين يحتاجون إلى كل شيء، فمن تطوير مواقع ويب متكاملة إلى تطبيقات جوال مخصصة ونصوص برمجية للأتمتة، في حين أن العمل الحر يتطلب مهارات تواصل جيدة وإدارة وقت والقدرة على تسليم برمجيات نظيفة وقابلة للصيانة في الوقت المحدد فإنه يُنمّي أيضاً محفظتك ويُوسّع شبكتك ويُتيح لك سلسلة مُستمرة من التحديات المتنوعة التي تُساعدك على النمو تقنياً ومهنياً، فسواءً كنت تعمل كمشروع جانبي أو بدوام كامل فإن العمل الحر يمنحك حرية الكسب بشروطك الخاصة
مثال ١: أنشئ موقع ووردبريس مخصصاً لشركة محلية
مثال ٢: طوّر تطبيقاً جوالاً لشركة ناشئة تسعى لإطلاق منتجها الأدنى القابل للتطبيق
مثال ٣: قدّم خدمات إصلاح الأخطاء أو تحسين الأكواد البرمجية
Fiverr أو Upwork على منصات مثل
٢. إنشاء وبيع المنتجات الرقمية
يُعد إنشاء وبيع المنتجات الرقمية من أكثر الطرق قابلية للتطوير لكسب المال من البرمجة، وعلى عكس العمل الحر حيث تُقايض الوقت بالمال يُمكن للمنتجات الرقمية أن تُدرّ دخلاً سلبياً لسنوات بعد إنشائها
SaaS فغالباً ما يُنشئ المبرمجون إضافات وأدوات
وقوالب مواقع ويب أو نصوصاً برمجية للأتمتة تُحلّ مشكلة شائعة لفئة مُحددة من الجمهور، فبمجرد إنشاء منتجك يُمكنك بيعه في الأسواق أو مباشرةً من خلال موقعك الإلكتروني والتركيز على التسويق والدعم بدلاً من برمجة مشاريع جديدة باستمرار من الصفر، إذ يحقق العديد من المطورين النجاح من خلال الاستماع إلى تعليقات المستخدمين والتحسين المُستمر لمنتجاتهم مما يُحافظ على رضا العملاء ويجذب مشترين جُدد، ويتطلب هذا النهج جهداً مقدماً لكن المكافأة على المدى الطويل هي إمكانية تحقيق تدفقات إيرادات متكررة دون الحاجة إلى التفاوض مع عملاء جدد مقابل كل دولار تربحه
Shopify وبيعه على متجر قوالب Shopify مثال 1: تصميم قالب
مثال 2: تطوير تطبيق لتتبع الوقت وتقديمه كخدمة اشتراك
مثال 3: إنشاء وبيع نصوص برمجية مخصصة أو أدوات أتمتة للمهام المتكررة
3. تعليم البرمجة عبر الإنترنت
تُعد مشاركة معرفتك البرمجية من خلال التدريس طريقة فعّالة أخرى لكسب الدخل، إذا كنت تستمتع بشرح الأفكار التقنية بطرق بسيطة وواضحة يمكنك تحويل هذه المهارة إلى دورات عبر الإنترنت أو دروس فيديو تعليمية أو كتب إلكترونية أو حتى دروس فردية مباشرة، فالعديد من المبتدئين على استعداد للدفع مقابل تجارب تعليمية منظمة ومنظمة جيداً بدلاً من تجميع موارد مجانية
Teachable و Skillshare و Udemy فتتيح لك منصات مثل
إنشاء دورات مرة واحدة وكسب دخل سلبي في كل مرة يسجل فيها شخص ما، يمكنك أيضاً تقديم جلسات تعليمية شخصية أو ندوات عبر الإنترنت أو معسكرات تدريب برمجية لمن يفضلون التعلم التفاعلي، فلا يقتصر دور التدريس على توليد الدخل فحسب بل يعزز أيضاً فهمك للبرمجة ويُبقيك على اطلاع دائم بأحدث التقنيات ويبني علامتك التجارية كخبير في مجالك
Udemy مثال 1: أطلق دورة تدريبية على
Node.js باستخدام REST حول بناء واجهات برمجة تطبيقات
للمبتدئين JavaScript مثال 2: اكتب كتاباً إلكترونياً يشرح
Wyzant أو Superprof مثال 3: قدّم جلسات تعليمية خاصة عبر منصة مثل
4. العمل عن بُعد للشركات
أحدث العمل عن بُعد نقلة نوعية في سوق العمل للمبرمجين حيث يوفر دخلاً ثابتاً ومزايا وتدفقاً مستمراً للمشاريع – كل ذلك دون الحاجة إلى مكتب فعلي، توظف الشركات حول العالم بشكل متزايد مطورين يمكنهم العمل من أي مكان مما يمنحك حرية اختيار أصحاب العمل الذين يتوافقون مع قيمك واهتماماتك، فالعمل عن بُعد يعني إمكانية التعاون مع فرق عالمية والمساهمة في مشاريع ضخمة وبناء علاقات طويلة الأمد تُنمّي مهاراتك وشبكتك المهنية، إذ يجد العديد من المطورين عن بُعد فرصاً في مجالات مثل تطوير الويب والخدمات السحابية وتطبيقات الجوال والبنية التحتية الخلفية، يُعد هذا المسار مثالياً إذا كنت تُفضّل استقرار الراتب وبيئة العمل الجماعي على إدارة عملائك بنفسك
SaaS مثال 1: احصل على وظيفة كمطور واجهة أمامية لشركة
مثال 2: اعمل كمهندس واجهة خلفية لصيانة الخدمات السحابية
مثال 3: انضم إلى فريق عن بُعد كمطور متكامل لبناء منصات الويب
Advertisements
٥. أنشئ مدونة أو قناة على يوتيوب واربح المال منها
إذا كنت تستمتع بإنشاء المحتوى ومساعدة الآخرين على التعلم يمكنك بناء قاعدة جماهيرية من خلال مشاركة أفكارك البرمجية مجاناً، ثم اربح المال من خلال تحقيق الدخل، إذ يدير العديد من المطورين الناجحين مدونات أو قنوات على يوتيوب ينشرون فيها دروساً تعليمية أو تحليلات معمقة أو تجارب شخصية حول صناعة التكنولوجيا، فبمجرد اكتساب جمهور وفي يمكنك تحقيق الدخل من خلال الإعلانات أو الرعاية أو التسويق بالعمولة من خلال التوصية بالأدوات والخدمات التي تستخدمها بالفعل، وعلى الرغم من أن بناء الثقة وجذب المشاهدين أو القراء يتطلب وقتاً ومثابرة إلا أن الفائدة على المدى الطويل هي أن محتواك يمكن أن يُدر دخلاً سلبياً مع تعزيز سمعتك وفتح فرص عمل أو مسارات مهنية جديدة
مثال ١: اكتب دروساً تعليمية مفصلة على مدونتك واربح المال من خلال عائدات الإعلانات وروابط التسويق بالعمولة
مثال ٢: أنشئ مقاطع فيديو تعليمية للبرمجة على يوتيوب وانضم إلى برنامج شركاء يوتيوب
مثال ٣: اشترك مع شركات تقنية لرعاية محتواك والترويج لأدواتها
٦. ساهم في تطوير البرمجيات مفتوحة المصدر واحصل على رعايات
يُعدّ تطوير البرمجيات مفتوحة المصدر أكثر من مجرد وسيلة لرد الجميل للمجتمع، بل يُمكن أن يُصبح مصدر دخل إذا أنشأتَ مشروعاً مفيداً بما يكفي لجذب الرعايات أو التبرعات، إذ يُحافظ العديد من المطورين على مكتبات أو أطر عمل أو أدوات مفتوحة المصدر يعتمد عليها الآخرون في عملهم، ومع ازدياد شعبية مشروعك قد تُقدّم لك الشركات والأفراد رعايتكم للحفاظ على المشروع وأمانه
Buy Me a Coffee و Patreon و GitHub Sponsors وتُسهّل منصات مثل
على الداعمين المساهمة المالية، كما يُقدّم بعض المطورين إضافات مميزة أو استشارات أو تكاملات مُخصصة لمشاريعهم مفتوحة المصدر مما يُتيح المزيد من الطرق لتحقيق الدخل مع الحفاظ على المنتج الأساسي مجانياً للمجتمع
شائعة JavaScript مثال ١: طوّر مكتبة
واحصل على رعاية من الشركات التي تستخدمها
مثال ٢: طوّر أداة مجانية للمطورين
Buy Me a Coffee واحصل على تبرعات عبر
مثال ٣: قدّم دعماً مميزاً أو إضافات مُخصصة لبرنامجك مفتوح المصدر
٧. تطوير تطبيقات وألعاب الجوال
يمنحك إنشاء تطبيقات أو ألعاب جوال خاصة بك فرصة لكسب المال مع التحكم الإبداعي الكامل بما تُنشئه، إذ يُصمم العديد من المطورين المستقلين الناجحين تطبيقات بسيطة ومُشوقة تُلبي حاجة مُحددة أو تُسلي المستخدمين، فبمجرد نشر تطبيقك
Apple App Store أو Google Play على متاجر التطبيقات مثل
يُمكنك ربح المال من خلال التنزيلات المدفوعة أو الإعلانات أو عمليات الشراء داخل التطبيق، وعلى الرغم من شراسة المنافسة إلا أن انخفاض تكلفة النشر وقاعدة مستخدمي الهواتف الذكية الضخمة حول العالم تجعله خياراً جذاباً للمبرمجين الذين يرغبون في تطوير تطبيق خاص بهم، فالتحديثات المُستمرة وآراء المستخدمين والتسويق الجيد كلها أمور أساسية للتميز والحفاظ على تطبيقك مُلائماً
مثال ١: أنشئ تطبيق إنتاجية بسيطاً واحصل على رسوم رمزية لمرة واحدة
مثال ٢: أنشئ لعبة بسيطة واربح المال من الإعلانات داخل اللعبة
مثال ٣: قدّم ميزات مميزة عبر الاشتراكات داخل تطبيقك
٨. أتمتة حلول الأعمال للعملاء
تُعدّ الأتمتة منجماً ذهبياً للمبرمجين الذين يفهمون كيفية ربط الأدوات وبناء النصوص البرمجية أو تطوير الروبوتات التي توفر الوقت والمال، وتحرص العديد من الشركات الصغيرة والمتوسطة على توظيف مطورين قادرين على أتمتة المهام المتكررة مثل إدخال البيانات وإعداد التقارير وخدمة العملاء وعمليات التسويق،
(APIs) ومع تزايد استخدام واجهات برمجة التطبيقات
والخدمات السحابية يتزايد الطلب على حلول الأتمتة المُخصصة، وغالباً ما يجد المبرمجون المتخصصون في الأتمتة أنفسهم مطلوبين بشدة لأنهم يساعدون العملاء بشكل مباشر على زيادة الكفاءة والأرباح مما يجعل خدماتهم قيّمة ويُبرر أسعارها المميزة
مثال ١: تطوير نص برمجي مخصص بلغة بايثون لأتمتة إنشاء التقارير لشركة تجارة إلكترونية
مثال ٢: إنشاء روبوت دردشة يُدير دعم العملاء على موقع العميل
مثال ٣: دمج خدمات ويب متعددة لأتمتة مهام مثل توليد العملاء المحتملين والتسويق عبر البريد الإلكتروني
خاتمة
يكمن جمال البرمجة في مرونتها اللامحدودة، فسواءً كنت ترغب في بناء منتجك الخاص أو تعليم الآخرين أو إنشاء محتوى أو العمل الحر أو حل مشاكل العملاء يُمكنك تحويل مهاراتك إلى مصادر دخل تُناسب اهتماماتك وأسلوب حياتك، يكمن السر في التجربة والفضول ومواصلة إضافة القيمة – لأنه عندما تفعل ذلك ستزداد فرصك في الربح مع نمو مهاراتك
In recent years, the explosion of large language models (LLMs) like ChatGPT and Codex has dramatically changed how developers write and interact with code. These models, trained on vast datasets of code and natural language, can now generate entire programs or solve complex problems from simple prompts. But as their use becomes more widespread, a new question arises—how can one tell if a piece of Python code was written by a human developer or by an LLM? While these models are capable and often indistinguishable from seasoned coders at first glance, there are still telltale signs in the structure, style, and logic of the code that can betray its machine origin.
1. Overuse of Comments and Literal Explanations
One of the clearest signs that code may have been written by an LLM is the excessive use of comments. LLMs tend to document every single step of the code, often restating the obvious. You might see comments like # create a variable right before x = 5, or # return the result before a return statement. While documentation is a good practice, this level of verbosity is uncommon among experienced human developers, who typically write comments only where context or reasoning isn’t immediately clear from the code. LLMs, however, are optimized to “explain” and “teach” in natural language, often mirroring tutorial-like patterns.
2. Redundant or Overly Generic Variable Names
LLMs often default to safe, generic naming conventions like data, result, temp, or value, even when more meaningful names would make the code clearer. For instance, in a function analyzing user behavior, a human might use click_rate or session_length, whereas an LLM might stick with data and metric. This genericity stems from the model’s tendency to avoid assumptions, which leads it to play things conservatively unless explicitly instructed otherwise. While not definitive on its own, consistent blandness in naming—especially when better domain-specific choices are obvious—can be a strong clue.
3. Consistently Clean Formatting and Structure
LLMs are extremely consistent when it comes to code formatting. Indentation is uniform, line lengths are well-managed, and spacing tends to follow PEP8 recommendations almost religiously. While this sounds like a positive trait, it can actually be a subtle giveaway. Human-written code, especially in informal or prototyping contexts, often has minor inconsistencies—a missed blank line here, an overly long function elsewhere, or slightly inconsistent docstring formatting. LLMs don’t “get tired” or “sloppy”; their outputs are unusually tidy unless prompted otherwise.
4. Over-Engineering Simple Tasks
Sometimes, LLMs will take a simple problem and solve it in an unnecessarily complex way. For example, a human might write if item in list: but an LLM might create a loop and check for membership manually—especially in more open-ended prompts. This stems from their broad training base, where they’ve “seen” many ways to solve similar problems and might overfit to more generic patterns. This complexity isn’t always wrong, but it’s often not how a developer who’s experienced in Python would approach the problem.
Advertisements
5. Inclusion of Edge Case Handling Without Necessity
LLMs often include edge case handling even when it might not be strictly necessary. For instance, in code that processes input from a clearly defined dataset, an LLM might still add checks like if input is None: or if len(array) == 0:. This behavior reflects the LLM’s bias toward generality and safety—it doesn’t know the constraints of the data unless told explicitly, so it preemptively includes protective logic. A human who understands the context may skip such checks for brevity or efficiency.
6. Code That Looks “Too Tutorial-Like”
LLM-generated code often mimics the tone and structure of programming tutorials or documentation examples.
You may see a main function with an if __name__ == "__main__": block in a script that doesn’t need it. Or functions may be more modular than necessary for the size of the task. These are patterns picked up from countless educational resources the LLM has trained on. Humans often write messier, more pragmatic code in real-world settings—especially when prototyping or exploring.
7. A Lack of Personal or Contextual Style
Every developer develops their own subtle fingerprint over time—a preference for certain idioms, naming schemes, or even whimsical variable names. LLMs, on the other hand, generate code that feels neutral and impersonal. You won’t see inside jokes in function names or highly specialized abbreviations unless prompted. The code is highly readable, but it lacks personality. While this trait can vary depending on the prompt and model temperature, it’s often noticeable in large enough codebases.
8. Uniformly Optimistic Coding Style
Finally, LLM-generated Python code often assumes a “happy path” execution style while simultaneously including some error handling. It tends to avoid more nuanced debugging strategies like logging to files, raising specific exceptions, or using breakpoint tools. This results in code that feels clean but sometimes lacks the depth of error-tracing and robustness that seasoned developers build into systems through experience and iteration.
Conclusion: Recognizing the Machine Signature
As LLMs continue to evolve and improve, the line between human- and machine-written code will become increasingly blurred. However, by paying attention to stylistic choices, verbosity, naming conventions, and structural tendencies, you can still often spot the subtle clues of an LLM’s hand in a Python script. These differences aren’t inherently bad—in fact, LLMs can write very high-quality, maintainable code—but recognizing their style is useful for educators, code reviewers, and developers working in collaborative environments where transparency about tooling is important. In the future, detecting LLM-generated code may become even more critical as we navigate the ethics and implications of AI-assisted development.
Advertisements
علامات تشير إلى أن كود بايثون الخاص بك كُتب بواسطة ذكاء اصطناعي، وليس بواسطة مطوّر بشري
Advertisements
مقدمة: صعود الشيفرة البرمجية المُولّدة من قِبل ماجستير القانون
(LLMs) في السنوات الأخيرة غيّر انتشار نماذج اللغات الكبيرة
جذرياً طريقة كتابة المطورين Codexو ChatGPT مثل
للشيفرة البرمجية وتفاعلهم معها، إذ تستطيع هذه النماذج المُدرّبة على مجموعات بيانات ضخمة من الشيفرة البرمجية واللغة الطبيعية، والآن يمكن إنشاء برامج كاملة أو حل مشكلات معقدة من خلال توجيهات بسيطة، ولكن مع ازدياد استخدامها يُطرح سؤال جديد: كيف يُمكن للمرء أن يُميّز ما إذا كان جزء من شيفرة بايثون
؟ LLM قد كُتب بواسطة مُطوّر بشري أم بواسطة
في حين أن هذه النماذج قادرة وغالباً ما يصعب تمييزها عن المبرمجين المُحنّكين للوهلة الأولى لا تزال هناك علامات دالة في بنية الشيفرة وأسلوبها ومنطقها يُمكن أن تُشير إلى أصلها الآلي
1. الإفراط في استخدام التعليقات والشروحات الحرفية
LLM من أوضح الدلائل على أن الشيفرة البرمجية قد كُتبت بواسطة
هو الإفراط في استخدام التعليقات
إلى توثيق كل خطوة من خطوات الشيفرة البرمجية LLM إذ يميل مُتخصصو
وغالباً ما يُعيدون صياغة ما هو واضح، فقد قد ترى تعليقات مثل
x = 5 قبل # create a variable
return قبل # return the result أو
مع أن التوثيق ممارسة جيدة إلا أن هذا المستوى من الإسهاب غير شائع بين المطورين البشريين ذوي الخبرة الذين عادةً ما يكتبون التعليقات فقط عندما لا يكون السياق أو المنطق واضحاً من الكود مباشرةً
لشرح وتدريب اللغة الطبيعية LLM ومع ذلك صُممت نماذج
وغالباً ما تعكس أنماطاً شبيهة بالبرامج التعليمية
2. أسماء متغيرات زائدة أو عامة جداً
أسماءً عامة وآمنة LLM غالباً ما تستخدم نماذج
data أو result أو temp أو value مثل
حتى عندما تجعل الأسماء الأكثر دلالة الكود أكثر وضوحاً، فعلى سبيل المثال: في دالة تُحلل سلوك المستخدم
session_length أو click_rate فقد يستخدم المطور البشري
بالبيانات والمقياس LLM بينما قد تلتزم نماذج
ينبع هذا التعميم من ميل النموذج إلى تجنب الافتراضات مما يؤدي إلى استخدامه لتحفظ ما لم يُطلب منه خلاف ذلك صراحةً، بالرغم من أن التسمية غير الدقيقة باستمرار – خاصةً عند وجود خيارات أفضل خاصة بالمجال – فقد تكون دليلاً قوياً
3. تنسيق وهيكلة واضحان
باتساقها الشديد فيما يتعلق بتنسيق الكود LLM تتميز برامج
ورغم أن هذه الميزة تبدو إيجابية إلا أنها قد تكون في الواقع مؤشراً خفياً، فالكود المكتوب يدوياً وخاصةً في سياقات النماذج الأولية أو غير الرسمية غالباً ما يحتوي على تناقضات طفيفة – سطر فارغ مفقود هنا أو دالة طويلة جداً في مكان آخر أو تنسيق غير متسق قليلاً لسلسلة الوثائق، برامج ماجستير إدارة الأعمال لا “تتعب” أو “تتسم بالإهمال” فمخرجاتها مرتبة بشكل غير عادي ما لم يُطلب منها خلاف ذلك
4. الإفراط في هندسة المهام البسيطة
مشكلة بسيطة LLM في بعض الأحيان تأخذ برامج
وتحلها بطريقة معقدة لا داعي لها
if item in list: فعلى سبيل المثال قد يكتب المطوّر البشري
LLM بينما قد يُنشئ مبرمجو
حلقة ويتحققون من العضوية يدوياً خاصةً في المطالبات ذات النهايات المفتوحة، ينبع هذا من قاعدة تدريبهم الواسعة حيث “اطلعوا” على العديد من الطرق لحل مشكلات مماثلة وقد يُفرطون في التكيف مع أنماط أكثر عمومية هذا التعقيد ليس خاطئاً دائماً ولكنه غالباً ما لا يكون الطريقة التي يتعامل بها مطور ذو خبرة في بايثون مع المشكلة
Advertisements
5. تضمين معالجة الحالات الشاذة دون ضرورة
معالجة الحالات الشاذة LLM غالباً ما تتضمن برامج
حتى عندما لا تكون ضرورية تماماً، فعلى سبيل المثال في الكود الذي يعالج المدخلات من مجموعة بيانات محددة بوضوح
أيضاً فحوصات LLM قد تُضيف برامج
if len(array) == 0: أو if input is None: مثل
LLM يعكس هذا السلوك تحيز برامج
نحو العمومية والسلامة فهي لا تعرف قيود البيانات إلا إذا تم إخبارها صراحةً لذا فهي تُضيف منطقاً وقائياً بشكل استباقي، قد يتجاهل الإنسان الذي يفهم السياق هذه الفحوصات للإيجاز أو الكفاءة
٦. شيفرة تبدو أشبه ببرامج تعليمية
غالباً ما تُحاكي الشيفرة المُولّدة في برامج ماجستير إدارة الأعمال أسلوب وبنية دروس البرمجة أو أمثلة التوثيق
if name == “main”: فقد ترى دالة رئيسية تحتوي على كتلة
في نص برمجي لا يحتاج إليها، أو قد تكون الدوال أكثر نمطية من اللازم لحجم المهمة، هذه أنماط مُكتسبة من مصادر تعليمية لا حصر لها تدرب عليها برنامج ماجستير إدارة الأعمال، غالباً ما يكتب البشر شيفرة أكثر تعقيداً وواقعية في بيئات واقعية خاصةً عند إنشاء النماذج الأولية أو الاستكشاف
٧. افتقار إلى الأسلوب الشخصي أو السياقي
يُكوّن كل مطور بصمة خفية خاصة به بمرور الوقت مثل تفضيل بعض التعبيرات الاصطلاحية أو أنظمة التسمية أو حتى أسماء المتغيرات الغريبة، ومن ناحية أخرى تُولّد برامج ماجستير إدارة الأعمال شيفرة تبدو محايدة وغير شخصية، لن ترى نكاتاً داخلية في أسماء الدوال أو اختصارات متخصصة للغاية إلا إذا طُلب منك ذلك، الشيفرة سهلة القراءة لكنها تفتقر إلى الشخصية، وعلى الرغم من أن هذه السمة قد تختلف اعتماداً على موجه الأوامر ودرجة حرارة النموذج إلا أنها غالباً ما تكون ملحوظة في قواعد البيانات الكبيرة بدرجة كافية
٨. أسلوب برمجة متفائل بشكل موحد
أخيراً، غالباً ما تتخذ أكواد بايثون المُولّدة من قِبل ماجستير إدارة الأعمال أسلوب تنفيذ “مُريح” مع تضمينها في الوقت نفسه بعض معالجة الأخطاء. تميل هذه الأكواد إلى تجنب استراتيجيات تصحيح الأخطاء الأكثر دقة، مثل تسجيل الدخول إلى الملفات، أو إثارة استثناءات مُحددة، أو استخدام أدوات نقاط التوقف. ينتج عن هذا أكواد تبدو نظيفة، لكنها تفتقر أحياناً إلى عمق تتبع الأخطاء والمتانة التي يُدمجها المطورون المخضرمون في الأنظمة من خلال الخبرة والتكرار.
الخلاصة: التعرف على بصمة الآلة
LLM مع استمرار تطور وتحسين برامج
سيزداد الغموض بين الكود المكتوب بواسطة الإنسان والآلة، ومع ذلك ومن خلال الانتباه إلى الخيارات الأسلوبية والإسهاب واتفاقيات التسمية والاتجاهات الهيكلية لا يزال بإمكانك في كثير من الأحيان رصد الدلائل الدقيقة لخط يد ماجستير إدارة الأعمال في نص بايثون، هذه الاختلافات ليست سيئة في جوهرها – في الواقع يستطيع طلاب ماجستير القانون كتابة أكواد برمجية عالية الجودة وقابلة للصيانة – لكن إدراك أسلوبهم مفيد للمعلمين ومراجعي الأكواد البرمجية والمطورين الذين يعملون في بيئات تعاونية حيث تكون الشفافية في استخدام الأدوات أمراً بالغ الأهمية، في المستقبل قد يصبح اكتشاف الأكواد البرمجية المُولّدة من طلاب ماجستير القانون أكثر أهمية مع بحثنا في أخلاقيات وآثار التطوير بمساعدة الذكاء الاصطناعي
Introduction: Turning Knowledge Into a Scalable Resource
In the fast-paced world of data analytics, tools, templates, and shortcuts can make the difference between working efficiently and drowning in spreadsheets. Like many data analysts, I found myself repeatedly building similar dashboards, queries, and reports for different clients or projects. It occurred to me—what if I could transform my repeatable processes and best practices into a single, powerful resource pack that others could benefit from?
Thus began the journey of creating my Data Analytics Resource Pack—a comprehensive, plug-and-play collection of tools, templates, and guides designed for analysts, students, and businesses alike. But creating it was more than just compiling files. It required strategic thinking, user research, and iteration. And the payoff? It sells consistently and is now a trusted toolset in the community.
Identifying the Need: What Analysts Were Missing
Before building anything, I asked myself a key question: “What are the biggest pain points for new and intermediate data analysts?” To answer that, I reviewed forum discussions, surveyed LinkedIn connections, and read countless Reddit threads in r/dataanalysis and r/datascience.
Common struggles I identified:
Lack of reusable, customizable Excel/Google Sheets dashboards
Confusion over structuring SQL queries efficiently
Inconsistency in visual reporting in tools like Power BI or Tableau
Poor understanding of KPI frameworks in business contexts
Too much time spent writing documentation and metadata tables manually
These insights shaped the skeleton of my resource pack. The goal was to eliminate redundancy and standardize efficiency.
Building the Pack: From Raw Ideas to Organized Assets
Once I defined the needs, I began creating assets under four key categories:
SQL & Query Optimization Templates I included frequently used query patterns (JOINs, window functions, date aggregations) with business case examples, like tracking customer churn or inventory turnover. Interactive Example: I embedded a Google Colab notebook that lets users run and tweak SQL code using SQLite in-browser.
Excel & Google Sheets Dashboards These templates covered marketing funnels, financial KPIs, and A/B test tracking. Each came with dropdown filters, conditional formatting, and slicers. Interactive Example: A pre-linked Google Sheet with editable fields that users could copy and test instantly.
Power BI / Tableau Starter Kits I included pre-configured dashboards with dummy datasets for practice. These visualizations covered product analytics, customer segmentation, and real-time sales tracking. Interactive Example: A shared Tableau Public workbook embedded via iframe with interactive filters.
Documentation & Reporting Templates Analysts often overlook documentation. I created Notion-based templates for project charters, data dictionaries, and stakeholder report briefs.
By keeping the tools modular, users could pick and choose what they needed—without being overwhelmed.
Advertisements
Packaging and Presentation: Why the Format Matters
The success of the resource pack wasn’t just about content—it was also about how I packaged it.
File Organization: Clearly named folders with version histories, separated by tool/platform
Onboarding Guide: A 10-minute “Getting Started” PDF and a Loom walkthrough video
Version Control: All files hosted on Google Drive with update notifications via email list
Bonus Content: A private Notion workspace with exclusive resources, released monthly
These extras created a premium experience that made users feel supported and guided, even after purchase.
Marketing the Right Way: Why It Gained Traction
I didn’t launch with a big ad budget. Instead, I leveraged authentic sharing and educational marketing:
LinkedIn Case Studies: I wrote posts showing before-and-after examples of using the templates
Free Mini-Packs: I gave away a subset of tools in exchange for email signups
Webinars: I hosted live walkthroughs explaining how to use the pack with real datasets
Testimonials: Early users left reviews, which I featured on my site with permission
This community-first approach created a word-of-mouth loop. People began tagging me in posts, sharing my tools in Slack groups, and recommending it in bootcamp cohorts.
Why It Sells: The Value Is Clear
The resource pack continues to sell because it saves time, solves real problems, and evolves:
Time-saving: Users get instant access to what would otherwise take months to build.
Applicability: Works across industries—finance, marketing, logistics, and e-commerce.
Continual Updates: Subscribers know they’ll get new material every quarter.
In short, the value isn’t just the tools—it’s the time, clarity, and confidence those tools bring.
Conclusion: Think Like a Problem Solver, Not Just an Analyst
Creating the Data Analytics Resource Pack taught me a crucial lesson: the best products emerge when you listen, simplify, and deliver with care. As data analysts, we already solve problems every day. Packaging that skill into a resource others can use is just the next step in leveraging your value.
If you’re a data analyst thinking about building a product, start by listening. Look at the questions people ask again and again. That’s where the opportunity lives.
Advertisements
كواليس حزمة مصادر تحليلات البيانات الخاصة بي، وسبب الطلب الكبير عليها
Advertisements
مقدمة: تحويل المعرفة إلى مورد قابل للتطوير
في عالم تحليلات البيانات سريع الخطى تُحدث الأدوات والقوالب والاختصارات فرقاً كبيراً بين العمل بكفاءة والغرق في جداول البيانات، وكحال العديد من محللي البيانات وجدتُ نفسي أُنشئ لوحات معلومات واستعلامات وتقارير متشابهة بشكل متكرر لعملاء أو مشاريع مختلفة، فخطر ببالي هذا السؤال: ماذا لو استطعتُ تحويل عملياتي المتكررة وأفضل ممارساتي إلى حزمة موارد واحدة فعّالة يستفيد منها الآخرون؟
وهكذا بدأتُ رحلة إنشاء حزمة موارد تحليلات البيانات الخاصة بي – وهي مجموعة شاملة وجاهزة للتوصيل والتشغيل من الأدوات والقوالب والأدلة المصممة للمحللين والطلاب والشركات على حد سواء، لكن إنشاءها لم يقتصر على تجميع الملفات فحسب بل تطلب تفكيراً استراتيجياً وتكراراً وبحثاً عن المستخدمين، والنتيجة؟ تُباع هذه الحزمة باستمرار وهي الآن مجموعة أدوات موثوقة في مجتمعنا
تحديد الاحتياجات: ما الذي كان ينقص المحللين
قبل البدء بأي مشروع سألت نفسي سؤالاً محورياً: ما هي أكبر نقاط الضعف التي يواجهها محللو البيانات الجدد والمتوسطون؟ للإجابة عن هذا السؤال راجعتُ مناقشات المنتديات
LinkedIn واستطلعتُ آراء معارفي على
Reddit وقرأتُ عدداً لا يُحصى من نقاشات
r/datascience و r/dataanalysis حول
:المشاكل الشائعة التي حددتها
عدم وجود لوحات معلومات قابلة لإعادة الاستخدام *
Excel/Google Sheets والتخصيص في
بكفاءة SQL ارتباك بشأن هيكلة استعلامات *
Tableau أو Power BI عدم اتساق التقارير المرئية في أدوات مثل *
ضعف فهم أطر مؤشرات الأداء الرئيسية في سياقات الأعمال *
قضاء وقت طويل في كتابة الوثائق وجداول البيانات الوصفية يدوياً *
شكّلت هذه الأفكار أساس حزمة الموارد الخاصة بي، كان الهدف هو التخلص من التكرار وتوحيد الكفاءة
بناء الحزمة: من الأفكار الخام إلى الأصول المنظمة
بمجرد تحديد الاحتياجات، بدأتُ بإنشاء أصول ضمن أربع فئات رئيسية
1- والاستعلاماتSQLقوالب تحسين
أدرجتُ أنماط الاستعلامات الشائعة الاستخدام
(ووظائف النوافذ وتجميعات البيانات JOINs)
مع أمثلة لدراسات الجدوى مثل تتبع فقدان العملاء أو دوران المخزون
Google Colab مثال: قمتُ بتضمين دفتر ملاحظات
SQL الذي يتيح للمستخدمين تشغيل وتعديل شيفرة
في المتصفح SQLite باستخدام
2– Googleوجداول بياناتExcelلوحات معلومات
غطت هذه القوالب مسارات التسويق ومؤشرات الأداء الرئيسية المالية
وجاء كل منها مزوداً بمرشحات منسدلة A/B وتتبع اختبارات
وتنسيق شرطي وشرائح
مُرتبط مسبقاً بحقول قابلة للتعديل Google مثال: جدول بيانات
يمكن للمستخدمين نسخها واختبارها فوراً
3- Power BI / Tableau Starter مجموعات
أدرجتُ لوحات معلومات مُعدّة مسبقاً مع مجموعات بيانات تجريبية للتدريب، غطت هذه التصورات تحليلات المنتج وتجزئة العملاء وتتبع المبيعات في الوقت الفعلي
عام Tableau مثال: مصنف
مع فلاتر تفاعلية iframe مشترك مُدمج عبر
4- قوالب التوثيق والتقارير
غالباً ما يغفل المحللون عن التوثيق
لمواثيق المشاريع Notion فأنشأتُ قوالب مبنية على
وقواميس البيانات وملخصات تقارير أصحاب المصلحة
من خلال الحفاظ على تصميم الأدوات بشكل معياري، تمكن المستخدمون من اختيار ما يحتاجونه دون عناء
التعبئة والعرض التقديمي: أهمية التنسيق
لم يقتصر نجاح حزمة الموارد على المحتوى فحسب بل امتد إلى كيفية تجميعها
تنظيم الملفات: مجلدات ذات أسماء واضحة مع تواريخ الإصدارات مفصولة حسب الأداة/المنصة *
مدته 10 دقائق بعنوان “البدء PDF دليل التوجيه: ملف *
Loom وفيديو توضيحي لـ
:التحكم في الإصدارات *
Google Drive جميع الملفات مُستضافة على
مع إشعارات بالتحديثات عبر قائمة البريد الإلكتروني
:محتوى إضافي *
خاصة مع موارد حصرية، تُصدر شهرياً Notion مساحة عمل
هذه الإضافات خلقت تجربة مميزة جعلت المستخدمين يشعرون بالدعم والتوجيه حتى بعد الشراء *
Advertisements
التسويق بالطريقة الصحيحة: لماذا اكتسب زخماً؟
لم أطلق مشروعي بميزانية إعلانية كبيرة بل استفدتُ من المشاركة الأصيلة والتسويق التعليمي
:LinkedIn دراسات حالة على *
كتبتُ منشوراتٍ تُظهر أمثلةً قبل وبعد استخدام القوالب
:حزم صغيرة مجانية *
قدّمتُ مجموعةً فرعيةً من الأدوات مقابل الاشتراك عبر البريد الإلكتروني
:ندوات عبر الإنترنت *
استضفتُ عروضاً توضيحيةً مباشرةً تشرح كيفية استخدام الحزمة مع مجموعات بيانات حقيقية
: شهادات *
ترك المستخدمون الأوائل تقييمات وقد نشرتُها على موقعي بإذن، هذا النهج الذي يُركّز على المجتمع أولاً خلقَ تداولاً شفهياً، بدأ الناس بالإشارة إليّ في المنشورات
Slack ومشاركة أدواتي في مجموعات
والتوصية بها في مجموعات المعسكرات التدريبية
: لماذا تُباع
لا تزال حزمة الموارد تُباع لأنها تُوفّر الوقت وتُحلّ مشاكل حقيقية وتُطوّر
توفير الوقت: يحصل المستخدمون على وصول فوري إلى ما قد يستغرق شهوراً لبنائه
قابلية التطبيق: مُناسبٌ لجميع القطاعات – المالية والتسويق والخدمات اللوجستية والتجارة الإلكترونية
تحديثات مستمرة: يعلم المشتركون أنهم سيحصلون على مواد جديدة كل ثلاثة أشهر
باختصار.. القيمة لا تقتصر على الأدوات فحسب بل تشمل أيضاً الوقت والوضوح والثقة التي توفرها هذه الأدوات
الخلاصة: فكر لحل المشكلات وليس كمجرد محلل
لقد علمني إنشاء حزمة موارد تحليلات البيانات درساً حاسماً: تظهر أفضل المنتجات عند الاستماع وتبسيط وتقديم الدعم، كمحللين للبيانات نقوم بالفعل بحل المشكلات كل يوم، تعبئة هذه المهارة في مورد يمكن للآخرين استخدامه هو مجرد الخطوة التالية في الاستفادة من قيمتك
إذا كنت محلل بيانات تفكر في بناء منتج فابدأ بالاستماع، انظر إلى الأسئلة التي يطرحها الناس مراراً وتكراراً، هذا هو المكان الذي تعيش فيه الفرصة
The integration of Artificial Intelligence (AI) into data analytics has transformed how professionals like myself work, think, and deliver results. As a data analyst, AI is not just a buzzword—it’s an everyday assistant, decision-making partner, and a powerful tool that amplifies productivity. From data cleaning to insights generation, AI supports me at every stage of the analytical process. In this article, I’ll walk you through how AI is woven into my daily workflow and why I consider it indispensable.
Streamlining Data Cleaning with AI
One of the most time-consuming aspects of data analysis is cleaning and preparing datasets. AI tools help me automate this process significantly. For instance, I use AI-enhanced spreadsheet tools and Python libraries like Pandas AI to detect outliers, impute missing values, and suggest corrections in data formatting. Previously, these steps would require manual inspection or complex if-else logic. Now, with AI’s pattern recognition, data inconsistencies are flagged automatically, and in many cases, AI even proposes the best course of action. This allows me to focus more on analytical thinking rather than tedious preprocessing.
Enhancing Data Exploration and Pattern Detection
Once the data is clean, the next step is exploration—understanding the story hidden within. Here, AI shines by accelerating the discovery of correlations and anomalies. I often rely on AI-powered visualization platforms such as Power BI with Copilot or Tableau’s Ask Data feature. These tools allow me to pose natural language questions like “Which product category had the steepest revenue decline last quarter?” and get instant, meaningful charts in return. AI doesn’t just surface insights; it guides me to patterns I might have missed, making exploratory analysis more intuitive and less biased.
Automating Routine Reports
Every analyst knows the repetitive nature of reporting—weekly sales updates, monthly performance summaries, etc. Instead of manually generating these reports, I’ve automated them using AI-driven scheduling tools that also interpret the data. Using ChatGPT via API integration, I can automatically generate narrative explanations of KPIs and append them to dashboards. The output reads like a human-written summary, which adds context for stakeholders. This saves hours of work every week and ensures consistency and clarity in reporting.
Smarter Forecasting and Predictive Modeling
AI takes my forecasting work to a new level. Traditional statistical models like ARIMA or exponential smoothing are still valuable, but AI-based forecasting models (such as those available in Facebook Prophet or AutoML platforms) can handle more variables, detect seasonality better, and adapt to sudden changes in the data. For instance, when predicting customer churn or future demand, I use machine learning models that are enhanced with AI to automatically tune hyperparameters and evaluate multiple model types in one go. This significantly increases accuracy while reducing modeling time.
Advertisements
Natural Language Processing (NLP) for Unstructured Data
A major part of modern analytics includes dealing with unstructured data—survey responses, customer reviews, chat logs, etc. AI enables me to process these text-based sources through Natural Language Processing (NLP). I use tools like spaCy, OpenAI’s embeddings, and Google Cloud NLP to classify sentiment, extract keywords, and group responses by topic. This gives structure to otherwise messy data and allows me to incorporate qualitative insights into quantitative dashboards—a powerful combination that delivers richer decision-making insights to my team.
Real-Time Data Alerts and Anomaly Detection
Rather than waiting to review data after the fact, AI empowers me to set up real-time monitoring systems. I use AI anomaly detection tools in platforms like Azure Monitor and Datadog to continuously track business metrics. If anything unusual happens—say, a 40% drop in website conversions or an unexpected spike in cost-per-click—I get instant alerts. These intelligent monitoring systems not only notify me, but also attempt to explain the root cause using contextual data. It turns reactive work into proactive insight.
Personal Productivity and Workflow Optimization
AI doesn’t just help with data—it helps with my day-to-day workflow too. I use AI writing assistants like Grammarly and ChatGPT to draft emails, explain data findings to non-technical stakeholders, and even generate technical documentation. I also rely on AI calendar assistants and meeting summarizers like Otter.ai to capture meeting notes, extract action items, and keep projects organized. By offloading mundane tasks to AI, I free up time to do what really matters: thinking critically about data and translating it into impact.
Collaborating with AI as a Thought Partner
Finally, the most surprising and transformative use of AI in my day is as a thought partner. When I hit a roadblock—say, unsure which statistical test to use or whether my data sampling approach is valid—I often turn to AI tools like ChatGPT for suggestions. It’s like brainstorming with a fast, knowledgeable colleague who can offer perspectives, generate hypotheses, or even debug my SQL queries. This collaboration doesn’t replace human judgment, but it enhances it by giving me confidence in exploring ideas more quickly.
Conclusion
The role of a data analyst is evolving fast, and AI is at the heart of that evolution. It doesn’t just make tasks faster—it makes them smarter. From improving the quality of data to sharpening insights and increasing productivity, AI is the ultimate co-pilot in my analytical journey. It’s not a luxury anymore; it’s a necessity. And as AI continues to improve, I’m excited about how much more it can enhance not only my workflow but the entire field of data analytics.
Advertisements
كيف أستخدم الذكاء الاصطناعي يومياً كمحلل بيانات؟
Advertisements
أحدث دمج الذكاء الاصطناعي في تحليلات البيانات نقلة نوعية في طريقة عمل المهنيين مثلي وتفكيرهم وتحقيقهم للنتائج، فبصفتي محلل بيانات لا يُعد الذكاء الاصطناعي مجرد مصطلح شائع بل هو مساعد يومي وشريك في اتخاذ القرارات وأداة فعّالة تُعزز الإنتاجية، من تنظيف البيانات إلى توليد الرؤى يدعمني الذكاء الاصطناعي في كل مرحلة من مراحل العملية التحليلية
في هذه المقالة سأشرح لكم كيفية دمج الذكاء الاصطناعي في سير عملي اليومي ولماذا أعتبره لا غنى عنه
تبسيط تنظيف البيانات باستخدام الذكاء الاصطناعي
يُعد تنظيف مجموعات البيانات وإعدادها من أكثر جوانب تحليل البيانات استهلاكاً للوقت، إذ تساعدني أدوات الذكاء الاصطناعي في أتمتة هذه العملية بشكل كبير، فعلى سبيل المثال أستخدم أدوات جداول البيانات المُحسّنة بالذكاء الاصطناعي
Pandas AI ومكتبات بايثون مثل
للكشف عن القيم الشاذة وحساب القيم المفقودة واقتراح تصحيحات في تنسيق البيانات، ففي السابق كانت هذه الخطوات تتطلب فحصاً يدوياً أو منطقاً معقداً، أما الآن ومع تقنية التعرف على الأنماط التي يوفرها الذكاء الاصطناعي يتم تحديد تناقضات البيانات تلقائياً وفي كثير من الحالات يقترح الذكاء الاصطناعي أفضل الحلول، هذا يسمح لي بالتركيز أكثر على التفكير التحليلي بدلاً من المعالجة المسبقة المملة
تحسين استكشاف البيانات واكتشاف الأنماط
بمجرد أن تصبح البيانات نقية تكون الخطوة التالية هي الاستكشاف – فهم ما يكمن فيها، هنا يتألق الذكاء الاصطناعي بتسريع اكتشاف الارتباطات والشذوذ، فغالباً ما أعتمد على منصات التصور المدعومة بالذكاء الاصطناعي
Copilot مع Power BI مثل
Tableau في Ask Data أو ميزة
إذ تتيح لي هذه الأدوات طرح أسئلة بلغة طبيعية مثل “ما هي فئة المنتج التي شهدت أكبر انخفاض في الإيرادات في الربع الأخير؟” والحصول على رسوم بيانية فورية وذات معنى، ولا يقتصر دور الذكاء الاصطناعي على تقديم رؤى سطحية فحسب؛ بل يرشدني إلى أنماط ربما فاتتني مما يجعل التحليل الاستكشافي أكثر سهولة وأقل تحيزاً
أتمتة التقارير الروتينية
يدرك كل محلل الطبيعة التكرارية للتقارير – تحديثات المبيعات الأسبوعية وملخصات الأداء الشهرية وما إلى ذلك، فبدلاً من إنشاء هذه التقارير يدوياً قمتُ بأتمتتها باستخدام أدوات جدولة تعتمد على الذكاء الاصطناعي والتي تفسر البيانات أيضاً،
عبر تكامل واجهة برمجة التطبيقات ChatGPT وباستخدام
يُمكنني تلقائياً إنشاء تفسيرات سردية لمؤشرات الأداء الرئيسية وإضافتها إلى لوحات المعلومات، وعليه تبدو النتائج كملخص مكتوب يدوياً مما يُضيف سياقاً لأصحاب المصلحة وهذا يُوفر ساعات من العمل أسبوعياً ويضمن الاتساق والوضوح في التقارير
التنبؤ والنمذجة التنبؤية الأكثر ذكاءً
يرتقي الذكاء الاصطناعي بعملي في التنبؤ إلى مستوى جديد، إذ لا تزال النماذج الإحصائية التقليدية
أو التنعيم الأسّي قيّمة ARIMA مثل
لكن نماذج التنبؤ القائمة على الذكاء الاصطناعي
AutoML أو Facebook Prophet مثل تلك المتوفرة في منصات
قادرة على التعامل مع المزيد من المتغيرات واكتشاف التغيرات الموسمية بشكل أفضل والتكيف مع التغيرات المفاجئة في البيانات، فعلى سبيل المثال: عند التنبؤ بانخفاض عدد العملاء أو الطلب المستقبلي أستخدم نماذج تعلّم آلي مُحسّنة بالذكاء الاصطناعي لضبط المعاملات الفائقة تلقائياً وتقييم أنواع نماذج متعددة دفعةً واحدة، هذا يزيد الدقة بشكل كبير مع تقليل وقت النمذجة
Advertisements
للبيانات غير المنظمة(NLP)معالجة اللغة الطبيعية
يشمل جزء كبير من التحليلات الحديثة التعامل مع البيانات غير المنظمة – ردود الاستبيانات وتقييمات العملاء وسجلات الدردشة.. إلخ، يُمكّنني الذكاء الاصطناعي من معالجة هذه المصادر النصية
(NLP) من خلال معالجة اللغة الطبيعية
OpenAI وتضمينات spaCy أستخدم أدوات مثل
لتصنيف المشاعر Google Cloud NLP و
واستخراج الكلمات الرئيسية وتجميع الردود حسب الموضوع، هذا يُضفي هيكلية على البيانات التي قد تكون غير منظمة ويسمح لي بدمج الرؤى النوعية في لوحات معلومات كمية – وهو مزيج قوي يُقدم رؤى أغنى لاتخاذ القرارات لفريقي
تنبيهات البيانات في الوقت الفعلي واكتشاف الشذوذ
بدلاً من انتظار مراجعة البيانات لاحقاً يُمكّنني الذكاء الاصطناعي من إعداد أنظمة مراقبة في الوقت الفعلي، إذ أستخدم أدوات كشف الشذوذ بالذكاء الاصطناعي في منصات
لتتبع مقاييس الأعمال باستمرار Datadog و Azure Monitor مثل
وفي حال حدوث أي شيء غير عادي مثل انخفاض بنسبة 40% في تحويلات مواقع الويب أو ارتفاع غير متوقع في تكلفة النقرة أتلقى تنبيهات فورية، وبالمناسبة لا تُعلمني أنظمة المراقبة الذكية هذه فحسب بل تحاول أيضاً شرح السبب الجذري باستخدام البيانات السياقية، إنها تُحوّل العمل التفاعلي إلى رؤى استباقية
الإنتاجية الشخصية وتحسين سير العمل
لا يُساعد الذكاء الاصطناعي في معالجة البيانات فحسب بل يُساعدني أيضاً في سير عملي اليومي، إذ أستخدم مساعدي كتابة الذكاء الاصطناعي
لصياغة رسائل البريد الإلكتروني ChatGPT و Grammarly مثل
وشرح نتائج البيانات لأصحاب المصلحة غير التقنيين وحتى إنشاء وثائق تقنية، كما أعتمد على مساعدي تقويم الذكاء الاصطناعي
لتسجيل ملاحظات الاجتماعات Otter.ai وملخصي الاجتماعات مثل
واستخراج بنود العمل والحفاظ على تنظيم المشاريع، فمن خلال تكليف الذكاء الاصطناعي بالمهام الروتينية أُوفر وقتاً للقيام بما هو مهم حقاً: التفكير النقدي في البيانات وترجمتها إلى نتائج ملموسة
التعاون مع الذكاء الاصطناعي كشريك فكري
وأخيراً يُعدّ استخدام الذكاء الاصطناعي كشريك فكري من أكثر الاستخدامات إثارةً للدهشة والتغيير في حياتي، فعندما أواجه عقبةً ما ، مثلاً: عدم التأكد من أي اختبار إحصائي أستخدم أو مدى صحة أسلوبي في أخذ عينات البيانات فغالباً ما ألجأ إلى أدوات الذكاء الاصطناعي
للحصول على اقتراحات ChatGPT مثل
يشبه الأمر تبادل الأفكار مع زميل سريع المعرفة قادر على تقديم وجهات نظر ووضع فرضيات
SQL أو حتى تصحيح أخطاء استعلامات
هذا التعاون لا يُغني عن الحكمة البشرية بل يُعززها إذ يمنحني الثقة في استكشاف الأفكار بسرعة أكبر
الخلاصة
يتطور دور محلل البيانات بسرعة والذكاء الاصطناعي هو جوهر هذا التطور، فهو لا يُسرّع المهام فحسب بل يجعلها أكثر ذكاءً، فمن تحسين جودة البيانات إلى تعزيز الرؤى وزيادة الإنتاجية، يُعدّ الذكاء الاصطناعي الشريك الأمثل في رحلتي التحليلية، لم يعد ترفاً بل ضرورة ومع استمرار تحسن الذكاء الاصطناعي أشعر بالحماس تجاه مدى قدرته على تعزيز ليس فقط سير العمل الخاص بي بل ومجال تحليل البيانات بأكمله
The emergence of ChatGPT has revolutionized how people seek information, learn, write, and even think. With its human-like conversation abilities, it offers instant answers, well-structured essays, and creative content on demand. For students, professionals, and content creators alike, ChatGPT has become an indispensable assistant. But hidden beneath its convenience is a growing concern: what happens to the human mind when we begin outsourcing thinking, creativity, and decision-making to an artificial entity? The very tool designed to aid us might also be dulling the edge of our mental sharpness.
Mental Laziness: Erosion of Critical Thinking
One of the most alarming mental side effects of overreliance on ChatGPT is the erosion of critical thinking. In the past, finding answers required reading multiple sources, synthesizing ideas, and forming independent conclusions. Now, with one prompt and one click, users receive refined answers without effort. This shortcut bypasses the mental workout that deep thinking demands. Gradually, people may become less inclined to question, challenge, or analyze—relying instead on the surface-level comfort of a neatly packaged AI response. This fosters mental passivity, where users consume information without truly engaging with it.
The Illusion of Understanding: False Mastery
ChatGPT can explain complex ideas with striking clarity. While this can be a tremendous asset for learning, it also breeds a dangerous illusion: the belief that one understands something simply because it has been explained well. This cognitive shortcut can lead users to feel overconfident in their knowledge, skipping the deeper stages of inquiry and practice that true mastery requires. Over time, this can create a generation of “Google-smart” individuals—who sound informed but lack the depth and resilience of real expertise.
Dependency and Decision Paralysis
Another underreported side effect is the growing dependency on AI to make even the simplest decisions. Should I send this email? How should I respond to this message? What should I say in this caption? When people begin turning to ChatGPT for these small, daily choices, their own decision-making muscles begin to atrophy. This breeds a kind of digital co-dependency that undermines confidence. In extreme cases, it may result in decision paralysis—where a person struggles to act without first consulting the AI. When intuition and self-trust weaken, even basic autonomy is compromised.
Advertisements
Suppression of Creativity: Outsourcing Original Thought
Creativity thrives on ambiguity, struggle, and the messy process of trial and error. But ChatGPT offers clean, polished ideas within seconds. While this can jumpstart a creative process, it can also short-circuit it. Writers may stop brainstorming. Designers may skip sketching. Students might avoid outlining their own thoughts before generating a perfect essay. Over time, this convenience can suppress original thought. When AI-generated content becomes the default starting point, the human mind becomes reactive rather than imaginative—limiting innovation and originality.
Emotional Disconnection and Intellectual Isolation
An unexpected psychological effect of heavy ChatGPT use is emotional detachment. When users spend more time engaging with an AI than with real people, subtle shifts in communication patterns, empathy, and emotional awareness can occur. Human conversation is messy, nuanced, and emotionally rich—qualities that AI cannot replicate. Prolonged substitution of real conversations with AI interactions may lead to a sense of emotional numbness and social withdrawal. Additionally, users may begin to internalize AI’s linguistic style, further distancing themselves from authentic self-expression.
Cognitive Offloading: The Atrophy of Memory and Learning
As with GPS reducing our ability to navigate, ChatGPT may erode our ability to retain information. When everything is a prompt away, the brain starts to offload memory and problem-solving to the machine. Why memorize facts, dates, or concepts when you can retrieve them instantly? While this might seem efficient, it comes at a cost. Cognitive offloading reduces the brain’s working memory and ability to connect ideas across time. The mental muscles required for long-term learning, recall, and synthesis begin to fade.
Conclusion: Mind the Machine
ChatGPT is a remarkable tool—capable of expanding access to knowledge, simplifying complexity, and even boosting productivity. But when used without boundaries, it quietly reshapes how we think, learn, and relate to the world. The danger lies not in the tool itself, but in the habits it cultivates. Relying too heavily on ChatGPT can dull critical thinking, weaken creativity, and erode our mental independence. To harness its power responsibly, we must strike a balance: use it as a companion, not a crutch. Let it inform, but not replace, the vital processes of human thought.
Advertisements
ChatGPTالآثار الجانبية العقلية الخطيرة للاعتماد على
Advertisements
مقدمة: سلاح ذو حدين
ثورة في كيفية بحث الناس ChatGPT أحدث ظهور
عن المعلومات والتعلم والكتابة وحتى التفكير، فبفضل قدراته في المحادثة الشبيهة بالبشر
إجابات فورية ومقالات مُحكمة ومحتوى إبداعي عند الطلب ChatGPT يُقدم
مساعداً لا غنى عنه للطلاب ChatGPT إذ أصبح
والمحترفين ومُنشئي المحتوى على حد سواء، لكن وراء هذه الراحة يكمن قلق متزايد: ماذا يحدث للعقل البشري عندما نبدأ في الاستعانة بمصادر خارجية للتفكير والإبداع واتخاذ القرارات من قِبل كيان اصطناعي؟ قد تكون الأداة نفسها المصممة لمساعدتنا هي الأخرى تُضعف حدتنا الذهنية
الكسل الذهني: تآكل التفكير النقدي
من أكثر الآثار الجانبية العقلية إثارة للقلق
هو تآكل التفكير النقدي ChatGPT للاعتماد المفرط على
ففي الماضي كان العثور على إجابات يتطلب قراءة مصادر متعددة وتوليف الأفكار والتوصل إلى استنتاجات مستقلة، أما الآن فبمجرد توجيه ونقرة واحدة يحصل المستخدمون على إجابات مُحسّنة دون عناء، هذا الاختصار يُغني عن التدريب الذهني الذي يتطلبه التفكير العميق
تدريجياً قد يقل ميل الناس للتساؤل أو التحدي أو التحليل معتمدين بدلاً من ذلك على الراحة السطحية التي توفرها استجابة الذكاء الاصطناعي المُعدّة بعناية، وهذا يُعزز السلبية الذهنية بحيث يستهلك المستخدمون المعلومات دون التفاعل معها فعلياً
وهم الفهم: إتقان زائف
شرح الأفكار المعقدة بوضوح مذهل ChatGPT يستطيع
فبينما يُعد هذا مصدراً هائلاً للتعلم إلا أنه يُولّد أيضاً وهماً خطيراً: الاعتقاد بأن المرء يفهم شيئاً ما لمجرد أنه شُرح جيداً، وعليه قد يدفع هذا الاختصار المعرفي المستخدمين إلى الشعور بثقة مفرطة في معرفتهم، متجاوزين المراحل الأعمق من البحث والممارسة التي يتطلبها الإتقان الحقيقي، ومع مرور الوقت قد يُنشئ هذا جيلاً من الأفراد “الأذكياء” الذين يبدون مطلعين لكنهم يفتقرون إلى عمق ومرونة الخبرة الحقيقية
التبعية وتعطيل اتخاذ القرار
من الآثار الجانبية الأخرى التي لا يُبلغ عنها بشكل كافٍ الاعتماد المتزايد على الذكاء الاصطناعي لاتخاذ حتى أبسط القرارات
هل يجب أن أرسل هذا البريد الإلكتروني؟
كيف يجب أن أرد على هذه الرسالة؟
ماذا يجب أن أقول في هذا التعليق؟
ChatGPT عندما يبدأ الناس باللجوء إلى
لهذه الخيارات اليومية الصغيرة تبدأ قدراتهم على اتخاذ القرارات بالضمور، وهذا يُولّد نوعاً من التبعية الرقمية المُتبادلة التي تُقوّض الثقة، وفي الحالات القصوى قد يُؤدي ذلك إلى شلل في اتخاذ القرار بحيث يُكافح الشخص للتصرف دون استشارة الذكاء الاصطناعي أولاً، وعندما يضعف الحدس والثقة بالنفس تُعرّض حتى أبسط الاستقلالية للخطر
يزدهر الإبداع في ظل الغموض والصراع وعملية التجربة والخطأ المُعقدة
ُقدّم أفكاراً واضحة ومُصقولة في ثوانٍ ChatGPT لكن
وبينما يُمكن لهذا أن يُحفّز العملية الإبداعية، إلا أنه يُمكنه أيضاً أن يُعيقها، فقد يتوقف الكُتّاب عن العصف الذهني وقد يتجنّب المُصمّمون التخطيط وقد يتجنب الطلاب تحديد أفكارهم قبل إعداد مقال مثالي، وبمرور الوقت يُمكن لهذه السهولة أن تُقمع الفكر الأصيل، فعندما يُصبح المحتوى المُولّد بواسطة الذكاء الاصطناعي نقطة البداية الافتراضية يُصبح العقل البشري تفاعلياً بدلاً من مُبتكر مما يُحدّ من الابتكار والأصالة
الانفصال العاطفي والعزلة الفكرية
من الآثار النفسية غير المتوقعة للاستخدام المفرط
هو الانفصال العاطفي ChatGPT لبرنامج
فعندما يقضي المستخدمون وقتاً أطول في التفاعل مع الذكاء الاصطناعي مقارنةً بالأشخاص الحقيقيين قد تحدث تحولات طفيفة في أنماط التواصل والتعاطف والوعي العاطفي، فالمحادثات البشرية تتسم بالفوضى والتعقيد والثراء العاطفي – وهي صفات لا يستطيع الذكاء الاصطناعي تقليدها، وقد يؤدي استبدال المحادثات الحقيقية بتفاعلات الذكاء الاصطناعي لفترات طويلة إلى شعور بالخدر العاطفي والانطواء الاجتماعي، وبالإضافة إلى ذلك قد يبدأ المستخدمون في استيعاب الأسلوب اللغوي للذكاء الاصطناعي مما يزيد من ابتعادهم عن التعبير الحقيقي عن الذات
التفريغ المعرفي: ضمور الذاكرة والتعلم
(GPS) كما هو الحال مع نظام تحديد المواقع العالمي
الذي يقلل من قدرتنا على التنقل
قدرتنا على حفظ المعلومات ChatGPT قد يُضعف
فيبدأ الدماغ في تفريغ الذاكرة وحل المشكلات للآلة، فلماذا نحفظ الحقائق أو التواريخ أو المفاهيم بينما يمكننا استرجاعها فوراً؟ مع أن هذا قد يبدو فعالاً إلا أنه يأتي بتكلفة، إذ يُضعف التفريغ المعرفي ذاكرة الدماغ العاملة وقدرته على ربط الأفكار عبر الزمن، فتبدأ العضلات العقلية اللازمة للتعلم طويل الأمد والتذكر والتركيب بالتلاشي
:الخلاصة
أداةً رائعةً قادرةً على توسيع نطاق الوصول ChatGPT يُعد
إلى المعرفة وتبسيط التعقيد وحتى تعزيز الإنتاجية، ولكن عند استخدامه دون قيود فإنه يُعيد تشكيل طريقة تفكيرنا وتعلمنا وعلاقتنا بالعالم بهدوء، لا يكمن الخطر في الأداة نفسها بل في العادات التي تُنمّيها
قد يُضعف التفكير النقدي ChatGPT فالاعتماد المفرط على
ويُضعف الإبداع ويُقوّض استقلاليتنا العقلية، ولتسخير قوته بمسؤولية يجب أن نُحقق التوازن: أن نستخدمه كرفيق لا كعكاز، دعه يُرشد ولكن لا أن يحل محل العمليات الحيوية للفكر البشري
Introduction: A Glimpse Into the Data-Driven Decade
By mid-2025, it’s hard to ignore just how central data analytics has become in shaping the modern world. Over the past decade, data has transitioned from a niche back-office function to a pillar of strategic decision-making across nearly every industry. Governments, corporations, non-profits, and startups alike have invested heavily in data infrastructure, talent, and tools to harness the predictive and diagnostic power of information. In this data-driven era, organizations that failed to embrace analytics risked irrelevance. Yet now, the conversation is beginning to shift. With the rise of automation, increasing regulatory constraints, and a maturing marketplace, many professionals and business leaders are asking a sobering question: Is the window of opportunity in data analytics starting to close? This article explores that question through the lens of innovation, labor dynamics, regulatory change, and strategic transformation.
Automation and Generative AI: Shifting the Value Proposition
One of the most significant developments reshaping data analytics in 2025 is the rise of generative AI and automated analytical tools. The introduction of large language models (LLMs), AutoML systems, and user-friendly interfaces has made it dramatically easier for non-technical users to perform complex data tasks. Business users can now query databases using natural language, generate predictive models without writing a single line of code, and visualize insights in seconds with AI-assisted dashboards. On the surface, this democratization seems like a triumph—organizations can make data-informed decisions faster and more affordably. But this progress also raises fundamental questions about the role of the traditional data analyst. As machines increasingly handle the technical execution, the core value of the human analyst is being reevaluated. Analysts are now expected to do more than produce models—they must contextualize findings, apply domain-specific judgment, and align recommendations with organizational strategy. The opportunity isn’t gone—but it’s moving up the value chain, demanding greater business fluency and creative problem-solving from data professionals.
Talent Saturation and the Evolving Skill Landscape
Between 2015 and 2023, the exploding demand for data professionals sparked a global wave of upskilling. Universities launched new degrees, online platforms offered certification bootcamps, and employers invested in internal training. By 2025, this momentum has resulted in an abundant talent pool—especially at the entry level. Roles that once required rare skills are now more accessible, and basic competencies in Python, SQL, and data visualization are often considered standard. As a result, competition has intensified, and salaries for junior roles have plateaued or declined in some regions. The most sought-after professionals today are not just data-literate—they are domain experts who can speak the language of the industry they serve. For example, a data scientist with deep knowledge of supply chain operations is more valuable to a logistics company than a generalist analyst with broader but shallower capabilities. The market no longer rewards technical skills alone; instead, it favors hybrid professionals who bring cross-disciplinary insight and the ability to turn raw data into strategic intelligence.
Advertisements
Regulatory Constraints and the Ethics of Data Use
As the power of data has grown, so too have the concerns around how it is collected, stored, and applied. In 2025, data privacy is no longer a peripheral issue—it’s at the heart of digital governance. Stringent regulatory frameworks such as the General Data Protection Regulation (GDPR), the California Consumer Privacy Act (CCPA), and new legislation emerging across Asia and Latin America have fundamentally altered the landscape. Organizations must now navigate a complex web of compliance, consent, data sovereignty, and transparency. Additionally, high-profile data breaches and ethical missteps have made the public more skeptical about how their information is used. As a result, companies are increasingly investing in privacy-preserving technologies like differential privacy, federated learning, and synthetic data. This environment places new responsibilities on data professionals, who must balance analytical ambition with legal and ethical prudence. The opportunity to innovate remains—but it must now be done within a framework of accountability, trust, and regulatory foresight.
Organizational Maturity: From Excitement to Execution
In the early years of the data revolution, many organizations embraced analytics with a sense of experimental enthusiasm. Data teams were given free rein to explore, build models, and produce dashboards—often with little scrutiny over business outcomes. In 2025, that phase has largely passed. Executives are demanding clear ROI on data investments. Boards want to see how analytics drives revenue, reduces costs, or creates competitive advantage. This pressure has led to a more mature approach to data operations. Rather than treating data science as a standalone function, organizations are embedding analytics within core business units—ensuring that insights are not only generated but also implemented. Analysts and data scientists are now working side-by-side with marketing, finance, operations, and product teams to shape initiatives and measure success. This evolution requires professionals to be as comfortable in a business meeting as they are with a Jupyter notebook. The data analytics field is not contracting—it’s consolidating into a more structured, accountable, and business-oriented discipline.
Conclusion: A Tighter Window, But a Deeper Opportunity
So, is the window of opportunity closing for data analytics in 2025? The answer depends on how you define opportunity. For those who seek easy entry and quick rewards, the landscape is indeed more challenging. The influx of talent, automation of routine tasks, and rising expectations mean that superficial skills are no longer enough. But for those willing to adapt, specialize, and deepen their impact, the opportunities are arguably greater than ever. The field is evolving from an experimental frontier to a critical enterprise function. It demands a new kind of professional—one who can navigate technology, ethics, business, and human behavior. In that sense, the window hasn’t closed—it’s simply moved higher. Those who reach for it with a broader set of skills and a deeper understanding of context will find it still wide open.
Advertisements
عام ٢٠٢٥ وتحليل البيانات: هل تضيق نافذة الفرص؟
Advertisements
مقدمة: لمحة عن عقد البيانات
مع انتصاف عام 2025 يصعب تجاهل الدور المحوري الذي اكتسبته تحليلات البيانات في تشكيل عالمنا الحديث، فعلى مدار العقد الماضي تحولت البيانات من وظيفة إدارية متخصصة إلى ركيزة أساسية في صنع القرار الاستراتيجي في جميع القطاعات تقريباً، وقد استثمرت الحكومات والشركات والمنظمات غير الربحية والشركات الناشئة على حد سواء بكثافة في البنية التحتية للبيانات والمواهب والأدوات اللازمة لتسخير القوة التنبؤية والتشخيصية للمعلومات، ففي هذا العصر الذي تعتمد فيه البيانات على البيانات تُواجه المؤسسات التي لم تتبنَّ التحليلات خطر فقدان أهميتها، ومع ذلك بدأ النقاش يتحول الآن، فمع صعود الأتمتة وتزايد القيود التنظيمية ونضوج السوق يطرح العديد من المهنيين وقادة الأعمال سؤالاً جاداً: هل بدأت نافذة الفرص المتاحة في تحليلات البيانات تضيق؟ تستكشف هذه المقالة هذا السؤال من منظور الابتكار وديناميكيات العمل والتغيير التنظيمي والتحول الاستراتيجي
الأتمتة والذكاء الاصطناعي التوليدي: تغيير عرض القيمة
يُعدّ ظهور الذكاء الاصطناعي التوليدي وأدوات التحليل الآلي من أهم التطورات التي تُعيد تشكيل تحليلات البيانات في عام 2025
AutoML وأنظمة (LLMs) وقد سهّل إدخال نماذج اللغات الكبيرة
والواجهات سهلة الاستخدام بشكل كبير على المستخدمين غير التقنيين أداء مهام البيانات المعقدة، فأصبح بإمكان مستخدمي الأعمال الآن الاستعلام عن قواعد البيانات باستخدام اللغة الطبيعية وإنشاء نماذج تنبؤية دون الحاجة إلى كتابة سطر واحد من التعليمات البرمجية وتصور الرؤى في ثوانٍ معدودة باستخدام لوحات معلومات مدعومة بالذكاء الاصطناعي، فللوهلة الأولى يبدو هذا التحول الديمقراطي بمثابة انتصار – إذ يُمكن للمؤسسات اتخاذ قرارات مستنيرة بالبيانات بشكل أسرع وبتكلفة أقل، إلا أن هذا التقدم يثير أيضاً تساؤلات جوهرية حول دور محلل البيانات التقليدي، فمع تزايد تولي الآلات للتنفيذ الفني تُعاد تقييم القيمة الأساسية للمحلل البشري، إذ يُتوقع من المحللين الآن أن يفعلوا أكثر من مجرد إنتاج النماذج – بل يجب عليهم وضع النتائج في سياقها الصحيح وتطبيق أحكام خاصة بمجال معين ومواءمة التوصيات مع استراتيجية المؤسسة، لم تنتهِ الفرصة بعد بل إنها تتقدم في سلسلة القيمة مطالبةً متخصصي البيانات بإتقان أكبر للأعمال وإبداع في حل المشكلات
تشبع المواهب وتطور مشهد المهارات
بين عامي 2015 و2023 أشعل الطلب المتزايد على متخصصي البيانات موجة عالمية من الارتقاء بالمهارات، إذ أطلقت الجامعات برامج دراسية جديدة وقدمت منصات إلكترونية دورات تدريبية للحصول على شهادات واستثمر أصحاب العمل في التدريب الداخلي، فبحلول عام 2025 أدى هذا الزخم إلى وفرة في المواهب لا سيما في مستوى المبتدئين، فأصبحت الأدوار التي كانت تتطلب مهارات نادرة في السابق أكثر سهولة الآن
SQLوغالباً ما تُعتبر الكفاءات الأساسية في بايثون و
وتصور البيانات أساسية، ونتيجة لذلك اشتدت المنافسة وتوقفت رواتب المناصب المبتدئة أو انخفضت في بعض المناطق، وعليه فإن أكثر المتخصصين طلباً اليوم ليسوا مجرد متعلمين في مجال البيانات بل هم خبراء في هذا المجال يتحدثون لغة الصناعة التي يخدمونها، فعلى سبيل المثال يُعدّ عالم البيانات ذو المعرفة العميقة بعمليات سلسلة التوريد أكثر قيمةً لشركة لوجستية من محلل عامّ بقدرات أوسع وإن كانت سطحية، ولم يعد السوق يكافئ المهارات التقنية فحسب بل يُفضّل المهنيين الهجينين الذين يُقدّمون رؤىً متعددة التخصصات والقدرة على تحويل البيانات الخام إلى معلومات استخباراتية استراتيجية
Advertisements
القيود التنظيمية وأخلاقيات استخدام البيانات
مع تنامي قوة البيانات تزايدت المخاوف بشأن كيفية جمعها وتخزينها وتطبيقها، ففي عام 2025 لم تعد خصوصية البيانات مسألةً هامشية بل أصبحت في صميم الحوكمة الرقمية، فقد غيّرت الأطر التنظيمية الصارمة
(GDPR) مثل اللائحة العامة لحماية البيانات
(CCPA) وقانون خصوصية المستهلك في كاليفورنيا
والتشريعات الجديدة الناشئة في جميع أنحاء آسيا وأمريكا اللاتينية غيّرت المشهدَ بشكل جذري، إذ يجب على المؤسسات الآن التعامل مع شبكة معقدة من الامتثال والموافقة وسيادة البيانات والشفافية، بالإضافة إلى ذلك أدت خروقات البيانات البارزة والأخطاء الأخلاقية إلى زيادة تشكيك الجمهور في كيفية استخدام معلوماتهم، نتيجةً لذلك تستثمر الشركات بشكل متزايد في تقنيات الحفاظ على الخصوصية مثل الخصوصية التفاضلية والتعلم الفيدرالي والبيانات التركيبية، فتُلقي هذه البيئة بمسؤوليات جديدة على عاتق متخصصي البيانات الذين يجب عليهم الموازنة بين الطموح التحليلي والحصافة القانونية والأخلاقية، إذ لا تزال فرصة الابتكار قائمة ولكن يجب أن يتم ذلك الآن في إطار من المساءلة والثقة والاستشراف التنظيمي
النضج التنظيمي: من الحماس إلى التنفيذ
في السنوات الأولى لثورة البيانات تبنّت العديد من المؤسسات التحليلات بحماس تجريبي، فمُنحت فرق البيانات حرية كاملة لاستكشاف البيانات وبناء النماذج وإنتاج لوحات المعلومات غالباً مع تدقيق محدود لنتائج الأعمال، ففي عام 2025 انقضت هذه المرحلة إلى حد كبير، إذ يطالب المدراء التنفيذيون بعائد استثمار واضح على استثمارات البيانات، وترغب مجالس الإدارة في معرفة كيف تُعزز التحليلات الإيرادات وتُخفض التكاليف أو تُنشئ ميزة تنافسية، وقد أدى هذا الضغط إلى نهج أكثر نضجاً لعمليات البيانات، فبدلاً من اعتبار علم البيانات وظيفة مستقلة تُدمج المؤسسات التحليلات ضمن وحدات الأعمال الأساسية مما يضمن ليس فقط توليد الرؤى بل تنفيذها أيضاً ويعمل المحللون وعلماء البيانات الآن جنباً إلى جنب مع فرق التسويق والمالية والعمليات والمنتجات لصياغة المبادرات وقياس النجاح، ويتطلب هذا التطور من المهنيين أن يكونوا مرتاحين في اجتماعات العمل
Jupyter كما هم مع دفتر ملاحظات
إذاً مجال تحليلات البيانات لا يتقلص بل يتجه نحو تخصص أكثر هيكلية ومساءلة وتركيزاً على الأعمال
الخلاصة: نافذة أضيق لكن فرصة أعمق
إذاً هل تُغلق نافذة الفرص أمام تحليلات البيانات في عام ٢٠٢٥؟ يعتمد الجواب على كيفية تعريفك للفرصة، فبالنسبة لمن يسعون إلى دخول سهل ومكافآت سريعة فإن المشهد أكثر صعوبة، فتدفق المواهب وأتمتة المهام الروتينية وارتفاع التوقعات يعني أن المهارات السطحية لم تعد كافية، أما بالنسبة لمن يرغبون في التكيف والتخصص وتعميق تأثيرهم فيمكن القول إن الفرص أكبر من أي وقت مضى، فهذا المجال يتطور من مجرد مجال تجريبي إلى وظيفة مؤسسية حيوية، إذ يتطلب نوعاً جديداً من المهنيين – شخصاً قادراً على التعامل مع التكنولوجيا والأخلاقيات والأعمال والسلوك البشري، وبهذا المعنى لم تُغلق النافذة بل توسعت! أما أولئك الذين يسعون إليها بمجموعة أوسع من المهارات وفهم أعمق للسياق فسيجدونها لا تزال مفتوحة على مصراعيها
SQL (Structured Query Language) continues to be an essential skill for data analysts, data scientists, backend developers, and database administrators. Interviewers often assess a candidate’s ability to query, manipulate, and understand data stored in relational databases. Below are ten fundamental SQL interview questions every job seeker should be prepared to solve. Each section includes a discussion of the concept behind the question and how to approach solving it.
1. Finding the Second Highest Salary
A classic question that tests both your understanding of subqueries and ordering data is: “How do you find the second highest salary from a table named Employees with a column Salary?” This question challenges the candidate to think beyond the basic MAX() function. The most common approach involves using a subquery to exclude the highest salary. For instance, you might write:
This SQL statement works by first retrieving the highest salary using the inner query and then selecting the next maximum value that is less than this result. Alternatively, one can use the DENSE_RANK() or ROW_NUMBER() window function to assign a rank to each salary and filter for the second position, which is often the preferred method in real-world scenarios due to better flexibility and performance on large datasets.
2. Retrieving Duplicate Records
Interviewers often want to assess your ability to detect and handle duplicates in a dataset. A common formulation is: “Find all duplicate email addresses in a Users table.” Solving this requires knowledge of grouping and filtering. The typical solution groups by the email field and uses the HAVING clause to count occurrences greater than one:
This query groups all the rows by email and then filters out groups that appear only once, revealing only those with duplicates. Understanding how to use GROUP BY in conjunction with HAVING is crucial for this type of question, and being able to extend this to return the full duplicate rows can show deeper SQL proficiency.
3. Joining Tables to Combine Information
An essential part of SQL interviews involves joining multiple tables. One typical question might be: “List all employees and their department names from Employees and Departments tables.” This tests your understanding of foreign keys and join operations. Assuming Employees has a DepartmentID field that relates to Departments.ID, the query would be:
This inner join ensures that only employees with a valid department ID in the Departments table are returned. Being comfortable with inner joins, left joins, and understanding when to use each is vital, as real-world databases are often normalized across many tables.
4. Aggregating Data with GROUP BY
A frequently asked question focuses on aggregation, such as: “Find the number of employees in each department.” This requires using GROUP BY along with aggregate functions like COUNT(). The solution would look like this:
This query groups the employees by their department and counts how many belong to each. Candidates should also be prepared to join this with the Departments table if the interviewer asks for department names instead of IDs. Mastery of aggregate functions is a critical skill for reporting and dashboard development.
5. Filtering with WHERE and HAVING
Sometimes interviewers combine conditions in the WHERE and HAVING clauses to see if you can distinguish their roles. For example: “List departments having more than 10 employees and located in ‘New York.’” Here, WHERE is used for row-level filtering, and HAVING for group-level. The query would be:
This structure filters rows before aggregation and then filters groups after aggregation. Misplacing conditions (like using HAVING where WHERE should be) is a common pitfall interviewers watch for.
Advertisements
6. Using CASE Statements for Conditional Logic
Another insightful question is: “Write a query that classifies employees as ‘Senior’ if their salary is above 100,000, and ‘Junior’ otherwise.” This tests the use of CASE for deriving new columns based on logic. The solution might look like this:
The CASE expression allows for readable conditional logic within SELECT statements. It’s commonly used in dashboards, reports, and when transforming raw data for business use.
7. Ranking Data with Window Functions
Advanced interviews often include questions about window functions. A common one is: “Rank employees by salary within each department.” This requires partitioning and ordering data within groups. The SQL might look like:
Window functions like RANK(), DENSE_RANK(), and ROW_NUMBER() are powerful tools for ranking and running totals. Demonstrating knowledge of PARTITION BY and ORDER BY clauses within OVER() shows a deeper understanding of SQL.
8. Finding Records Without Matches
A common real-world scenario is identifying rows that don’t have a corresponding entry in another table. A typical question might be: “Find all customers who have not placed any orders.” This requires a LEFT JOIN with a NULL check:
This query joins the two tables and filters to find customers with no related order. It tests your understanding of outer joins and NULL handling, a frequent need in reporting and data quality checks.
9. Working with Dates and Time Ranges
Handling date-based queries is another key interview area. One question could be: “Find all orders placed in the last 30 days.” This requires using date functions like CURRENT_DATE (or GETDATE() in some dialects):
Interviewers might follow up by asking for orders grouped by week or month, testing your knowledge of date formatting, truncation, and aggregation. Comfort with time functions is essential for real-world reporting.
10. Deleting or Updating Based on a Subquery
Finally, you might be asked to perform a DELETE or UPDATE using a condition derived from a subquery. For example: “Delete all products that were never ordered.” This combines filtering with referential logic:
Alternatively, a more performant version might use NOT EXISTS:
This type of question ensures you understand how to manipulate data safely using subqueries and conditions.
Conclusion
Mastering these ten SQL questions is more than just interview prep—it builds a foundation for solving real-world data challenges. Whether filtering data with precision, writing complex joins, or leveraging window functions for advanced analytics, these exercises develop fluency in SQL’s powerful capabilities. To further improve, practice variations of these questions, explore optimization techniques, and always be prepared to explain the logic behind your approach during interviews.
Advertisements
SQLعشر أسئلة قد تُحدد نجاحك أو فشلك في مقابلة
Advertisements
SQL لا تزال لغة الاستعلامات الهيكلية
مهارة أساسية لمحللي البيانات وعلماء البيانات ومطوري البرامج الخلفية ومديري قواعد البيانات، فغالباً ما يُقيّم القائمون على المقابلات قدرة المرشح على الاستعلام عن البيانات المخزنة في قواعد البيانات العلائقية ومعالجتها وفهمها، وفيما يلي عشرة أسئلة أساسية
SQL في مقابلات العمل بلغة
ينبغي على كل باحث عن عمل الاستعداد للإجابة عليها، بحيث يتضمن كل قسم مناقشة للمفهوم الكامن وراء السؤال وكيفية التعامل معه
1. إيجاد ثاني أعلى راتب
من الأسئلة الكلاسيكية التي تختبر فهمك للاستعلامات الفرعية وترتيب البيانات: كيف تجد ثاني أعلى راتب من جدول الموظفون مع عمود الراتب؟
الأساسية MAX() يتحدى هذا السؤال المرشح للتفكير فيما يتجاوز دالة
:بحيث تتضمن الطريقة الأكثر شيوعاً استخدام استعلام فرعي لاستبعاد أعلى راتب، فعلى سبيل المثال، يمكنك كتابة
SQL تعمل عبارة
هذه عن طريق استرجاع أعلى راتب باستخدام الاستعلام الداخلي ثم اختيار القيمة القصوى التالية الأقل من هذه النتيجة
ROW_NUMBER() أو DENSE_RANK() كبديل يُمكن استخدام دالة النافذة
لتعيين رتبة لكل راتب وتصفية المرتبة الثانية وهي غالباً الطريقة المُفضّلة في الحالات العملية نظراً لمرونتها وأدائها الأفضل على مجموعات البيانات الكبيرة
٢. استرداد السجلات المكررة
غالباً ما يرغب القائمون على المقابلات في تقييم قدرتك على اكتشاف السجلات المكررة ومعالجتها في مجموعة بيانات، فإحدى الصيغ الشائعة هي: البحث عن جميع عناوين البريد الإلكتروني المكررة في جدول المستخدمين يتطلب حل هذه المشكلة معرفةً بالتجميع والتصفية، بحيث يقوم الحل النموذجي بالتجميع حسب حقل البريد الإلكتروني
لحساب عدد مرات التكرار التي تزيد عن واحد HAVING ويستخدم شرط
يقوم هذا الاستعلام بتجميع جميع الصفوف حسب البريد الإلكتروني ثم يُرشِّح المجموعات التي تظهر مرة واحدة فقط ويكشف فقط عن المجموعات المكررة
HAVING مع GROUP BY يُعدّ فهم كيفية استخدام
أمراً بالغ الأهمية لهذا النوع من الأسئلة والقدرة على توسيع نطاقه لعرض جميع الصفوف المكررة
SQL يُظهر إتقاناً أعمق للغة
٣. ربط الجداول لدمج المعلومات
SQL يُعد ربط عدة جداول جزءاً أساسياً من مقابلات
قد يكون أحد الأسئلة الشائعة: اذكر جميع الموظفين وأسماء أقسامهم من جدولي الموظفين والأقسام، إذ يختبر هذا فهمك للمفاتيح الخارجية وعمليات الربط، وبافتراض أن حقل الموظفين
Departments.ID يحتوي على حقل معرف القسم المرتبط بـ
:سيكون الاستعلام كما يلي
يضمن هذا الربط الداخلي عرض الموظفين الذين لديهم معرف قسم صالح
Departments فقط في جدول
بحيث يُعدّ إتقان الربط الداخلي والربط الأيسر وفهم وقت استخدام كل منهما أمراً بالغ الأهمية، فغالباً ما يتم توحيد قواعد البيانات الفعلية عبر العديد من الجداول
4. GROUP BYتجميع البيانات باستخدام
يُركز سؤال شائع على التجميع مثل: ابحث عن عدد الموظفين في كل قسم
GROUP BY ويتطلب هذا استخدام
:سيكون الحل كالتالي COUNT() مع دوال التجميع مثل
يُجمّع هذا الاستعلام الموظفين حسب قسمهم ويحسب عدد الموظفين في كل قسم، ويجب على المرشحين أيضاً الاستعداد لربط هذا الاستعلام بجدول الأقسام إذا طلب المُقابل أسماء الأقسام بدلاً من مُعرّفاتها، ويُعدّ إتقان دوال التجميع مهارةً أساسيةً لإعداد التقارير وتطوير لوحات المعلومات
5. HAVINGوWHEREالتصفية باستخدام
HAVINGو WHERE أحياناً يجمع المُقابلون الشروط في جملتي
لمعرفة ما إذا كان يُمكن تمييز أدوارهم، فعلى سبيل المثال: اذكر الأقسام التي تضم أكثر من ١٠ موظفين وتقع في نيويورك
HAVING للتصفية على مستوى الصف و WHERE وهنا يُستخدم
للتصفية على مستوى المجموعة، لذا سيكون الاستعلام كالتالي
يُصفّي هذا الهيكل الصفوف قبل التجميع ثم يُصفّي المجموعات بعد التجميع، ويُعدّ وضع الشروط في غير موضعها
WHERE حيث يجب أن يكون HAVING مثل استخدام
خطأً شائعاً يحذر منه المُقابلون
Advertisements
6. للمنطق الشرطيCASEاستخدام عبارات
سؤالٌ آخر مُفيد: اكتب استعلاماً يُصنّف الموظفين إلى كبار إذا كان راتبهم أعلى من 100,000 ومبتدئ في غير ذلك
لاشتقاق أعمدة جديدة بناءً على المنطق CASE فيختبر هذا استخدام
:قد يبدو الحل كالتالي
SELECT بمنطق شرطي سهل القراءة ضمن عبارات CASE يسمح تعبير
ويُستخدم عادةً في لوحات المعلومات والتقارير وعند تحويل البيانات الخام للاستخدام التجاري
7. ترتيب البيانات باستخدام دوال النافذة
غالباً ما تتضمن المقابلات المتقدمة أسئلة حول دوال النافذة، ومن الأسئلة الشائعة: رتب الموظفين حسب الراتب في كل قسم، يتطلب هذا تقسيم البيانات وترتيبها داخل مجموعات
:كما يلي SQL وعليه قد يبدو
:تُعد دوال النافذة مثل
RANK(), DENSE_RANK(), ROW_NUMBER()
أدوات فعّالة لترتيب الإجماليات وإجرائها
ORDER BYو PARTITION BY ويُظهر إثبات معرفة جملتي
SQL فهماً أعمق لـ OVER() ضمن
8. البحث عن سجلات بدون تطابقات
من السيناريوهات الشائعة في الحياة العملية تحديد الصفوف التي لا تحتوي على مُدخل مُقابل في جدول آخر، قد يكون السؤال النموذجي: البحث عن جميع العملاء الذين لم يُقدموا أي طلبات
:NULL مع فحص LEFT JOIN يتطلب هذا استخدام
يربط هذا الاستعلام الجدولين ويُرشّح للعثور على العملاء الذين ليس لديهم طلب مُرتبط
NULL يختبر هذا فهمك للروابط الخارجية ومعالجة
وهي حاجة شائعة في إعداد التقارير وفحص جودة البيانات
9. العمل مع التواريخ والنطاقات الزمنية
تُعد معالجة الاستعلامات القائمة على التاريخ مجالاً رئيسياً آخر للمقابلات، فقد يكون أحد الأسئلة: البحث عن جميع الطلبات المُقدمة خلال آخر 30 يوماً، ويتطلب هذا استخدام دوال التاريخ مثل
في بعض اللهجات GETDATE() أو CURRENT_DATE
قد يطلب القائمون على المقابلات طلبات مُجمّعة حسب الأسبوع أو الشهر، ولاختبار معرفتك بتنسيق التاريخ والاقتطاع والتجميع، وعليه يُعدّ الإتقان في استخدام دوال الوقت أمراً أساسياً لإعداد التقارير العملية
10. الحذف أو التحديث بناءً على استعلام فرعي
أخيراً قد يُطلب منك إجراء حذف أو تحديث باستخدام شرط مُشتق من استعلام فرعي، فعلى سبيل المثال: حذف جميع المنتجات التي لم تُطلب أبداً، يجمع هذا بين التصفية والمنطق المرجعي
كبديل قد تستخدم نسخة أكثر فعالية : غير موجود
الخلاصة
العشر هذه SQL إن إتقان أسئلة
لا يقتصر على مجرد التحضير للمقابلة، بل يُرسي أساساً لحل تحديات البيانات العملية، فسواءً كنتَ تُرشِّح البيانات بدقة أو تكتب عمليات ربط معقدة أو تستخدم وظائف النوافذ للتحليلات المتقدمة فإن هذه التمارين تُنمّي إتقانك لقدرات هذه اللغة القوية، ولمزيد من التحسين تدرب على أشكال مختلفة من هذه الأسئلة واستكشف تقنيات التحسين وكن مستعداً دائماً لشرح منطق منهجك أثناء المقابلات
Whether you’re a job-seeking data scientist or a software engineer expanding into AI, one challenge keeps coming up: “Can you explain how this machine learning model works?”
Interviews are not exams — they’re storytelling sessions. Your technical accuracy matters, but your communication skills set you apart.
Let’s break down how to explain the core ML models so any interviewer — technical or not — walks away confident in your understanding.
1. Linear Regression
Goal: Predict a continuous value How to Explain: “Linear regression is like drawing the best-fit straight line through a cloud of points. It finds the line that minimizes the distance between the actual values and the predicted ones using a technique called least squares.”
Pro Tip: Add a real-world example:
“For example, predicting house prices based on square footage.”
Interview bonus: Explain assumptions like linearity, homoscedasticity, and multicollinearity if prompted.
2. Logistic Regression
Goal: Predict probability (classification) How to Explain: “It’s like linear regression, but instead of predicting a number, we predict the probability that something is true — like whether an email is spam. It uses a sigmoid function to squash the output between 0 and 1.”
Common trap: Many confuse it with regression.
Clarify early: “Despite the name, it’s used for classification.”
3. Decision Trees
Goal: Easy-to-interpret classification/regression How to Explain: “Imagine making decisions by asking a sequence of yes/no questions — that’s a decision tree. It splits data based on feature values to make decisions. Each internal node is a question; each leaf is an outcome.”
Highlight interpretability:
“They’re great when you need to explain why a decision was made.”
4. Random Forest
Goal: Improve accuracy, reduce overfitting How to Explain: “It’s like asking a group of decision trees and taking a majority vote (for classification) or averaging their results (for regression). Each tree is trained on a different subset of data and features.”
Metaphor: “Think of it as crowd wisdom — combining many simple models to make a more robust one.”
5. Support Vector Machine (SVM)
Goal: Maximum margin classification How to Explain: “SVM tries to draw the widest possible gap (margin) between two classes. It finds the best boundary so that the closest points of each class are as far apart as possible.”
Interview tip: “It can also work in higher dimensions using kernels — which helps when the data isn’t linearly separable.”
Advertisements
6. K-Nearest Neighbors (KNN)
Goal: Lazy classification based on proximity How to Explain: “KNN looks at the k closest data points to a new point and makes a decision based on the majority label. It’s like saying: ‘Let’s ask the neighbors what class this belongs to.’”
Note: “No training phase — it stores the training data and computes distances at prediction time.”
7. Naive Bayes
Goal: Probabilistic classification How to Explain: “It uses Bayes’ Theorem to predict a class, assuming all features are independent. That’s the naive part. Despite the simplification, it works well in text classification like spam filtering.”
Use case: “Gmail uses something similar to detect spam based on word frequencies.”
8. Gradient Boosting (e.g., XGBoost, LightGBM)
Goal: Strong prediction from weak learners How to Explain: “Gradient boosting builds models sequentially — each new model tries to fix the errors of the previous one. It’s like learning from mistakes in stages.”
Why it stands out: “They’re often used in Kaggle competitions due to high accuracy and performance tuning.”
9. K-Means Clustering
Goal: Group similar data points (unsupervised) How to Explain: “K-Means divides data into clusters by minimizing the distance between points and the center of each cluster. The number of clusters k is set beforehand.”
Simplify: “It’s like putting customers into different buckets based on their purchase patterns.”
Final Tip: Tailor to the Interview
When explaining any model, remember this simple formula:
What it does
How it works (intuitively)
When to use it
Real-world example
Let’s Discuss:
What’s your go-to analogy or trick when explaining ML models in interviews? Which model do you find hardest to explain clearly?
Drop your thoughts below Let’s build a library of intuitive explanations together.
Advertisements
دليل لمناقشة نماذج التعلم الآلي الأساسية في مقابلات العمل باحترافية
Advertisements
سواء كنتَ عالم بيانات باحثاً عن عمل أو مهندس برمجيات تتوسع في مجال الذكاء الاصطناعي فإن أحد التحديات التي تواجهك باستمرار
“هل يمكنك شرح كيفية عمل نموذج التعلم الآلي هذا؟ “
المقابلات ليست امتحانات بل جلسات سرد قصص، فدقتك التقنية مهمة لكن مهاراتك في التواصل تميزك
دعونا نشرح بالتفصيل كيفية شرح نماذج التعلم الآلي الأساسية حتى يثق بفهمك أي مُقابل سواءً أكان تقنياً أم لا
1. الانحدار الخطي
الهدف: التنبؤ بقيمة مستمرة
:كيفية الشرح
“الانحدار الخطي أشبه برسم خط مستقيم مناسب عبر سحابة من النقاط، فهو يجد الخط الذي يُقلل المسافة بين القيم الفعلية والقيم المتوقعة باستخدام تقنية تُسمى المربعات الصغرى”
نصيحة احترافية: أضف مثالاً من الواقع
“على سبيل المثال: التنبؤ بأسعار المنازل بناءً على المساحة المربعة”
مكافأة المقابلة: اشرح افتراضات مثل الخطية وتجانس التباين والتعدد الخطي إذا طُلب منك ذلك
2. الانحدار اللوجستي
الهدف: التنبؤ بالاحتمالية (التصنيف)
:كيفية الشرح
“يشبه الانحدار الخطي ولكن بدلاً من التنبؤ برقم نتوقع احتمالية صحة أمر ما ( مثل ما إذا كان البريد الإلكتروني بريداً عشوائياً أم لا، فيستخدم دالة سيجمايد لضغط المخرجات بين 0 و1”
خطأ شائع: يخلط الكثيرون بينه وبين الانحدار، وضح ذلك مبكراً: “على الرغم من اسمه فهو يُستخدم للتصنيف
3. أشجار القرار
الهدف: تصنيف/انحدار سهل التفسير
:كيفية الشرح
تخيل اتخاذ القرارات بطرح سلسلة من أسئلة إجاباتها بنعم أو لا – هذه هي شجرة القرار- إذ تُقسّم البيانات بناءً على قيم الميزات لاتخاذ القرارات وكل عقدة داخلية هي سؤال وكل ورقة هي نتيجة
:تسليط الضوء على قابلية التفسير
“إنها رائعة عند الحاجة لشرح سبب اتخاذ قرار ما”
4. الغابة العشوائية
الهدف: تحسين الدقة والحد من الإفراط في التجهيز
:كيفية الشرح
“يشبه الأمر طلب رأي مجموعة من أشجار القرار والحصول على تصويت الأغلبية (للتصنيف) أو حساب متوسط نتائجها (للانحدار)، ويتم تدريب كل شجرة على مجموعة فرعية مختلفة من البيانات والخصائص”
استعارة: “تخيل الأمر كحكمة جماعية – دمج العديد من النماذج البسيطة لإنشاء نموذج أكثر متانة”
Advertisements
5. (SVM) آلة دعم المتجهات
الهدف: تصنيف بأقصى هامش
:كيفية الشرح
تحاول آلة دعم المتجهات رسم أكبر فجوة ممكنة (هامش) بين فئتين، وتجد أفضل حد بحيث تكون أقرب نقاط لكل فئة متباعدة قدر الإمكان
نصيحة للمقابلة: “يمكنها أيضاً العمل في أبعاد أعلى باستخدام النوى – مما يساعد عندما لا تكون البيانات قابلة للفصل خطياً
6. (KNN)أقرب الجيران
الهدف: تصنيف غير دقيق يعتمد على القرب
:كيفية الشرح
نقطة بيانات إلى نقطة جديدة k إلى أقرب KNN تنظر
وتتخذ قراراً بناءً على تصنيف الأغلبية، فالأمر أشبه بقول: “لنسأل الجيران عن الفئة التي تنتمي إليها هذه النقطة
ملاحظة: لا توجد مرحلة تدريب – فهي تخزن بيانات التدريب وتحسب المسافات في وقت التنبؤ
7. Naive Bayes
الهدف: تصنيف احتمالي
:كيفية الشرح
تستخدم نظرية بايز للتنبؤ بفئة ما فبافتراض أن جميع الميزات مستقلة، هذا هو الجزء الساذج، فعلى الرغم من التبسيط إلا أنها تعمل بشكل جيد في تصنيف النصوص مثل تصفية البريد العشوائي
:حالة استخدام
نظاماً مشابهاً للكشف عن البريد العشوائي بناءً على تكرار الكلمات Gmail يستخدم
8.(LightGBMوXGBoostالتعزيز التدريجي (مثل
الهدف: تنبؤ قوي من متعلمين ضعفاء
:كيفية الشرح
يبني التعزيز التدريجي النماذج بالتتابع – كل نموذج جديد يحاول تصحيح أخطاء النموذج السابق، إنه أشبه بالتعلم من الأخطاء على مراحل
Kaggle ما يميزه: “يُستخدم غالباً في مسابقات
نظراً لدقته العالية وضبطه للأداء
K-Means٩. تجميع
الهدف: تجميع نقاط البيانات المتشابهة (بدون إشراف)
:كيفية الشرح
البيانات إلى مجموعات K-Means يُقسّم
عن طريق تقليل المسافة بين النقاط ومركز كل مجموعة
مسبقاً k ويتم تحديد عدد المجموعات
التبسيط: إنه أشبه بتصنيف العملاء في فئات مختلفة بناءً على أنماط مشترياتهم
نصيحة أخيرة: صمّم نموذجك بما يتناسب مع المقابلة
:عند شرح أي نموذج تذكر هذه الصيغة البسيطة
وظيفته *
كيفية عمله (بديهياً) *
متى تستخدمه *
مثال من الواقع *
:لنتناقش
ما هو تشبيهك أو حيلتك المفضلة عند شرح نماذج التعلم الآلي في المقابلات؟
The pandas library in Python provides powerful tools for data manipulation and analysis. Two of the most frequently used functions are pd.read_csv() for reading CSV files and pd.to_csv() for writing DataFrames to CSV files. While these functions are widely adopted due to their simplicity and efficiency, there are scenarios where alternatives might be preferable or even necessary. This article explores why one might avoid pd.read_csv() and pd.to_csv() and what alternative methods exist, categorized by different use cases.
Why Consider Alternatives?
Some common reasons include:
Performance issues with very large datasets.
Data stored in other formats (Excel, JSON, SQL, etc.).
Integration with cloud storage or databases.
Security or compliance constraints (e.g., encryption, access control).
Real-time or in-memory data that doesn’t involve files.
1. Alternatives to: pd.read_csv()
A. Reading from Other File Formats
a. Excel Files
b. JSON Files
c. Parquet Files (Optimized for large datasets)
d. HDF5 Format (Hierarchical Data Format)
e. SQL Databases
B. Reading from In-Memory Objects
a. Reading from a String (using io.StringIO)
b. Reading from a Byte Stream (e.g., in web APIs)
C. Reading from Cloud Storage
a. Google Cloud Storage (using gcsfs)
b. Amazon S3 (using s3fs)
Advertisements
2. Alternatives to: pd.to_csv()
A. Writing to Other File Formats
a. Excel
b. JSON
c. Parquet
d. HDF5
e. SQL Databases
B. Writing to In-Memory or Networked Destinations
a. Export to a String
b. Export to Bytes (for APIs or web)
c. Save to Cloud Storage (e.g., AWS S3)
3. Alternatives Outside Pandas
If avoiding pandas entirely:
A. Use Python’s Built-in csv Module
B. Use numpy for Numeric Data
Summary Table of Alternatives
Conclusion
While pd.read_csv() and pd.to_csv() are extremely versatile, a wide range of alternatives exist to suit various needs: from handling different data formats and sources, to performance optimization and cloud integrations. By understanding the context and requirements of your data workflow, you can select the most appropriate method for reading and writing data efficiently.
Introduction: Why the Top 1% Matters Now More Than Ever
In a world flooded with dashboards, KPIs, and big data buzzwords, the role of a data analyst has become both highly coveted and oversaturated. Everyone wants to be a data analyst — but only a select few break into the top 1%. These are the professionals who don’t just crunch numbers; they influence billion-dollar decisions, predict business outcomes before they happen, and lead teams toward data-driven innovation. The year 2025 is poised to be a turning point — the emergence of AI, automation, and new business expectations is rapidly shifting what it means to be “great” in this field. If you’re a data analyst or aspire to be one, the question is no longer “how do I get a job?” but rather, “how do I become irreplaceable?” That’s what this article is all about — not surviving, but standing out.
Master the Human Side of Data Before the Technical
Most aspiring analysts obsess over tools: Python, SQL, Power BI, Tableau — and sure, these are essential. But here’s an overlooked truth: the top 1% analysts understand why people need data, not just how to analyze it. They listen to stakeholders with empathy, translate fuzzy business needs into clear metrics, and speak the language of decision-makers — not just of databases. You can have the cleanest dashboards in the world, but if you can’t connect them to a business narrative or decision, your insights go unheard. In 2025, soft skills are no longer optional. Learn how to ask better questions, read between the lines of a stakeholder’s request, and communicate findings like a storyteller. Technical brilliance may get you hired, but communication excellence will make you unforgettable.
Learn Fewer Tools, but Use Them Deeper
There’s a growing myth in the analytics community: to be successful, you must learn every tool. One week it’s Power BI, the next it’s Looker Studio, then Snowflake, R, and even Rust. But the top 1% know that true mastery comes from depth, not breadth. They pick a few core tools — like SQL, Python, and Power BI — and explore them beyond surface tutorials. They learn how to write efficient queries, automate repetitive tasks, and build end-to-end reporting pipelines. They dive into advanced DAX in Power BI or build predictive models using Python’s scikit-learn. In 2025, companies want analysts who don’t just follow a tutorial — they want those who can build internal frameworks, optimize performance, and create scalable solutions. Focus your time on becoming irreplaceable in your core tools, and the rest will follow.
Think Like a Product Manager, Not Just an Analyst
This might be the biggest mindset shift you need to make: stop seeing yourself as a report generator, and start thinking like a product manager. Top 1% analysts treat every dashboard like a product — they consider the user experience, track engagement, and iterate based on feedback. They don’t just deliver a report and disappear; they build tools that evolve with the business. In 2025, data analysts who can design self-serve experiences, reduce decision latency, and champion data adoption will be in a league of their own. Ask yourself: how can I turn my dashboard into a product that people want to use every day? How can I measure its impact? This product mindset makes you more valuable than any line of code you write.
Advertisements
Build a Personal Brand That Speaks Before You Do
Here’s a secret the top 1% know: your influence doesn’t begin in meetings or interviews — it starts online. Building a personal brand as a data analyst in 2025 is not about bragging, it’s about sharing. Whether it’s on LinkedIn, Medium, or YouTube, the most respected analysts share real insights, mini case studies, tutorials, or even failures they’ve learned from. When you show your process publicly, people trust your skill before they meet you. You attract opportunities, build credibility, and join a global community. The top analysts of today didn’t wait for a company to validate them — they published their learning journey, shared dashboards, and collaborated openly. If you want to rise to the top, don’t just level up in silence. Document your wins, your experiments, and your perspectives. The spotlight won’t find you unless you’re visible.
Stay Ahead by Understanding the Future of Data Work
2025 is not just about better dashboards. It’s about knowing what’s coming — and preparing for it. The top analysts are already exploring how AI copilots will change data analysis, how real-time data streaming will impact decision-making, and how data governance and ethics will play a central role in business trust. They understand that automation will replace repetitive tasks — but not the analysts who think critically, explain patterns, and lead with context. To stay ahead, you must continuously ask: what’s next? Subscribe to trends, explore new tools with curiosity, and always keep one eye on the horizon. Being among the top 1% means thinking beyond today’s problem and anticipating tomorrow’s possibilities.
Conclusion: Let’s Talk — What’s Holding You Back?
The journey to the top 1% is not linear, and it certainly isn’t easy. It’s a combination of technical depth, business empathy, communication, and forward-thinking. But here’s the good news — the path is open to anyone who chooses to walk it with discipline and curiosity. Now, I want to hear from you: What do you think separates average data analysts from the great ones? What’s the one area you’re focusing on in 2025 to rise above the noise? Let’s open the floor — comment below, share your thoughts, and let’s grow together.
Advertisements
إتقان تحليلات البيانات: طريقك إلى القمة في عام ٢٠٢٥
Advertisements
مقدمة: لماذا يُعدّ الـ 1% من محللي البيانات الأوائل أكثر أهمية الآن من أي وقت مضى؟
في عالمٍ يعجّ بلوحات المعلومات ومؤشرات الأداء الرئيسية ومصطلحات البيانات الضخمة أصبح دور محلل البيانات مطلوباً بشدة ومُشبعاً، إذ يطمح الجميع إلى أن يصبح محلل بيانات لكن قلة قليلة فقط هي من تصل إلى هذه المكانة، فهؤلاء هم المحترفون الذين لا يكتفون بتحليل الأرقام فحسب؛ بل يؤثرون في قراراتٍ بمليارات الدولارات ويتوقعون نتائج الأعمال قبل حدوثها ويقودون فرق العمل نحو الابتكار القائم على البيانات، وعليه فمن المتوقع أن يكون عام 2025 نقطة تحول فظهور الذكاء الاصطناعي والأتمتة وتوقعات الأعمال الجديدة يُغيّر بسرعة مفهوم “التميز” في هذا المجال، لذا فإذا كنت محلل بيانات أو تطمح إلى أن تكون كذلك فإن السؤال لم يعد ( كيف أحصل على وظيفة؟ ) بل “كيف أصبح محلل لا يُعوّض؟” هذا هو محور هذه المقالة – ليس مجرد البقاء بل التميز
أتقن الجانب الإنساني للبيانات قبل الجانب التقني
يُهوى معظم المحللين الطموحين بأدوات مثل بايثون
SQL، Power BI، Tableau
وهي أدوات أساسية بلا شك، لكن إليك حقيقة مُغفلة هي أن أفضل 1% من المحللين يفهمون سبب حاجة الناس للبيانات وليس فقط كيفية تحليلها، إذ أنهم يستمعون إلى أصحاب المصلحة بتعاطف ويترجمون احتياجات العمل الغامضة إلى مقاييس واضحة ويتحدثون بلغة صانعي القرار – وليس فقط لغة قواعد البيانات، وقد تمتلك أدق لوحات معلومات في العالم ولكن إذا لم تتمكن من ربطها بسردية عمل أو قرار فلن تُسمع رؤاك، وفي وقتنا الراهن لم تعد المهارات الشخصية اختيارية، لذا تعلم كيفية طرح أسئلة أفضل وقراءة ما بين سطور طلب صاحب المصلحة وتوصيل النتائج كقاصّ محترف، بحيث قد تُؤهلك البراعة التقنية للتوظيف لكن التميز في التواصل سيجعلك استثنائياً
تعلم أدوات أقل لكن استخدمها بشكل أعمق
هناك خرافة متنامية في مجتمع التحليلات تقول: لكي تنجح يجب أن تتعلم كل أداة
Power BI فأسبوع يُركزون على
Looker Studio ثم أسبوعٌ آخر على
Snowflake، و R ثم
Rust وحتى
لكنّ أفضل 1% من الخبراء يدركون أنّ الإتقان الحقيقي يكمن في العمق لا في الاتساع، فيختارون بعض الأدوات الأساسية
SQL و Python و Power BI مثل
ويستكشفونها بما يتجاوز الدروس التعليمية السطحية، فيتعلمون كيفية كتابة استعلامات فعّالة وأتمتة المهام المتكررة وبناء مسارات تقارير شاملة
Power BI المتقدم في DAX ويتعمقون في
أو يبنون نماذج تنبؤية باستخدام
Python من scikit-learn
في عام 2025 تريد الشركات محللين لا يتبعون دروساً تعليمية فحسب – بل يريدون من يستطيعون بناء أطر عمل داخلية وتحسين الأداء وابتكار حلول قابلة للتطوير، لذا ركّز وقتك على أن تصبح لا غنى عنك في أدواتك الأساسية وسيأتي الباقي تباعاً
Advertisements
فكّر كمدير منتج لا كمحلل فحسب
قد يكون هذا هو أكبر تغيير في عقليتك تحتاج إليه، لذا توقّف عن رؤية نفسك كمُنشئ تقارير وابدأ بالتفكير كمدير منتج، إذ يتعامل أفضل 1% من المحللين مع كل لوحة معلومات كمنتج فهم يراعون تجربة المستخدم ويتتبعون التفاعل ويكررون العمل بناءً على الملاحظات، فهم لا يقدمون تقريراً ويختفون فحسب؛ بل يبنون أدوات تتطور مع تطور العمل، لذا في وقتنا الحالي وفي المستقبل القريب سيحتل محللو البيانات القادرون على تصميم تجارب الخدمة الذاتية وتقليل زمن اتخاذ القرار ودعم تبني البيانات مكانة مرموقة، لذا اسأل نفسك: كيف يمكنني تحويل لوحة معلوماتي إلى منتج يرغب الناس في استخدامه يومياً؟ كيف يمكنني قياس تأثيره؟ هذه العقلية المنتجة تجعلك أكثر قيمة من أي سطر برمجي تكتبه
ابنِ علامة تجارية شخصية تتحدث قبل أن تتحدث
إليك سراً يعرفه أفضل 1% يقول: تأثيرك لا يبدأ في الاجتماعات أو المقابلات بل يبدأ عبر الإنترنت، فبناء علامة تجارية شخصية كمحلل بيانات في عام 2025 لا يتعلق بالتفاخر بل بالمشاركة
LinkedIn أو Medium أو YouTube فسواء كان ذلك على
يشارك المحللون الأكثر احتراماً رؤى حقيقية ودراسات حالة مختصرة ودروساً تعليمية أو حتى تجارب فاشلة تعلموا منها، فعندما تُظهر عمليتك إلى العلن يثق الناس بمهاراتك قبل أن يلتقوا بك، فأنت تجذب الفرص وتبني المصداقية وتنضم إلى مجتمع عالمي، واعلم جيداً أن كبار المحللين لم ينتظروا يوماً شركةً لتثبت جدارتهم، بل نشروا رحلة تعلمهم وشاركوا لوحات المعلومات وتعاونوا بانفتاح، لذا إن كنت راغباً في الارتقاء إلى القمة فلا تكتفِ بالارتقاء في صمت، وثّق نجاحاتك وتجاربك ووجهات نظرك، لن تجدك الأضواء إلا إذا كنت مرئياً
ابقَ في الطليعة بفهم مستقبل أعمال البيانات
لا يقتصر عام 2025 على تحسين لوحات المعلومات بل يتعلق بمعرفة ما هو آتٍ والاستعداد له، إذ يستكشف كبار المحللين بالفعل كيف سيُغير مساعدو الذكاء الاصطناعي تحليل البيانات وكيف سيؤثر تدفق البيانات في الوقت الفعلي على عملية صنع القرار وكيف ستلعب حوكمة البيانات وأخلاقياتها دوراً محورياً في ثقة الأعمال، إذ أنهم يدركون أن الأتمتة ستحل محل المهام المتكررة ولكن ليس المحللين الذين يفكرون بشكل نقدي ويشرحون الأنماط ويقودون وفقاً للسياق، وعليك أن تدرك أن البقاء في الطليعة يقتضي أن تسأل باستمرار: ما التالي؟ لذا تابع أحدث التوجهات واستكشف الأدوات الجديدة بفضول وراقب الأفق دائماً، فأن تكون ضمن أفضل 1% يعني التفكير فيما يتجاوز مشكلة اليوم وتوقع إمكانيات الغد
الخلاصة: دعونا نتحدث – ما الذي يعيقك؟
الرحلة إلى أفضل 1% ليست خطية وهي بالتأكيد ليست سهلة، إنها مزيج من العمق التقني والتعاطف مع بيئة العمل والتواصل والتفكير المستقبلي، لكن إليكم الخبر السار: الطريق مفتوح لكل من يختار خوضه بانضباط وفضول، الآن أود أن أسمع منكم: ما الذي يميز محللي البيانات العاديين عن المحللين المتميزين برأيكم؟ ما هو المجال الذي تركزون عليه في عام ٢٠٢٥ للارتقاء فوق مستوى التوقعات؟ دعونا نفتح باب النقاش – علّقوا أدناه وشاركوا أفكاركم ولننمو معاً
Artificial Intelligence has often been painted as a grand, futuristic technology meant only for tech giants and programmers. But in today’s world, AI is quietly slipping into the hands of everyday people, transforming from an intimidating mystery into a powerful ally. The remarkable thing is, you don’t have to abandon your career, take massive risks, or spend years retraining to make the most of it. AI is not about replacing your job—it’s about supplementing your life. It’s about creating opportunities, building passive income streams, and sharpening your skills in ways that fit seamlessly into your existing schedule. Whether you work full-time as a teacher, marketer, nurse, or engineer, there’s a place for AI in your daily routine that could very well change your financial landscape.
Small Steps, Big Gains: Finding Your Unique AI Path
The beauty of today’s AI revolution lies in its versatility. You don’t need to become a software developer to participate. Many people start small, exploring AI tools that match their personal interests or professional skills. Writers are using AI to speed up content creation and sell e-books. Graphic designers are leveraging AI-generated art platforms to create and sell digital prints or design templates online. Even social media managers and side hustlers are tapping into AI-driven marketing tools to manage campaigns, freeing up more time while increasing their income. The key is finding what feels natural to you—something that doesn’t feel like a second full-time job but instead feels like an exciting extension of your talents. AI isn’t here to change what you love; it’s here to supercharge how you express and monetize it.
Advertisements
Learning and Earning Simultaneously: The Low-Risk Advantage
One of the biggest fears people have when it comes to starting something new is the fear of losing what they already have. Traditional side businesses often require large upfront investments of time and money, not to mention a leap of faith into uncertainty. AI side hustles are different. Many powerful AI tools are either free or have very low-cost options, allowing you to experiment without risking your financial security. You can learn as you go, often using your evenings or weekends to test new ideas, build a product, or offer a service enhanced by AI. Platforms like ChatGPT, Canva AI, Midjourney, Jasper, and countless others make it easy for beginners to get started without a steep learning curve. Every small success builds not just income, but confidence, and before you know it, your AI side venture can grow into something substantial—all while you continue succeeding in your main career.
Future-Proofing Your Skills: Why Starting Now Matters
There’s another layer to this story that is even more critical: the skills you develop by experimenting with AI today will become the professional superpowers of tomorrow. Businesses are increasingly seeking employees who are AI-literate, and those who can demonstrate practical experience with these tools will stand out in any field. By engaging with AI now, you’re not just making extra money—you’re investing in your future employability and career growth. Imagine being the person in your company who can automate tedious reports, create smart marketing strategies, or produce creative materials faster and better. These skills make you indispensable, and they open doors to promotions, leadership opportunities, and even more entrepreneurial ventures down the line.
Conclusion: A New Era of Possibility
The idea that you have to choose between the security of your job and the thrill of entrepreneurship is outdated. Thanks to AI, you can do both. You can make money, expand your skills, and even discover passions you didn’t know you had—all without giving up the stability you’ve worked so hard to build. The AI era is not just for the tech-savvy; it’s for anyone willing to explore, experiment, and embrace change. The sooner you start weaving AI into your life, the sooner you’ll realize that the future isn’t just coming—it’s already here, and it’s full of possibility.
Advertisements
كيف يمكنك أن تكسب دخلاً إضافياً باستخدام الذكاء الاصطناعي دون أن تتخلى عن وظيفتك؟
Advertisements
لطالما وُصف الذكاء الاصطناعي بأنه تقنية مستقبلية عظيمة مخصصة فقط لعمالقة التكنولوجيا والمبرمجين، لكن في عالمنا اليوم يتسلل الذكاء الاصطناعي بهدوء إلى أيدي الناس العاديين متحولاً من لغزٍ مُخيف إلى حليفٍ قوي واللافت للنظر أنك لست مضطراً للتخلي عن مسيرتك المهنية أو المخاطرة بمخاطر جسيمة أو قضاء سنوات في إعادة التدريب لتحقيق أقصى استفادة منها، ومن هذا المنطلق يمكننا القول أن الذكاء الاصطناعي لا يهدف إلى استبدال وظيفتك بل إلى إثراء حياتك، إذ أنه يهدف إلى خلق الفرص وبناء مصادر دخل سلبية وصقل مهاراتك بطرقٍ تتناسب بسلاسة مع جدولك الزمني الحالي، فسواء كنت تعمل بدوام كامل كمدرس أو مسوق أو ممرض أو مهندس فهناك مكانٌ للذكاء الاصطناعي في روتينك اليومي وقد يُغير وضعك المالي بشكل كبير
خطوات صغيرة ومكاسب كبيرة: ابحث عن مسارك الفريد في الذكاء الاصطناعي
يكمن جمال ثورة الذكاء الاصطناعي اليوم في تنوعها فلستَ بحاجة إلى أن تصبح مطور برامج للمشاركة، بحيث يبدأ الكثيرون مشاريع صغيرة مستكشفين أدوات الذكاء الاصطناعي التي تتوافق مع اهتماماتهم الشخصية أو مهاراتهم المهنية، فيستخدم الكُتّاب الذكاء الاصطناعي لتسريع إنشاء المحتوى وبيع الكتب الإلكترونية ويستفيد مصممو الجرافيك من منصات الفنون المُولّدة بالذكاء الاصطناعي لإنشاء وبيع المطبوعات الرقمية أو قوالب التصميم عبر الإنترنت، حتى مديرو وسائل التواصل الاجتماعي وأصحاب المشاريع الجانبية يستغلون أدوات التسويق المُدارة بالذكاء الاصطناعي لإدارة الحملات مما يُتيح لهم المزيد من الوقت ويزيد دخلهم، يكمن السر في إيجاد ما يبدو طبيعياً بالنسبة لك – شيء لا يبدو وكأنه وظيفة ثانية بدوام كامل، بل يبدو امتداداً مثيراً لمواهبك، فالذكاء الاصطناعي ليس هنا لتغيير ما تحب بل هو هنا لتعزيز طريقة التعبير عنه وتحقيق الدخل منه
التعلم والكسب في آنٍ واحد: ميزة منخفضة المخاطر
من أكبر مخاوف الناس عند بدء مشروع جديد هو الخوف من فقدان ما لديهم بالفعل، فغالباً ما تتطلب المشاريع الجانبية التقليدية استثمارات أولية كبيرة من الوقت والمال، ناهيك عن المخاطرة بالثقة وعدم اليقين، أما المشاريع الجانبية القائمة على الذكاء الاصطناعي فهي مختلفة، فالعديد من أدوات الذكاء الاصطناعي القوية إما مجانية أو بخيارات منخفضة التكلفة مما يتيح لك التجربة دون المخاطرة بأمنك المالي، وعليه يمكنك التعلم أثناء العمل وغالباً ما تستغل أمسياتك أو عطلات نهاية الأسبوع لاختبار أفكار جديدة أو بناء منتج أو تقديم خدمة مُحسّنة بالذكاء الاصطناعي
Advertisements
تُسهّل منصات مثل
وغيرها الكثير Midjourney و Jasper و Canva AI و ChatGPT
على المبتدئين البدء دون عناء التعلم، فكل نجاح صغير لا يبني دخلاً فحسب بل ثقةً أيضاً وسرعان ما يتطور مشروعك الجانبي في مجال الذكاء الاصطناعي إلى شيء كبير – كل ذلك مع استمرارك في النجاح في مسيرتك المهنية الرئيسية
استعد للمستقبل بمهاراتك: أهمية البدء الآن
هناك جانب آخر لهذه القصة أكثر أهمية: المهارات التي تكتسبها من خلال تجربة الذكاء الاصطناعي اليوم ستصبح القوى العظمى المهنية في المستقبل، إذ تبحث الشركات بشكل متزايد عن موظفين مُلِمّين بالذكاء الاصطناعي وأولئك الذين يُمكنهم إثبات خبرة عملية في هذه الأدوات سيبرزون في أي مجال، فمن خلال التفاعل مع الذكاء الاصطناعي الآن فأنت لا تجني أموالاً إضافية فحسب بل تستثمر في فرص توظيفك المستقبلية ونموك المهني، تخيّل نفسك الشخص الذي يستطيع في شركتك أتمتة التقارير المُرهقة ووضع استراتيجيات تسويق ذكية أو إنتاج مواد إبداعية بشكل أسرع وأفضل، هذه المهارات تجعلك لا غنى عنك وتفتح لك أبواباً للترقيات وفرص القيادة وحتى المزيد من المشاريع الريادية في المستقبل
الخلاصة: عصر جديد من الإمكانيات
إن فكرة الاختيار بين أمان وظيفتك وإثارة ريادة الأعمال أصبحت قديمة، فبفضل الذكاء الاصطناعي يمكنك تحقيق كليهما، يمكنك كسب المال وتنمية مهاراتك وحتى اكتشاف شغف لم تكن تعلم بوجوده – كل ذلك دون التخلي عن الاستقرار الذي عملت بجد لبنائه، وتذكر دائماً أن عصر الذكاء الاصطناعي ليس حكراً على خبراء التكنولوجيا بل هو لكل من يرغب في الاستكشاف والتجربة واحتضان التغيير، فكلما أسرعت في دمج الذكاء الاصطناعي في حياتك كلما أدركت أن المستقبل ليس آتياً فجأة – إنه هنا بالفعل وهو مليء بالإمكانيات
In a world flooded with data, how we interpret and communicate that data has never been more crucial. Data visualization has emerged as a vital bridge between raw information and actionable insights. But there’s an ongoing conversation among practitioners and enthusiasts: is data visualization more of an art or a science?
The answer isn’t straightforward—because data visualization is beautifully both.
What is Data Visualization?
At its core, data visualization is the graphical representation of information and data. Using elements like charts, graphs, maps, and infographics, it allows us to understand trends, patterns, and outliers in complex datasets.
Well-designed visualizations make data accessible. They allow businesses to make strategic decisions, researchers to share findings, and the general public to grasp information quickly and intuitively.
The Scientific Side: Data Visualization as Science
Those who see data visualization as a science focus on precision, structure, and integrity. In this camp, visualization is about:
Accuracy: Representing data truthfully without distortion.
Cognitive Load Reduction: Using design to aid, not hinder, comprehension.
Standardization: Leveraging best practices, such as Edward Tufte’s principles or the use of proven chart types like bar graphs and scatter plots.
In this approach, visualization is about function. The scientist values clean lines, logical hierarchies, and clarity. A line chart that helps a policymaker spot a declining trend in public health data is a successful outcome—no need for bells and whistles.
Advertisements
The Artistic Side: Data Visualization as Art
Then there are those who view data visualization as an art form—an opportunity to communicate information in an evocative and emotional way. For these creators, the visualization isn’t just about clarity but about:
Creativity: Breaking free from rigid templates to design unique visual experiences.
Emotion: Making the audience feel something about the data, not just understand it.
Storytelling: Weaving narratives that guide viewers through the data.
Aesthetics: Using color theory, composition, typography, and style to create beauty.
Artists might design visualizations that resemble abstract paintings or interactive experiences that invite exploration. These visuals often push the boundaries of what charts can do, combining artistic intuition with data integrity.
Where Art and Science Meet
The most effective data visualizations often live at the intersection of art and science. They:
Balance beauty with function
Tell a story without distorting truth
Evoke curiosity while remaining grounded in facts
For instance, Florence Nightingale’s 19th-century rose diagram wasn’t just a statistical tool; it was a persuasive visual statement that changed public health policy. Similarly, modern visual storytellers like Giorgia Lupi combine data, illustration, and emotion to create deeply human experiences.
Why Data Visualization Matters Today
In the age of big data, the ability to extract meaning from complexity is power. Data visualization allows us to:
Detect patterns hidden in thousands of rows
Make decisions faster with clear dashboards
Communicate results across teams and stakeholders
Educate and inform the public in impactful ways
Whether you’re a business analyst, journalist, policymaker, or designer, understanding how to visualize data is an essential skill.
Tools of the Trade
Today, numerous tools cater to both the artistic and scientific mind:
Scientific/Structured Tools: Tableau, Power BI, Excel, R, Python (Matplotlib, Seaborn)
Artistic/Customizable Tools: D3.js, Processing, Adobe Illustrator (for static visuals), and even Figma
These tools offer different levels of flexibility, interactivity, and creative control.
Conclusion: The Harmony of Art and Science
To see data visualization solely as a science is to risk losing its emotional impact. To view it only as an art form is to risk clarity and truth. But when you treat it as both—a discipline that respects data while embracing creativity—you unlock its full potential.
Data visualization is an art grounded in science. And in the hands of a skilled practitioner, it becomes a powerful language—a way of speaking the truth with beauty.
Do you agree with me that art and science complement each other in data visualization? Or do you favor one option over the other? Share your opinion with us in the comments.
Advertisements
فن تصور البيانات: حيث يلتقي الإبداع بالوضوح
Advertisements
في عالمٍ غارقٍ بالبيانات لم تكن كيفية تفسيرنا لتلك البيانات وتوصيلها أكثر أهميةً من أي وقتٍ مضى، وقد برز تصور البيانات كجسرٍ حيويٍّ بين المعلومات الخام والرؤى العملية ولكن هناك نقاشٌ مستمرٌّ بين الممارسين والمتحمسين: هل تصور البيانات فنٌّ أم علمٌ؟
الإجابة ليست واضحةً لأن تصور البيانات يجمع بينهما بشكلٍ رائع
ما هو تصور البيانات؟
في جوهره تصور البيانات هو التمثيل البياني للمعلومات والبيانات وباستخدام عناصر مثل المخططات البيانية والخرائط والرسوم البيانية يُتيح لنا فهم الاتجاهات والأنماط والقيم الشاذة في مجموعات البيانات المعقدة
التصورات المُصمَّمة جيداً تجعل البيانات في متناول الجميع، فهي تُتيح للشركات اتخاذ قراراتٍ استراتيجية وللباحثين مشاركة النتائج وللجمهور العام فهم المعلومات بسرعةٍ وبديهة
الجانب العلمي: تصور البيانات كعلم
يُركِّز أولئك الذين يعتبرون تصور البيانات علماً على الدقة والهيكلية والنزاهة، وفي هذا السياق يتمحور التصور حول
• الدقة: تمثيل البيانات بصدق ودون تحريف
• الصلاحيةالإحصائية: ضمان أن تعكس التصورات العلاقات الرياضية الصحيحة
• تخفيف العبء المعرفي: استخدام التصميم لتعزيز الفهم لا لإعاقته
• التوحيد القياسي: الاستفادة من أفضل الممارسات مثل مبادئ إدوارد توفته أو استخدام أنواع الرسوم البيانية المجربة مثل الرسوم البيانية الشريطية ومخططات التشتت
في هذا النهج يتمحور التصور حول الوظيفة، إذ يُقدّر العالم الخطوط الواضحة والتسلسلات الهرمية المنطقية والوضوح، ويُعدّ الرسم البياني الخطي الذي يساعد صانع السياسات على رصد اتجاه انحداري في بيانات الصحة العامة نتيجة ناجحة – دون الحاجة إلى أي إضافات أو إضافات
الجانب الفني: تصور البيانات كفن
ثم هناك من ينظرون إلى تصور البيانات كشكل فني أي فرصة لتوصيل المعلومات بطريقة مثيرة للعواطف، فبالنسبة لهؤلاء المبدعين لا يقتصر التصور على الوضوح فحسب بل يشمل أيضاً
• الإبداع: التحرر من القوالب الجامدة لتصميم تجارب بصرية فريدة
• التأثير العاطفي: جعل الجمهور يشعر بشيء ما تجاه البيانات وليس مجرد فهمها
• سرد القصص: نسج سرديات تُرشد المشاهدين عبر البيانات
• الجماليات: استخدام نظرية الألوان والتركيب والطباعة والأسلوب لخلق الجمال
• قد يصمم الفنانون تصورات تُشبه اللوحات التجريدية أو التجارب التفاعلية التي تدعو إلى الاستكشاف، فغالباً ما تتجاوز هذه المرئيات حدود ما يمكن أن تقدمه المخططات البيانية جامعةً بين الحدس الفني وسلامة البيانات
Advertisements
حيث يلتقي الفن والعلم
:غالباً ما تكمن أكثر تصورات البيانات فعالية في تقاطع الفن والعلم، فهي
• توازن بين الجمال والوظيفة
• تروي قصة دون تشويه الحقيقة
• تثير الفضول مع الحفاظ على الأسس المنطقية
على سبيل المثال لم يكن مخطط الوردة الذي صممته فلورنس نايتنجيل في القرن التاسع عشر مجرد أداة إحصائية، بل كان بياناً بصرياً مقنعاً غيّر سياسة الصحة العامة ، وبالمثل يجمع رواة القصص البصرية المعاصرون مثل جورجيا لوبي بين البيانات والرسوم التوضيحية والعاطفة لخلق تجارب إنسانية عميقة
لماذا يُعدّ تصور البيانات مهماً اليوم؟
في عصر البيانات الضخمة تُعدّ القدرة على استخلاص المعنى من التعقيد قوةً حقيقية يُتيح لنا تصور البيانات ما يلي:
• اكتشاف الأنماط المخفية في آلاف الصفوف
• اتخاذ القرارات بشكل أسرع باستخدام لوحات معلومات واضحة
• إيصال النتائج إلى الفرق وأصحاب المصلحة
• تثقيف الجمهور وإعلامه بطرق مؤثرة سواء كنت محلل أعمال أو صحفياً أو صانع سياسات أو مصمماً فإن فهم كيفية تصور البيانات مهارة أساسية
أدوات العمل
:تلبي العديد من الأدوات اليوم احتياجات كل من العقل الفني والعلمي
: أدوات علمية/مهيكلة *
Tableau، Power BI، Excel، R، Python (Matplotlib، Seaborn)
إن النظر إلى تصوير البيانات كعلمٍ فقط يُخاطر بفقدان تأثيره العاطفي، وإن النظر إليه كشكلٍ فنيٍّ فقط يُخاطر بالوضوح والحقيقة، ولكن عندما تتعامل معه على أنهما معاً – أي تخصصٍ يحترم البيانات ويحتضن الإبداع – فإنك تُطلق العنان لكامل إمكاناته
تصوير البيانات فنٌّ قائمٌ على العلم، وعلى يد مُمارسٍ ماهر، يُصبح لغةً قويةً – وسيلةً للتعبير عن الحقيقة بجمال
هل تتفق معي بحقيقة التكامل بين الفن والعلم في تصور البيانات ؟ أم أنك ترجح إحدى الكفتين على الأخرى شاركنا رأيك في التعليقات
In today’s data-driven world, businesses thrive on the ability to make informed decisions backed by solid analytics. Power BI, Microsoft’s interactive data visualization and business intelligence tool, has revolutionized the way professionals present and analyze information. But the craft of Power BI reporting goes far beyond simply dragging charts onto a canvas—it is a strategic skill that blends user-centered design, data architecture, and storytelling to create meaningful insights.
Whether you’re a beginner or seasoned analyst, mastering the reporting lifecycle in Power BI enables you to turn raw data into actionable narratives. This guide explores the key stages, tools, and mindsets needed to deliver compelling Power BI reports from start to finish.
1. Start with the User’s Needs and Context
Effective Power BI reporting starts not with data—but with people. Understanding who the users are, what decisions they need to make, and how they interpret data lays the foundation for every design choice to follow.
This means engaging stakeholders early, asking the right questions:
What are their roles and responsibilities?
What key metrics or KPIs matter most to them?
How often will they use the report, and on what devices?
By empathizing with your audience, you begin shaping a solution that fits seamlessly into their workflow. Use user personas and scenario mapping to visualize needs and define success. This user-centered mindset prevents the all-too-common pitfall of creating reports that look great—but go unused.
2. Evaluate If Power BI Is the Right Fit
Before jumping into development, evaluate if Power BI is the best-fit platform for your objectives. It excels in specific use cases: interactive dashboards, real-time monitoring, and integrated analysis of multiple data sources. But for static print-style reporting or large-scale financial statements, other tools might be better suited.
Assess the technical environment as well:
Do you have access to reliable data sources (SQL, Excel, SharePoint, etc.)?
Is your organization equipped with Power BI Pro or Premium licenses?
Can Power BI connect securely to cloud or on-premises systems?
This is the stage for feasibility checks, data source exploration, and basic proof-of-concept mockups. By confirming Power BI’s viability early, you save time and align stakeholder expectations realistically.
3. Design an Effective Data and Layout Framework
Information architecture (IA) defines how data is structured and how users navigate it. In Power BI, this means designing datasets, data models, and page layouts that support clarity and coherence.
Start by identifying the report’s data domains—sales, inventory, customer feedback, etc.—and how they relate. Normalize tables, set up relationships, and remove redundancy. Use star schema modeling for optimal performance and usability.
Then outline your report’s navigation structure. Will it be a single page with filters or a multi-page report with tabs? Use intuitive naming conventions and group visuals logically to guide users through a data-driven story.
The goal: eliminate confusion, reduce cognitive load, and make every click feel natural.
4. Create a Preliminary Layout Plan
Think of this step as wireframing for data. Using simple tools—pen and paper, PowerPoint, or low-fidelity mockup software—roughly sketch the layout of your report.
Decide:
Where filters will be placed
How many visuals per page
What types of visuals (bar charts, cards, tables)
Placement of KPIs, slicers, tooltips, etc.
This phase is fast, disposable, and iterative. Share your sketches with stakeholders to validate your assumptions. Early feedback at this stage prevents costly redesigns later.
Low-fidelity mockups emphasize structure, not aesthetics. Focus on hierarchy, flow, and storytelling—not colors or font sizes just yet.
Advertisements
5. Develop a Detailed Interactive Prototype
With structure in place, now refine the visual experience. This high-fidelity phase brings your sketch to life using real or sample data inside Power BI Desktop.
Fine-tune:
Chart types and formatting
Colors and themes (use corporate branding)
Spacing, alignment, and consistency
Interactive elements like bookmarks, buttons, and drill-throughs
Accessibility also becomes key—use sufficient contrast, label charts clearly, and enable keyboard navigation where needed. Apply DAX measures for calculated KPIs and test slicer interactions.
This prototype functions like a real report. Share it widely for usability testing and stakeholder review. Encourage feedback to catch blind spots and fine-tune content relevance.
6. Build and Deploy the Final Report
Once the prototype is approved, it’s time to finalize your build. This phase includes:
Connecting to live data sources
Automating data refresh schedules
Testing performance (load time, filter responsiveness)
Setting up row-level security (RLS) if needed
Publishing the report to Power BI Service
You’ll also configure dashboards, alerts, and app workspaces to ensure proper sharing and collaboration. Be sure to document the logic behind your DAX calculations, report structure, and user instructions.
A polished Power BI report should be fast, responsive, and self-explanatory—reducing the need for handholding.
7. Maintain, Monitor, and Improve Continuously
Your job doesn’t end with delivery. Great Power BI reports evolve with user needs and business changes. Implement a stewardship model to ensure ongoing value.
This includes:
Monitoring usage metrics to track engagement
Gathering periodic feedback for improvements
Updating visuals or logic as KPIs evolve
Performing regular data quality checks
Managing access and security over time
Also, create version control mechanisms for tracking report changes. Educate users on new features (e.g., Q&A, new filters) through internal documentation or mini training sessions.
Report stewardship transforms Power BI from a one-time project into a sustainable business asset.
Conclusion
The skill of Power BI reporting is a blend of analysis, design, architecture, and empathy. It’s not just about charts—it’s about communicating meaning.
By following a thoughtful, user-centered process—from understanding needs and validating structure to refining visuals and managing reports over time—you create data experiences that drive action and insight.
Power BI isn’t just a tool. In skilled hands, it becomes a canvas for organizational intelligence.
Advertisements
Power BIمهارة إعداد التقارير باستخدام
Advertisements
مقدمة
في عالمنا اليوم الذي يعتمد على البيانات تزدهر الشركات بفضل قدرتها على اتخاذ قرارات مدروسة مدعومة بتحليلات فعّالة
أداة مايكروسوفت التفاعلية Power BI وقد أحدث
لتصور البيانات وذكاء الأعمال ثورة في طريقة عرض وتحليل المعلومات من قِبل المحترفين
Power BI إلا أن براعة إعداد التقارير باستخدام
تتجاوز مجرد رسم المخططات البيانية على لوحة الرسم بل هي مهارة استراتيجية تجمع بين التصميم المُركّز على المستخدم وهندسة البيانات وسرد القصص لخلق رؤى قيّمة
سواء كنت محللاً مبتدئاً أو خبيراً فإن إتقان دورة حياة إعداد التقارير باستخدام هذه الأداة يُمكّنك من تحويل البيانات الخام إلى سرديات عملية يستكشف هذا الدليل المراحل الرئيسية والأدوات والعقليات
فعّالة من البداية إلى النهاية Power BI اللازمة لتقديم تقارير
1. ابدأ باحتياجات المستخدم وسياقه
الفعّالة بالبيانات بل بالأشخاص Power BI لا تبدأ تقارير
إذ أن فهم هوية المستخدمين والقرارات التي يتعين عليهم اتخاذها وكيفية تفسيرهم للبيانات يُشكّل الأساس لكل خيار تصميمي يجب اتباعه
هذا يعني إشراك أصحاب المصلحة مبكراً وطرح الأسئلة الصحيحة:
ما هي أدوارهم ومسؤولياتهم؟ *
ما هي المقاييس الرئيسية أو مؤشرات الأداء الرئيسية الأكثر أهمية بالنسبة لهم؟ *
ما مدى تكرار استخدامهم للتقرير وعلى أي أجهزة؟ *
من خلال التعاطف مع جمهورك تبدأ بصياغة حل ينسجم بسلاسة مع سير عملهم، لذا استخدم شخصيات المستخدم وتخطيط السيناريوهات لتصور الاحتياجات وتحديد النجاح، هذه العقلية التي تركز على المستخدم تمنع الوقوع في فخ إنشاء تقارير تبدو رائعة ولكنها لا تُستخدم
2. هو الخيار الأمثلPower BIتقييم ما إذا كان
Power BI قبل البدء في التطوير قيّم ما إذا كان
هو المنصة الأنسب لأهدافك، فهو يتفوق في حالات استخدام محددة: لوحات معلومات تفاعلية ومراقبة آنية وتحليل متكامل لمصادر بيانات متعددة، ولكن بالنسبة للتقارير المطبوعة الثابتة أو البيانات المالية واسعة النطاق قد تكون أدوات أخرى أكثر ملاءمة، وعليه قيّم البيئة التقنية أيضاً
هل لديك إمكانية الوصول إلى مصادر بيانات موثوقة *
؟(SQL، Excel، SharePoint، إلخ)
؟ Premium أو Power BI Pro هل مؤسستك مجهزة بتراخيص *
الاتصال بشكل آمن بالأنظمة السحابية أو المحلية؟ Power BI هل يمكن لـ *
هذه هي مرحلة التحقق من الجدوى واستكشاف مصادر البيانات ونماذج إثبات المفهوم الأساسية
Power BI فمن خلال التأكد مبكراً من جدوى
يمكنك توفير الوقت ومواءمة توقعات أصحاب المصلحة بشكل واقعي
3. تصميم إطار عمل فعال للبيانات والتخطيط
كيفية هيكلة البيانات (IA) بنية تحدد المعلومات
وكيفية تصفح المستخدمين لها
يعني هذا تصميم مجموعات البيانات Power BI ففي
ونماذج البيانات وتخطيطات الصفحات التي تدعم الوضوح والاتساق
ابدأ بتحديد مجالات بيانات التقرير – المبيعات والمخزون وملاحظات العملاء .. إلخ – وكيفية ارتباطها وحدِّد الجداول وأنشئ العلاقات وأزل التكرار، واستخدم نمذجة مخططات النجوم لتحقيق الأداء الأمثل وسهولة الاستخدام
ثم حدد هيكل التنقل في تقريرك، هل سيكون صفحة واحدة مع فلاتر أم تقريراً متعدد الصفحات مع علامات تبويب؟ استخدم اصطلاحات تسمية بديهية وجمع العناصر المرئية بشكل منطقي لتوجيه المستخدمين خلال قصة مبنية على البيانات
الهدف: إزالة الالتباس وتقليل العبء المعرفي وجعل كل نقرة تبدو طبيعية
4. إنشاء مخطط تخطيط أولي
اعتبر هذه الخطوة بمثابة رسم تخطيطي للبيانات باستخدام أدوات بسيطة : قلم وورقة أو باوربوينت أو برنامج نماذج أولية، ارسم مخططاً تقريبياً لتخطيط تقريرك
:حدد
مكان وضع الفلاتر *
عدد العناصر المرئية في الصفحة *
أنواع العناصر المرئية (مخططات شريطية، بطاقات، جداول) *
وضع مؤشرات الأداء الرئيسية وشرائح العرض وتلميحات الأدوات .. إلخ *
هذه المرحلة سريعة وقابلة للتخصيص وتكرارية، وشارك رسوماتك مع الجهات المعنية للتحقق من صحة افتراضاتك، فالملاحظات المبكرة في هذه المرحلة تمنع إعادة التصميم المكلفة لاحقاً
تُركز النماذج الأولية منخفضة الدقة على البنية وليس على الجماليات، وركّز على التسلسل الهرمي والتدفق وسرد القصص لا على الألوان أو أحجام الخطوط في هذه المرحلة
Advertisements
5. طوّر نموذجاً أولياً تفاعلياً مفصلاً
بعد الانتهاء من وضع الهيكل حسّن التجربة البصرية، إذ تُضفي هذه المرحلة عالية الدقة على رسمك طابعاً حيوياً
Power BI Desktop باستخدام بيانات حقيقية أو بيانات نموذجية داخل
:التحسينات
أنواع المخططات وتنسيقها *
الألوان والموضوعات (استخدم هوية الشركة) *
التباعد والمحاذاة والاتساق *
• عناصر تفاعلية مثل الإشارات المرجعية والأزرار وعناصر التتبع تُصبح إمكانية الوصول أيضاً أمراً أساسياً ( استخدم تبايناً كافياً ) وسمّ المخططات بوضوح، وفعّل التنقل عبر لوحة المفاتيح عند الحاجة
لمؤشرات الأداء الرئيسية المحسوبة DAX وطبّق مقاييس
وتفاعلات شرائح الاختبار
يعمل هذا النموذج الأولي كتقرير حقيقي شاركه على نطاق واسع لاختبار قابلية الاستخدام ومراجعة أصحاب المصلحة، وشجّع على تقديم الملاحظات لاكتشاف النقاط غير المهمة وحسّن ملاءمة المحتوى
6. بناء التقرير النهائي ونشره
:بمجرد الموافقة على النموذج الأولي يحين وقت الانتهاء من عملية البناء، تتضمن هذه المرحلة ما يلي
الاتصال بمصادر البيانات المباشرة *
أتمتة جداول تحديث البيانات *
اختبار الأداء (وقت التحميل، استجابة المرشح) *
عند الحاجة (RLS) إعداد أمان مستوى الصف *
Power BI نشر التقرير على خدمة *
ستقوم أيضاً بتكوين لوحات المعلومات والتنبيهات ومساحات عمل التطبيقات لضمان المشاركة والتعاون بشكل سليم
DAX وتأكد من توثيق المنطق وراء حسابات
وهيكل التقرير وتعليمات المستخدم
المُحسّن سريعاً Power BI يجب أن يكون تقرير
وسريع الاستجابة وواضحاً بذاته مما يقلل من الحاجة إلى التوجيه المباشر
7. الصيانة والمراقبة والتحسين المستمر
لا تنتهي مهمتك بالتسليم
الرائعة مع احتياجات المستخدم Power BI إذ تتطور تقارير
وتغيرات الأعمال، لذا طبّق نموذج إدارة لضمان استمرارية القيمة
:يشمل ذلك
• مراقبة مقاييس الاستخدام لتتبع التفاعل *
• جمع الملاحظات الدورية للتحسينات *
• تحديث العناصر المرئية أو المنطق مع تطور مؤشرات الأداء الرئيسية *
• إجراء فحوصات منتظمة لجودة البيانات *
• إدارة الوصول والأمان بمرور الوقت *
أنشئ أيضاً آليات للتحكم في الإصدارات لتتبع تغييرات التقارير، وأَعلِم المستخدمين بالميزات الجديدة (مثل الأسئلة والأجوبة والفلاتر الجديدة) من خلال التوثيق الداخلي أو جلسات التدريب القصيرة
Power BI تُحوّل إدارة التقارير
من مشروعٍ لمرة واحدة إلى أصلٍ تجاريٍّ مستدام
الخلاصة
Power BI تتمثل مهارة إعداد تقارير
في مزيجٍ من التحليل والتصميم والهندسة والتعاطف، فلا يقتصر الأمر على الرسوم البيانية فحسب بل يشمل أيضاً إيصال المعنى
باتباع عمليةٍ مدروسةٍ تُركّز على المستخدم – بدءاً من فهم الاحتياجات والتحقق من صحة الهيكل وصولاً إلى تحسين العناصر المرئية وإدارة التقارير بمرور الوقت – يُمكنك إنشاء تجارب بياناتٍ تُحفّز العمل والرؤى
Becoming a professional data analyst isn’t just about mastering software or memorizing formulas. It’s about thinking critically, asking the right questions, and understanding the story behind the data. If you can confidently answer the following questions — not just theoretically, but in practical scenarios — you’re well on your way to becoming a data analysis pro.
1. What problem am I trying to solve?
Before you even open Excel, SQL, or Python, ask yourself: What business question am I answering?
Whether it’s identifying customer churn, optimizing sales, or forecasting trends — a true analyst knows the “why” behind the analysis.
2. Where is my data coming from, and can I trust it?
Great analysts know: bad data = bad decisions.
Can you:
Identify your data sources?
Validate their accuracy?
Handle missing or inconsistent values?
Tools like SQL, Excel, and Python’s pandas help, but it’s your analytical mindset that makes the difference.
3. Which data is relevant to the problem?
With mountains of data available, the pros know how to filter the noise.
Ask:
What variables are most important?
Which metrics directly affect the outcome?
Can I eliminate any irrelevant data?
This step is all about focus and efficiency.
4. How should I clean and prepare my data?
Data rarely comes neat and tidy. Cleaning is the unglamorous but essential part of the process.
Do you know how to:
Handle nulls?
Standardize formats?
Remove duplicates?
Normalize or transform values?
Mastering data wrangling in Python, R, or Power Query is a key skill of a pro analyst.
Advertisements
5. What are the right tools and techniques to use?
A good analyst chooses tools based on the problem — not just preference.
Can you:
Choose between Excel, SQL, Python, or Tableau depending on the task?
Use statistical models or machine learning when needed?
Automate repetitive tasks using scripts or workflows?
Efficiency + precision = professional.
6. What story does the data tell?
Data without a story is just numbers.
Great analysts turn raw data into insights by:
Identifying patterns and trends
Building logical narratives
Using visualizations to make findings clear and compelling
Ask yourself: If I showed this to a non-technical audience, would they get it?
7. How do I communicate my insights clearly?
Data analysis doesn’t end at insights — it ends at impact.
Can you:
Build a compelling dashboard or report?
Present insights to stakeholders?
Recommend actions backed by data?
Soft skills + storytelling = top-tier analyst.
8. How do I measure the success of my analysis?
The pros reflect on their work. After your analysis:
Did it lead to better decisions?
Were your predictions accurate?
Did your recommendations drive results?
Ask yourself: What could I improve next time?
9. How can I keep learning and improving?
A professional analyst is always evolving.
Do you:
Follow data blogs and communities?
Practice with real-world datasets (like Kaggle or public APIs)?
Stay updated with new tools and techniques?
Curiosity is your greatest asset.
Final Thought
If you can confidently answer these questions — and put them into action — you’re not just crunching numbers. You’re solving problems, telling stories, and driving value. And that’s what makes a professional data analyst.
Advertisements
أنت محلل بيانات محترف إذا أجبت عن هذه الأسئلة
Advertisements
لا يقتصر أن تصبح محلل بيانات محترفاً على إتقان البرمجيات أو حفظ المعادلات بل يشمل التفكير النقدي وطرح الأسئلة الصحيحة وفهم جوهر البيانات، لذا إذا استطعت الإجابة بثقة على الأسئلة التالية – ليس نظرياً فحسب بل عملياً أيضاً فأنت على الطريق الصحيح لتصبح محلل بياناتٍ محترفٍ
ما المشكلة التي أحاول حلها؟
اسأل نفسك Excel أو SQL أو Python قبل أن تفتح برنامج
ما هو سؤال العمل الذي أجيب عليه؟
سواءً كان ذلك تحديد معدل فقدان العملاء أو تحسين المبيعات أو التنبؤ بالاتجاهات – يعرف المحلل الحقيقي “السبب” وراء التحليل
من أين تأتي بياناتي؟ وهل يمكنني الوثوق بها؟
يعرف المحللون المتميزون أن البيانات السيئة تعني قرارات خاطئة
:هل يمكنك
تحديد مصادر بياناتك؟ *
التحقق من دقتها؟ *
معالجة القيم المفقودة أو غير المتسقة؟ *
مفيدة Python من Pandas و Excel و SQL أدوات مثل
لكن عقليتك التحليلية هي ما يُحدث الفرق
ما هي البيانات ذات الصلة بالمشكلة؟
مع توفر كميات هائلة من البيانات يعرف المحترفون كيفية تصفية البيانات غير الضرورية
:اسأل
ما هي المتغيرات الأكثر أهمية؟ *
ما هي المقاييس التي تؤثر بشكل مباشر على النتيجة؟ *
هل يمكنني حذف أي بيانات غير ذات صلة؟ *
تتعلق هذه الخطوة بالتركيز والكفاءة
Advertisements
كيف أُنظّف بياناتي وأُجهّزها؟
نادراً ما تأتي البيانات نظيفة ومرتبة، لذا يُعدّ التنظيف جزءاً أساسياً من العملية ولكنه ليس مُلفتاً للنظر
: هل تعرف كيفية
التعامل مع القيم الفارغة؟ *
توحيد التنسيقات؟ *
إزالة التكرارات؟ *
تطبيع أو تحويل القيم؟ *
Power Query أو R أو Python يُعد إتقان معالجة البيانات في
مهارة أساسية للمحلل المحترف
ما هي الأدوات والتقنيات المناسبة للاستخدام؟
يختار المحلل الجيد الأدوات بناءً على المشكلة وليس فقط على التفضيلات
هل يمكنك الاختيار بين
حسب المهمة؟ Excel أو SQL أو Python أو Tableau *
استخدام النماذج الإحصائية أو التعلم الآلي عند الحاجة؟ *
أتمتة المهام المتكررة باستخدام البرامج النصية أو سير العمل؟ *
الكفاءة + الدقة = احترافية
ما القصة التي ترويها البيانات؟
البيانات بدون قصة هي مجرد أرقام
يُحوّل المحللون المتميزون البيانات الخام إلى رؤى من خلال
تحديد الأنماط والاتجاهات *
بناء سرديات منطقية *
استخدام التصورات لجعل النتائج واضحة ومقنعة *
اسأل نفسك: إذا عرضتُ هذا على جمهور غير متخصص فهل سيفهمونه؟
كيف أوصل رؤيتي بوضوح؟
لا يقتصر تحليل البيانات على الرؤى بل على التأثير
:هل يمكنك
إنشاء لوحة معلومات أو تقرير جذاب؟ *
عرض الرؤى على أصحاب المصلحة؟ *
هل توصي بإجراءات مدعومة بالبيانات؟ *
المهارات الشخصية + سرد القصص = محلل من الطراز الأول
كيف أقيس نجاح تحليلي؟
يُقيّم المحترفون عملهم بعد تحليلك
هل أدى إلى قرارات أفضل؟ *
هل كانت توقعاتك دقيقة؟ *
هل حققت توصياتك نتائج؟ *
اسأل نفسك: ما الذي يُمكنني تحسينه في المرة القادمة؟
كيف يُمكنني مواصلة التعلم والتحسين؟
المحلل المحترف في تطور دائم
هل أنت
تتابع مدونات ومجتمعات البيانات؟ *
تتدرب على مجموعات بيانات واقعية *
؟( أو واجهات برمجة التطبيقات العامة Kaggle :مثل )
تبقى على اطلاع بأحدث الأدوات والتقنيات؟ *
الفضول هو أعظم ثروتك
خاتمة
إذا استطعت الإجابة على هذه الأسئلة بثقة وتطبيقها عملياً فأنت لا تُحلل الأرقام فحسب بل تُحل المشكلات وتُروي القصص وتُحقق القيمة وهذا ما يُميز محلل البيانات المحترف
Breaking into a data science role at a leading company like Walmart requires not only a strong grasp of technical skills but also a deep understanding of probability and statistics. Probability plays a crucial role in decision-making, forecasting, and modeling — all core to the work data scientists do at Walmart, especially in areas such as supply chain optimization, customer behavior analysis, and pricing strategies.
In this article, we’ll walk you through 3 commonly asked probability questions in Walmart data scientist interviews, complete with detailed explanations and solutions to help you prepare with confidence.
Question 1: The Biased Coin Toss
Problem:
You have a biased coin that lands heads with a probability of 0.6 and tails with a probability of 0.4. You toss the coin three times. What is the probability that you get exactly two heads?
Solution:
This is a classic binomial probability problem.
Given:
Number of trials (n) = 3
Probability of success (head) p = 0.6
Probability of failure (tail) q = 0.4
We want exactly k = 2 heads.
Binomial Formula:
Final Answer: 0.432
Question 2: Conditional Probability — Item Recommendation
Problem:
70% of customers who visit Walmart’s website buy at least one item. Among those who buy, 60% also leave a review. Among those who don’t buy, only 10% leave a review.
What is the probability that a customer who left a review actually bought an item?
Solution:
We are given conditional probabilities and need to find the inverse conditional probability — i.e., using Bayes’ Theorem.
Let:
B = customer bought an item
R = customer left a review
We want:
Given:
P(B)=0.7
P(R∣B)=0.6
P(R∣B′)=0.1
P(B′)=0.3
Final Answer: ~93.33%
Advertisements
Question 3: Expected Value — Inventory Demand
Problem:
A store manager at Walmart estimates that the daily demand for a product follows this probability distribution:
Units Demanded
Probability
0
0.1
1
0.2
2
0.4
3
0.2
4
0.1
What is the expected number of units demanded per day?
Solution:
The expected value (mean) of a discrete random variable is:
Final Answer: 2 units per day
Binomial problems assess understanding of discrete distributions, which is key for modeling user behaviors or purchase frequencies.
Bayes’ Theorem is foundational for recommendation systems, fraud detection, and inference under uncertainty.
Expected value is critical in inventory planning, forecasting, and cost modeling — all important to Walmart’s operations.
Pro Tips for Walmart Data Science Interviews
Master the fundamentals: Focus on distributions, expectation, variance, conditional probability, and independence.
Practice real-life scenarios: Walmart loves practical applications. Relate your answers to business problems.
Explain your reasoning: They’re looking for clear thinkers. Walk through your assumptions and logic.
Final Thoughts
Cracking a data science interview at Walmart means demonstrating a deep, intuitive understanding of probability. These three questions give you a solid foundation to prepare and shine. Want to take your prep further? Practice variations, dive into Walmart’s business model, and explore case studies related to retail data.
Good luck — you’ve got this!
Advertisements
ثلاثة أسئلة شائعة في مقابلات علماء البيانات في وول مارت (مع حلول مفصلة)
Advertisements
يتطلب العمل في مجال علم البيانات
Why These Questions Matter
Walmart في شركة رائدة مثل
ليس فقط فهماً عميقاً للمهارات التقنية بل أيضاً فهماً عميقاً للاحتمالات والإحصاءات، إذ تلعب الاحتمالات دوراً حاسماً في صنع القرار والتنبؤ والنمذجة
Walmart وهي جميعها عناصر أساسية في عمل علماء البيانات في
لا سيما في مجالات مثل تحسين سلسلة التوريد وتحليل سلوك العملاء واستراتيجيات التسعير
في هذه المقالة سنشرح لك ثلاثة أسئلة شائعة
Walmart في مقابلات علماء البيانات في
مع شرح وحلول مفصلة لمساعدتك على الاستعداد بثقة
السؤال الأول: رمي العملة المعدنية المتحيز
:المشكلة
لديك عملة معدنية متحيزة واحتمال ظهور وجهها (الصورة) هو 0.6 ووجهها (الكتابة) هو 0.4 رميت العملة ثلاث مرات، فما هو احتمال ظهور وجهين فقط (الصورة)؟
:الحل
هذه مسألة احتمالية ثنائية تقليدية
المعطيات
3 = (n) عدد المحاولات
0.6 = (p) احتمال النجاح (الصورة)
0.4 = (q) احتمال الفشل (الكتابة)
صورتين = (k) نريد بالضبط
: صيغة ثنائية الحدين
الإجابة النهائية: ٠٫٤٣٢
السؤال الثاني: الاحتمال الشرطي – توصية المنتج
:المشكلة
٧٠٪ من زوار موقع وول مارت الإلكتروني يشترون منتجاً واحداً على الأقل
من بين المشترين ٦٠٪ يتركون تقييماً أيضاً
ومن بين الذين لا يشترون ١٠٪ فقط يتركون تقييماً
ما هو احتمال أن يكون العميل الذي ترك تقييماً قد اشترى المنتج بالفعل؟
يقدر مدير متجر في وول مارت أن الطلب اليومي على منتج ما يتبع توزيع الاحتمالات التالي
الاحتمال
الوحدات المطلوبة
0.1
0
0.2
1
0.4
2
0.2
3
0.1
4
ما هو عدد الوحدات المطلوبة يومياً؟
: الحل
: القيمة المتوقعة (المتوسط) لمتغير عشوائي منفصل هي
الإجابة النهائية: وحدتان يومياً
لماذا هذه الأسئلة مهمة؟
تُقيّم المسائل ثنائية الحدّ فهم التوزيعات المنفصلة وهو أمرٌ أساسيٌّ لنمذجة سلوكيات المستخدمين أو تكرارات الشراء *
تُعدّ نظرية بايز أساساً لأنظمة التوصية وكشف الاحتيال والاستدلال في ظلّ عدم اليقين *
تُعدّ القيمة المتوقعة بالغة الأهمية في تخطيط المخزون والتنبؤ ونمذجة التكلفة وكلها عوامل بالغة الأهمية لعمليات وول مارت *
:نصائح احترافية لمقابلات وول مارت في علم البيانات
أتقن الأساسيات: ركّز على التوزيعات والتوقعات والتباين والاحتمال الشرطي والاستقلالية
تدرّب على سيناريوهات واقعية: تُحبّ وول مارت التطبيقات العملية، لذا اربط إجاباتك بمشاكل العمل
اشرح منطقك: إنهم يبحثون عن مفكرين ذوي رؤى بعيدة، لذا استعرض افتراضاتك ومنطقك
:الخاتمة
يعني اجتياز مقابلة علم بيانات في وول مارت إظهار فهم عميق وبديهي للاحتمالات، إذ تمنحك هذه الأسئلة الثلاثة أساساً متيناً للاستعداد والتألق، فهل ترغب في تطوير استعدادك؟ مارس التنوعات واستكشف نموذج أعمال وول مارت واستكشف دراسات الحالة المتعلقة ببيانات البيع بالتجزئة
In 2025, generating passive income is more accessible than ever—if you master the right skills. Whether you’re working a full-time job or looking to build financial freedom, these 8 in-demand skills can set you up for steady, automated income streams. Here’s what to learn, tools to use, and how each skill turns into passive income.
Create a niche YouTube channel or blog that gets consistent views. Earn through AdSense, affiliate links, and digital product sales (e.g., eBooks or courses).
2. Print-on-Demand & Merch Design
Skill Type: Design & eCommerce
What to Learn:
Graphic design basics
Niche research
Setting up an online store (Etsy, Shopify)
Marketing with SEO and Pinterest
Tools:
Canva, Adobe Illustrator
Printful, Teespring, Redbubble
Shopify, Etsy, Everbee
Passive Income Example:
Design t-shirts, mugs, or stickers. Upload to POD platforms. Every sale generates revenue with no need to handle shipping or inventory.
3. Affiliate Marketing
Skill Type: Digital Marketing
What to Learn:
How affiliate programs work
Copywriting and persuasive content
SEO and social media marketing
Email list building
Tools:
Amazon Associates, ShareASale, Impact
ConvertKit, MailerLite (for email marketing)
Ahrefs, Ubersuggest (for keyword research)
Passive Income Example:
Create a niche website reviewing tech gadgets. Include affiliate links. Earn commissions every time someone buys through your link.
Advertisements
4. Investing in Dividend Stocks / ETFs
Skill Type: Finance & Investing
What to Learn:
Stock market basics
Understanding ETFs and dividend yields
Portfolio diversification
Risk management
Tools:
Robinhood, Fidelity, M1 Finance
Seeking Alpha, Yahoo Finance
Personal Capital (for tracking)
Passive Income Example:
Build a diversified dividend portfolio. Earn quarterly or monthly dividends that grow over time without active involvement.
5. Writing & Selling eBooks
Skill Type: Writing & Publishing
What to Learn:
Writing structure and formatting
Self-publishing on Kindle Direct Publishing (KDP)
Marketing your eBook on Amazon and social media
Tools:
Scrivener, Google Docs
Amazon KDP, Gumroad
Canva (for covers), Bookbolt
Passive Income Example:
Write a how-to guide or fiction novel. Publish it on KDP. Earn royalties every time someone downloads or buys your book.
6. Online Course Creation
Skill Type: Teaching & Product Development
What to Learn:
Curriculum planning
Video and screen recording
Engaging teaching methods
Marketing funnels
Tools:
Teachable, Thinkific, Gumroad
Loom, OBS Studio (for recording)
ChatGPT (to help generate course outlines)
Passive Income Example:
Create a course on productivity or design. Sell on your own site or platforms like Udemy. Students pay once, and you keep earning.
7. App or Web Development (SaaS Projects)
Skill Type: Technical & Programming
What to Learn:
Full-stack development (HTML, CSS, JavaScript, Python, React)
UX/UI design
Database management
How SaaS (Software as a Service) works
Tools:
VS Code, GitHub, Firebase
Stripe (for payments), Notion (for planning)
Framer, Figma (for design)
Passive Income Example:
Build a simple productivity app or business tool. Charge a monthly fee. Users sign up and pay recurring subscriptions.
8. Stock Photography / Digital Assets Selling
Skill Type: Photography & Digital Design
What to Learn:
Photography or digital design fundamentals
How to create high-demand digital products
Licensing and copyright
Tools:
Lightroom, Photoshop, Canva
Shutterstock, Adobe Stock, Creative Market
Etsy (for selling templates, icons, etc.)
Passive Income Example:
Upload photos, templates, or icons to stock platforms. Every download or license purchase earns you money.
Final Thoughts
Learning these skills doesn’t mean overnight riches—but investing time in one or two can build steady passive income over time. The key is consistency, quality, and automation. Focus on creating assets that work for you, even while you sleep.
Advertisements
أفضل المهارات التي يجب تعلمها لكسب آلاف الدولارات من الدخل السلبي في العام 2025
Advertisements
في عام 2025 أصبح توليد الدخل السلبي أسهل من أي وقت مضى إذا أتقنت المهارات المناسبة، سواء كنت تعمل بدوام كامل أو تسعى إلى بناء استقلالك المالي فإن هذه المهارات الثمانية المطلوبة تُمكّنك من تحقيق دخل ثابت وآلي
إليك ما يجب تعلمه والأدوات التي يمكنك استخدامها وكيف تتحول كل مهارة إلى مصدر دخل سلبي
: ١. إنشاء المحتوى (يوتيوب، التدوين، البودكاست)
:ما يجب تعلمه
تحرير الفيديو وكتابة السيناريوهات وتحسين محركات البحث للمحتوى *
منصات التدوين (مثل ووردبريس) *
كيفية بناء قاعدة جماهيرية والتفاعل معها *
استراتيجيات تحقيق الدخل (الإعلانات، روابط التسويق بالعمولة، الرعايات) *
:الأدوات
YouTube Studio, Canva, Adobe Premiere Pro
WordPress, Google Analytics
Buzzsprout (for podcasts), Substack
: مثال
أنشئ قناة أو مدونة متخصصة على يوتيوب تحقق مشاهدات ثابتة، اربح المال من خلال أدسنس وروابط التسويق بالعمولة ومبيعات المنتجات الرقمية (مثل الكتب الإلكترونية أو الدورات التدريبية)
: ٢. الطباعة عند الطلب وتصميم المنتجات
وذلك من خلال التصميم والتجارة الإلكترونية
:ما يجب تعلمه
أساسيات التصميم الجرافيكي *
البحث عن تخصصات محددة *
(Etsy، Shopify) إنشاء متجر إلكتروني *
(SEO) و Pinterest التسويق باستخدام تحسين محركات البحث *
:الأدوات
Canva، Adobe Illustrator
Printful، Teespring، Redbubble
Shopify، Etsy، Everbee
: مثال
تصميم قمصان أو أكواب أو ملصقات وتحميلها على منصات الطباعة عند الطلب، فكل عملية بيع تُدرّ إيرادات دون الحاجة إلى التعامل مع الشحن أو المخزون
: ٣. التسويق الرقمي
:ما يجب تعلمه
كيفية عمل برامج التسويق بالعمولة *
كتابة المحتوى التسويقي والمحتوى الإقناعي *
تحسين محركات البحث والتسويق عبر وسائل التواصل الاجتماعي *
بناء قوائم البريد الإلكتروني *
:الأدوات
Amazon Associates، ShareASale، Impact *
ConvertKit، (للتسويق عبر البريد الإلكتروني) MailerLite *
Ahrefs، (للبحث عن الكلمات المفتاحية) Ubersuggest *
: مثال
أنشئ موقعاً إلكترونياً متخصصاً يُراجع الأدوات التقنية وأضف روابط تسويق بالعمولة واكسب عمولات في كل مرة يشتري فيها شخص ما من خلال رابطك
: ٤. الاستثمار في أسهم الأرباح/ صناديق الاستثمار المتداولة
:ما يجب تعلمه
أساسيات سوق الأسهم *
فهم صناديق الاستثمار المتداولة وعوائد الأرباح *
تنويع المحفظة *
إدارة المخاطر *
:الأدوات
Robinhood, Fidelity, M1 Finance
Seeking Alpha, Yahoo Finance
Personal Capital ( للتتبع )
: مثال
أنشئ محفظة متنوعة من أرباح الأسهم لتحصل على أرباح ربع سنوية أو شهرية تنمو بمرور الوقت دون أي تدخل فعّال
Advertisements
: ٥. كتابة وبيع الكتب الإلكترونية
:ما يجب تعلمه
هيكلية الكتابة وتنسيقها *
Kindle Direct Publishing (KDP) النشر الذاتي على *
تسويق كتابك الإلكتروني على أمازون ومنصات التواصل الاجتماعي *
:الأدوات
Scrivener، Google Docs *
Amazon KDP، Gumroad *
Canva، Bookbolt *
: مثال
اكتب دليلاً إرشادياً أو رواية خيالية
Kindle Direct Publishing ثم انشرها على
لتربح عائدات في كل مرة يقوم فيها شخص ما بتنزيل كتابك أو شرائه
: ٦. إنشاء دورات تدريبية عبر الإنترنت
: ما يجب تعلمه
تخطيط المناهج الدراسية *
تسجيل الفيديو والشاشة *
طرق تدريس تفاعلية *
مسارات التسويق *
:الأدوات
Teachable، Thinkific، Gumroad *
Loom، (للتسجيل) OBS Studio *
(للمساعدة في إعداد مخططات الدورات التدريبية) ChatGPT *
: مثال
أنشئ دورة تدريبية في الإنتاجية أو التصميم ثم بعها
Udemy على موقعك الخاص أو منصات مثل
إذ يدفع الطلاب مرة واحدة وتستمر أنت في الكسب
: ٧. تطوير التطبيقات أو الويب
: ما يجب تعلمه
(HTML، CSS، JavaScript، Python، React) تطوير تطبيقات كاملة *
UX/UI تصميم *
إدارة قواعد البيانات *
(البرمجيات كخدمة) SaaS كيفية عمل *
: الأدوات
VS Code، GitHub، Firebase
(للتخطيط) Notion ، (للدفع) Stripe
(للتصميم) Figma ، Framer
: مثال
أنشئ تطبيق إنتاجية بسيط أو أداة وظيفية ثم ادفع رسوماً شهرية بحيث يقوم المستخدمون بالتسجيل ودفع اشتراكات دورية
٨. بيع الصور الفوتوغرافية الرقمية / الأصول الرقمية
: ما يجب تعلمه
أساسيات التصوير الفوتوغرافي أو التصميم الرقمي *
كيفية إنشاء منتجات رقمية عالية الطلب *
الترخيص وحقوق الطبع والنشر *
: الأدوات
Lightroom, Photoshop, Canva *
Shutterstock, Adobe Stock, Creative Market *
(لبيع القوالب والأيقونات، إلخ) Etsy *
مثال
حمّل الصور أو القوالب أو الأيقونات إلى منصات الصور الرقمية، فكل تنزيل أو شراء ترخيص يُدر عليك دخلاً
خاتمة
لا يعني تعلم هذه المهارات ثراءً بين عشية وضحاها ولكن استثمار الوقت في مهارة أو اثنتين يمكن أن يُبني دخلاً سلبياً ثابتاً مع مرور الوقت، واعلم أن السر هو الاتساق والجودة والأتمتة، وركّز على إنشاء أصول تناسبك تصنع لك دخلاً حتى أثناء نومك
In an age where speed, access, and accuracy drive competitive advantage, relying on dusty file cabinets and analog records is like racing in a horse-drawn carriage on the autobahn. Digitizing business archives isn’t just about going paperless—it’s about unlocking your data’s potential, minimizing operational friction, and empowering your teams to move with confidence. You’ve probably felt the pain of hunting down a misplaced contract or trying to cross-reference data that lives in ten different formats.
Choose the Right Scanning Workflow
There’s no one-size-fits-all when it comes to scanning your physical archives. High-speed document scanners are great for standard papers, but fragile items or oversized documents may require flatbed or specialty scanners. Decide early whether you’ll handle scanning in-house or outsource to a third-party digitization service—each has its own cost, timeline, and quality control implications. Creating a clear scanning workflow ensures that the process runs smoothly, with attention to metadata tagging, file naming conventions, and storage destinations from the start.
Safeguard Sensitive Data in the Digital Shift
As you digitize your archives, protecting sensitive information becomes just as important as preserving it. From employee records to client contracts, some documents carry high stakes if leaked or mishandled, making data protection a non-negotiable part of your strategy. Encryption, secure user authentication, and audit trails should be built into your digital infrastructure from the start to prevent breaches and misuse.
Select Smart Storage Solutions
Once your files are digitized, the next move is choosing how and where to store them so they’re both secure and easily retrievable. Cloud platforms offer scalability, remote access, and data redundancy, making them a strong choice for most organizations, especially those with distributed teams. But not all files belong in the cloud—sensitive data may require local or hybrid solutions that comply with industry regulations.
Implement Metadata and Indexing Standards
Digitization without metadata is like a library with no catalog system—it may all be there, but good luck finding what you need. When you add structured metadata during the digitization process, you create pathways for quick search, categorization, and data linkage. This is especially useful when working across departments or time zones, where different teams might need to access the same file for different purposes.
Advertisements
Plan for Long-Term Data Migration
Technology moves fast, and digital archives that live in yesterday’s formats are tomorrow’s headaches. Make sure your digitization strategy includes a plan for regular data migrations so you’re not left scrambling when a software becomes obsolete. Whether you’re storing files in proprietary systems or open formats, it’s smart to future-proof your files by choosing widely supported, non-proprietary formats like PDF/A, CSV, or XML. Stay ahead by scheduling periodic reviews of your storage solutions and making updates before they become urgent.
Train Your Team on the New System
No matter how elegant your digitized archive is, it’s useless if your team doesn’t know how to use it. Conduct hands-on training to familiarize everyone with the new systems, file structures, search tools, and permissions protocols. Encourage a feedback loop so users can flag hiccups or suggest improvements that make everyday usage smoother. Turning archived files into active tools requires buy-in and competence across your workforce—not just from IT or leadership.
Integrate Archives With Existing Platforms
One major benefit of digitizing your business archives is the chance to connect them to tools you already use. Whether it’s your CRM, ERP, or project management software, linking archives to these systems can create seamless workflows and reduce redundant data entry. Integration allows your teams to pull up relevant documents in real-time—right when they’re working on a task—instead of toggling between platforms or wasting time searching. This helps turn archival data into a living resource that supports daily decision-making.
Transforming your business archives from physical clutter into digital gold takes effort, but the payoff is real. Once scattered records become strategic assets when they’re accessible, secure, and woven into your daily workflows. You don’t just save time—you gain clarity, accountability, and a better handle on the full history of your organization’s decisions and actions. Digitization gives you the chance to treat your data like the powerful resource it is, not just a pile of paper taking up space in a storage room.
Unlock the power of data with Data World, your go-to source for innovative business solutions and educational services in data science!
Written by Cameron Ward
Advertisements
رقمنة الماضي: استراتيجيات ذكية لتحويل أرشيفات الأعمال إلى أصول يسهل الوصول إليها
Advertisements
في عصر تُعزز فيه السرعة وسهولة الوصول والدقة الميزة التنافسية، يُشبه الاعتماد على خزائن الملفات المُغبرة والسجلات التناظرية سباقاً في عربة تجرها الخيول على الطريق السريع، إذ لا تقتصر رقمنة أرشيفات الأعمال على الاستغناء عن الورق فحسب بل تشمل أيضاً إطلاق العنان لإمكانات بياناتك وتقليل الاحتكاك التشغيلي وتمكين فريقك من العمل بثقة، فربما شعرتَ بمشقة البحث عن عقد في غير محله أو محاولة مقارنة بيانات موجودة بعشرة تنسيقات مختلفة
اختر سير عمل المسح الضوئي المناسب
لا يوجد حل واحد يناسب الجميع عندما يتعلق الأمر بمسح أرشيفاتك المادية، إذ تُعدّ ماسحات المستندات عالية السرعة مثالية للأوراق القياسية ولكن قد تتطلب المستندات الهشة أو كبيرة الحجم ماسحات ضوئية مسطحة أو ماسحات ضوئية متخصصة، لذا قرر مُبكراً ما إذا كنت ستتولى المسح الضوئي داخلياً أو ستُسنده إلى جهة خارجية لخدمات رقمنة ( لكلٍّ منهما تكلفته وجدوله الزمني وآثاره على مراقبة الجودة ) بحيث يضمن إنشاء سير عمل واضح للمسح الضوئي سلاسة العملية مع الاهتمام منذ البداية بوضع علامات على البيانات الوصفية وتسمية الملفات ووجهات التخزين
حماية البيانات الحساسة في التحول الرقمي
مع رقمنة أرشيفاتك تُصبح حماية المعلومات الحساسة بنفس أهمية الحفاظ عليها من سجلات الموظفين إلى عقود العملاء، إذ تحمل بعض المستندات مخاطر عالية في حال تسريبها أو إساءة استخدامها مما يجعل حماية البيانات جزءاً لا يتجزأ من استراتيجيتك، لذا يجب دمج التشفير ومصادقة المستخدم الآمنة ومسارات التدقيق في بنيتك التحتية الرقمية منذ البداية لمنع الاختراقات وسوء الاستخدام
اختر حلول التخزين الذكية
بمجرد رقمنة ملفاتك تتمثل الخطوة التالية في اختيار كيفية ومكان تخزينها بحيث تكون آمنة وسهلة الاسترداد، بحيث توفر منصات السحابة قابلية التوسع والوصول عن بُعد وتكرار البيانات مما يجعلها خياراً قوياً لمعظم المؤسسات وخاصةً تلك التي لديها فرق عمل موزعة، ولكن ليست كل الملفات تنتمي إلى السحابة فقد تتطلب البيانات الحساسة حلولاً محلية أو مختلطة تتوافق مع لوائح الصناعة
Advertisements
تطبيق معايير البيانات الوصفية والفهرسة
الرقمنة بدون بيانات وصفية أشبه بمكتبة بدون نظام فهرسة فقد يكون كل شيء موجوداً ولكن نتمنى لك التوفيق في العثور على ما تحتاجه، فعند إضافة بيانات وصفية منظمة أثناء عملية الرقمنة فإنك تُنشئ مسارات للبحث السريع والتصنيف وربط البيانات، لذا يُعد هذا مفيداً بشكل خاص عند العمل عبر أقسام أو مناطق زمنية مختلفة حيث قد تحتاج فرق مختلفة إلى الوصول إلى الملف نفسه لأغراض مختلفة
التخطيط لنقل البيانات على المدى الطويل
تتطور التكنولوجيا بسرعة وعليه تعد الأرشيفات الرقمية التي تعيش بتنسيقات قديمة مصدر قلق للغد، لذا تأكد من أن استراتيجية الرقمنة الخاصة بك تتضمن خطة لنقل البيانات بانتظام حتى لا تُترك في حيرة عندما يصبح أحد البرامج قديماً، فسواء كنت تُخزن الملفات في أنظمة خاصة أو تنسيقات مفتوحة فمن الحكمة تأمين ملفاتك للمستقبل باختيار تنسيقات غير خاصة مدعومة على نطاق واسع
PDF/A أو CSV أو XML مثل
ابقَ في الطليعة بجدولة مراجعات دورية لحلول التخزين لديك وإجراء التحديثات قبل أن تصبح عاجلة
درّب فريقك على النظام الجديد
مهما كان أرشيفك الرقمي أنيقاً فلن يكون ذا فائدة إذا لم يكن فريقك على دراية بكيفية استخدامه، لذا قدّم تدريباً عملياً لتعريف الجميع بالأنظمة الجديدة وهياكل الملفات وأدوات البحث وبروتوكولات الأذونات، ثم شجع على تبادل الآراء والملاحظات حتى يتمكن المستخدمون من الإبلاغ عن أي مشاكل أو اقتراح تحسينات تجعل الاستخدام اليومي أكثر سلاسة، يتطلب تحويل الملفات المؤرشفة إلى أدوات فعالة دعماً وكفاءة من جميع فرق العمل لديك وليس فقط من قسم تكنولوجيا المعلومات أو القيادة
دمج الأرشيفات مع المنصات الحالية
من أهم فوائد رقمنة أرشيفات أعمالك إمكانية ربطها بالأدوات التي تستخدمها بالفعل
(CRM) فسواءً كان نظام إدارة علاقات العملاء
(ERP) أو نظام تخطيط موارد المؤسسات
أو برنامج إدارة المشاريع فإن ربط الأرشيفات بهذه الأنظمة يمكن أن يُسهّل سير العمل ويقلل من إدخال البيانات المكررة، بحيث يتيح التكامل لفرقك الوصول إلى المستندات ذات الصلة فوراً مباشرةً أثناء عملهم على مهمة ما، بدلاً من التنقل بين المنصات أو إضاعة الوقت في البحث، فهذا يساعد على تحويل بيانات الأرشيف إلى مورد حيوي يدعم اتخاذ القرارات اليومية
يتطلب تحويل أرشيفات أعمالك من فوضى مادية إلى ثروة رقمية جهوداً كبيرة لكن ثمارها حقيقية، بحيث تُصبح السجلات المتناثرة أصولاً استراتيجية عندما تكون سهلة الوصول وآمنة ومدمجة في سير عملك اليومي، فهنا أنت لا توفر الوقت فحسب بل تكتسب الوضوح والمساءلة وتتحكم بشكل أفضل في التاريخ الكامل لقرارات وإجراءات مؤسستك، وعليه تمنحك الرقمنة فرصة التعامل مع بياناتك كمورد قوي وليس مجرد كومة من الورق تشغل مساحة في غرفة تخزين
مصدرك الأمثل لحلول الأعمال المبتكرة والخدمات التعليمية في علم البيانات Data World اكتشف عالَم البيانات مع
The role of a Lead Data Engineer has gained significant prominence in today’s data-driven world, as businesses increasingly rely on data analytics and machine learning to drive decision-making. This career path is ideal for professionals with strong technical expertise in data architecture, engineering, and management, coupled with leadership skills to guide teams and projects effectively. If you are considering a career as a Lead Data Engineer, understanding the responsibilities, required skills, educational background, and potential career trajectory is essential for success in this field.
Understanding the Role of a Lead Data Engineer
A Lead Data Engineer is responsible for designing, developing, and maintaining data architectures that enable seamless data processing and analytics. This role involves overseeing data pipelines, managing data storage solutions, and ensuring data quality, security, and compliance. Unlike junior or mid-level data engineers, a lead data engineer takes on a more strategic role by leading teams, coordinating cross-functional collaboration, and aligning data infrastructure with business goals. They work closely with data scientists, analysts, and software engineers to build scalable and efficient data solutions that drive insights and innovation.
Essential Skills and Technologies
To thrive as a Lead Data Engineer, professionals must master a combination of technical and soft skills. Technical expertise in programming languages such as Python, Java, and Scala is crucial for developing and maintaining data pipelines. Proficiency in SQL and NoSQL databases, such as PostgreSQL, MongoDB, and Cassandra, is essential for effective data storage and retrieval. Additionally, familiarity with big data technologies like Apache Spark, Hadoop, and Kafka is necessary for handling large-scale data processing.
Cloud computing skills are increasingly important as organizations migrate to cloud-based solutions. A Lead Data Engineer should be well-versed in cloud platforms such as AWS, Azure, and Google Cloud, leveraging services like Amazon Redshift, Google BigQuery, and Azure Synapse Analytics for data warehousing and processing. Experience with data modeling, ETL (Extract, Transform, Load) processes, and data pipeline orchestration using tools like Apache Airflow or Prefect further enhances a professional’s ability to manage data workflows efficiently.
Beyond technical skills, leadership and communication abilities are vital for this role. A Lead Data Engineer must collaborate with stakeholders across different departments, translating business requirements into technical solutions. Strong problem-solving skills and an analytical mindset enable them to anticipate challenges, optimize data workflows, and implement best practices in data governance and security.
Advertisements
Educational Background and Certifications
A career as a Lead Data Engineer typically begins with a strong educational foundation in computer science, information technology, data science, or a related field. A bachelor’s degree is often the minimum requirement, though many professionals advance their careers by obtaining a master’s degree in data engineering, data science, or software engineering.
In addition to formal education, industry-recognized certifications can help professionals validate their expertise and stay competitive in the job market. Certifications such as Google Cloud Professional Data Engineer, AWS Certified Data Analytics – Specialty, Microsoft Certified: Azure Data Engineer Associate, and the Cloudera Certified Data Engineer credential demonstrate proficiency in cloud computing and data engineering best practices.
Career Path and Growth Opportunities
The journey to becoming a Lead Data Engineer often starts with entry-level positions such as Data Engineer, Database Administrator, or Software Engineer. As professionals gain experience in designing data pipelines, working with big data frameworks, and managing data infrastructures, they progress to senior data engineering roles before advancing into leadership positions.
Once established as a Lead Data Engineer, career growth opportunities extend into higher managerial roles such as Data Engineering Manager, Director of Data Engineering, or even Chief Data Officer (CDO). These roles involve greater responsibilities in shaping an organization’s data strategy, implementing enterprise-wide data initiatives, and driving innovation through data-driven decision-making.
Conclusion
A career as a Lead Data Engineer offers a rewarding and dynamic path for professionals passionate about data management, architecture, and leadership. By developing technical expertise, acquiring industry certifications, and honing leadership skills, aspiring data engineers can successfully navigate this career trajectory and make a significant impact in the ever-evolving field of data engineering. Whether working for tech giants, financial institutions, healthcare providers, or startups, Lead Data Engineers play a pivotal role in enabling organizations to harness the power of data for strategic advantage.
Advertisements
دليلك لتصبح قائدًا في مجال هندسة البيانات
Advertisements
اكتسب دور مهندس بيانات رئيسي أهمية كبيرة في عالم اليوم الذي يعتمد على البيانات حيث تعتمد الشركات بشكل متزايد على تحليلات البيانات والتعلم الآلي لدعم عملية صنع القرار، إذ يُعد هذا المسار الوظيفي مثالياً للمهنيين ذوي الخبرة التقنية المتميزة في هندسة البيانات وهندستها وإدارتها، إلى جانب مهارات القيادة اللازمة لتوجيه الفرق والمشاريع بفعالية، إذا كنت تفكر في العمل كمهندس بيانات رئيسي فإن فهم المسؤوليات والمهارات المطلوبة والخلفية التعليمية والمسار الوظيفي المحتمل أمر أساسي للنجاح في هذا المجال
فهم دور مهندس بيانات رئيسي
يتولى مهندس البيانات الرئيسي مسؤولية تصميم وتطوير وصيانة هياكل البيانات التي تُمكّن من معالجة البيانات وتحليلها بسلاسة، بحيث يشمل هذا الدور الإشراف على قنوات البيانات وإدارة حلول تخزين البيانات وضمان جودة البيانات وأمنها والامتثال لها، فبخلاف مهندسي البيانات المبتدئين أو المتوسطين يتولى مهندس البيانات الرئيسي دوراً أكثر استراتيجية من خلال قيادة الفرق وتنسيق التعاون بين الوظائف ومواءمة البنية التحتية للبيانات مع أهداف العمل بحيث يتعاونون بشكل وثيق مع علماء البيانات والمحللين ومهندسي البرمجيات لبناء حلول بيانات قابلة للتطوير وفعالة تُحفّز الابتكار والرؤى
المهارات والتقنيات الأساسية
للنجاح كمهندس بيانات رئيسي يجب على المحترفين إتقان مزيج من المهارات التقنية والشخصية، إذ تُعد الخبرة التقنية في لغات البرمجة مثل بايثون وجافا وسكالا أساسية لتطوير وصيانة خطوط أنابيب البيانات
NoSQL و SQL كما أن إتقان قواعد بيانات
PostgreSQL و MongoDB و Cassandra مثل
ضروري لتخزين البيانات واسترجاعها بفعالية، بالإضافة إلى ذلك يُعدّ الإلمام بتقنيات البيانات الضخمة
Apache Spark و Hadoop و Kafka مثل
ضرورياً للتعامل مع معالجة البيانات واسعة النطاق
تزداد أهمية مهارات الحوسبة السحابية مع انتقال المؤسسات إلى الحلول السحابية، إذ يجب أن يكون مهندس البيانات الرئيسي على دراية جيدة بمنصات السحابة
AWS وAzure وGoogle Cloud مثل
والاستفادة من خدمات مثل
Amazon Redshift و Google BigQuery و Azure Synapse Analytics
لتخزين البيانات ومعالجتها، وعليه تُعزز الخبرة في نمذجة البيانات
(ETL) وعمليات الاستخراج والتحويل والتحميل
وتنسيق خطوط أنابيب البيانات باستخدام أدوات
Prefect أو Apache Airflow مثل
قدرة المحترف على إدارة سير عمل البيانات بكفاءة
إلى جانب المهارات التقنية تُعد مهارات القيادة والتواصل أساسية لهذا الدور، إذ يجب على كبير مهندسي البيانات التعاون مع الجهات المعنية في مختلف الأقسام وترجمة متطلبات العمل إلى حلول تقنية تُمكّنه مهاراته القوية في حل المشكلات وعقليته التحليلية من توقع التحديات وتحسين سير عمل البيانات وتطبيق أفضل الممارسات في حوكمة البيانات وأمنها
Advertisements
الخلفية التعليمية والشهادات
يبدأ مسار مهندس البيانات الرئيسي عادةً بأساس تعليمي متين في علوم الحاسوب أو تكنولوجيا المعلومات أو علوم البيانات أو مجال ذي صلة، فغالباً ما تكون درجة البكالوريوس هي الحد الأدنى المطلوب مع أن العديد من المهنيين يطورون مسيرتهم المهنية بالحصول على درجة الماجستير في هندسة البيانات أو علوم البيانات أو هندسة البرمجيات بالإضافة إلى التعليم الرسمي يمكن للشهادات المعترف بها في هذا المجال أن تساعد المهنيين على إثبات خبراتهم والحفاظ على قدرتهم التنافسية في سوق العمل، وبناءً عليه تُثبت شهادات مثل
Google Cloud Professional مهندس بيانات
المعتمدة – التخصصية AWS وتحليلات بيانات
Microsoft المعتمد من Azure ومهندس بيانات
المعتمد Cloudera ومهندس بيانات
الكفاءة في أفضل ممارسات الحوسبة السحابية وهندسة البيانات
المسار الوظيفي وفرص النمو
غالباً ما تبدأ رحلة التحول إلى مهندس بيانات رئيسي بوظائف مبتدئة مثل مهندس بيانات أو مسؤول قواعد بيانات أو مهندس برمجيات ومع اكتساب المهنيين الخبرة في تصميم خطوط أنابيب البيانات والعمل مع أطر البيانات الضخمة وإدارة البنى التحتية للبيانات يتقدمون إلى مناصب عليا في هندسة البيانات قبل الترقي إلى مناصب قيادية بمجرد ترسيخهم كمهندس بيانات رئيسي تمتد فرص النمو الوظيفي إلى مناصب إدارية أعلى مثل مدير هندسة البيانات أو مدير هندسة البيانات
(CDO) أو حتى رئيس قسم البيانات
بحيث تتضمن هذه الأدوار مسؤوليات أكبر في صياغة استراتيجية بيانات المؤسسة وتنفيذ مبادرات البيانات على مستوى المؤسسة ودفع عجلة الابتكار من خلال اتخاذ القرارات القائمة على البيانات
الخلاصة
تُتيح مهنة مهندس بيانات رئيسي مساراً وظيفياً مجزياً وحيوياً للمهنيين الشغوفين بإدارة البيانات وبنيتها وقيادتها، فمن خلال تطوير الخبرة التقنية والحصول على شهادات متخصصة وصقل مهارات القيادة يُمكن لمهندسي البيانات الطموحين شقّ طريقهم بنجاح في هذا المسار الوظيفي وإحداث تأثير كبير في مجال هندسة البيانات المتطور باستمرار، فسواءً كانوا يعملون لدى شركات التكنولوجيا العملاقة أو المؤسسات المالية أو مقدمي الرعاية الصحية أو الشركات الناشئة فإن مهندسي البيانات الرئيسيين يلعبون دوراً محورياً في تمكين المؤسسات من تسخير قوة البيانات لتحقيق ميزة استراتيجية
In today’s fast-paced digital landscape, businesses generate vast amounts of data daily. However, raw data alone holds little value unless it is effectively analyzed and transformed into actionable insights. Organizations that master this process gain a competitive edge by making informed decisions that drive growth and efficiency. Here’s how to translate data into actionable business insights.
1. Define Clear Objectives
Before analyzing data, businesses must establish clear objectives. Without a defined goal, data analysis can be unfocused and ineffective. Consider the following steps:
Identify the key challenges or opportunities your business faces.
Determine the specific metrics that align with your goals.
Ensure all stakeholders understand the objectives to maintain consistency.
2. Collect Relevant Data
Data collection should be strategic and focused on quality rather than quantity. Organizations must:
Utilize structured and unstructured data sources such as sales records, customer feedback, and market trends.
Implement tools like CRM systems, Google Analytics, or business intelligence platforms to gather accurate data.
Ensure data is cleaned and validated to remove inconsistencies and errors.
3. Analyze the Data Effectively
Data analysis is crucial in identifying patterns and correlations that inform business decisions. Effective methods include:
Using statistical analysis to uncover trends and anomalies.
Applying machine learning and artificial intelligence for predictive analytics.
Employing visualization tools such as dashboards and graphs to make complex data easier to interpret.
Advertisements
4. Identify Key Insights
Extracting actionable insights requires identifying the most significant data trends. Consider:
Correlating data findings with business objectives.
Recognizing customer behavior patterns and preferences.
Pinpointing inefficiencies and opportunities for optimization.
5. Transform Insights into Action
Data-driven insights must be translated into tangible business strategies. This involves:
Implementing changes based on findings, such as adjusting marketing strategies or optimizing supply chain operations.
Encouraging a data-driven culture where decisions are backed by analytical evidence.
Continuously monitoring and refining actions based on real-time feedback.
6. Measure Impact and Refine Strategies
The effectiveness of data-driven actions must be regularly assessed. Businesses should:
Set key performance indicators (KPIs) to track progress.
Use A/B testing to evaluate the impact of implemented strategies.
Iterate and adjust strategies based on performance results to ensure continuous improvement.
Conclusion
Translating data into actionable business insights is a structured process that requires clear objectives, quality data collection, robust analysis, and strategic implementation. By leveraging technology and fostering a data-driven culture, businesses can enhance decision-making, optimize operations, and stay ahead in competitive markets. In a world where data is abundant, the real advantage lies in how effectively it is used to drive meaningful business outcomes.
Advertisements
معالجة البيانات لاستخراج رؤى أعمال قابلة للتنفيذ
Advertisements
في ظلّ التطور الرقمي المتسارع اليوم تُنتج الشركات كميات هائلة من البيانات يومياً، ومع ذلك لا تُعدّ البيانات الخام وحدها ذات قيمة تُذكر ما لم تُحلّل بفعالية وتُحوّل إلى رؤى قابلة للتنفيذ، إذ تكتسب المؤسسات التي تُتقن هذه العملية ميزة تنافسية من خلال اتخاذ قرارات مدروسة تُحفّز النمو والكفاءة
إليك كيفية ترجمة البيانات إلى رؤى أعمال قابلة للتنفيذ
1. تحديد أهداف واضحة
قبل تحليل البيانات يجب على الشركات تحديد أهداف واضحة، فبدون هدف مُحدّد قد يكون تحليل البيانات غير مُركّز وغير فعّال، وعليه يُرجى مراعاة الخطوات التالية
تحديد التحديات أو الفرص الرئيسية التي تواجه عملك *
تحديد المقاييس المُحدّدة التي تتوافق مع أهدافك *
التأكد من فهم جميع أصحاب المصلحة للأهداف للحفاظ على الاتساق *
2. جمع البيانات ذات الصلة
يجب أن يكون جمع البيانات استراتيجياً وأن يُركّز على الجودة لا على الكمية، لذا يجب على المؤسسات
استخدام مصادر بيانات مُهيكلة وغير مُهيكلة مثل سجلات المبيعات وملاحظات العملاء واتجاهات السوق *
(CRM) استخدم أدوات مثل أنظمة إدارة علاقات العملاء *
أو تحليلات جوجل أو منصات ذكاء الأعمال لجمع بيانات دقيقة
تأكد من تنظيف البيانات والتحقق من صحتها لإزالة أي تناقضات أو أخطاء *
3. تحليل البيانات بفعالية
يُعد تحليل البيانات أمراً بالغ الأهمية في تحديد الأنماط والارتباطات التي تُرشد قرارات الأعمال، تشمل الأساليب الفعالة ما يلي
استخدام التحليل الإحصائي للكشف عن الاتجاهات والاختلالات *
تطبيق التعلم الآلي والذكاء الاصطناعي للتحليلات التنبؤية *
استخدام أدوات التصور مثل لوحات المعلومات والرسوم البيانية لتسهيل تفسير البيانات المعقدة *
Advertisements
4. تحديد الرؤى الرئيسية
:يتطلب استخلاص رؤى عملية تحديد أهم اتجاهات البيانات، لذا عليك الأخذ بعين الاعتبار الخطوات التالية
ربط نتائج البيانات بأهداف العمل *
التعرف على أنماط سلوك العملاء وتفضيلاتهم *
تحديد أوجه القصور وفرص التحسين *
5. تحويل الرؤى إلى أفعال
:يجب ترجمة الرؤى المستندة إلى البيانات إلى استراتيجيات عمل ملموسة، يتضمن ذلك
تنفيذ التغييرات بناءً على النتائج مثل تعديل استراتيجيات التسويق أو تحسين عمليات سلسلة التوريد *
تشجيع ثقافة قائمة على البيانات حيث تُدعم القرارات بأدلة تحليلية *
المراقبة المستمرة وتحسين الإجراءات بناءً على التغذية الراجعة الفورية *
6. قياس الأثر وتحسين الاستراتيجيات
:يجب تقييم فعالية الإجراءات القائمة على البيانات بانتظام، وهذا يحتِّم على الشركات
لتتبع التقدم (KPIs) وضع مؤشرات أداء رئيسية *
لتقييم تأثير الاستراتيجيات المطبقة A/B استخدام اختبار *
تكرار وتعديل الاستراتيجيات بناءً على نتائج الأداء لضمان التحسين المستمر *
الخلاصة
إن تحويل البيانات إلى رؤى أعمال قابلة للتنفيذ عملية منظمة تتطلب أهدافاً واضحة وجمع بيانات عالية الجودة وتحليلاً دقيقاً وتنفيذاً استراتيجياً، فمن خلال الاستفادة من التكنولوجيا وتعزيز ثقافة قائمة على البيانات، ويمكن للشركات تحسين عملية صنع القرار وتحسين العمليات والبقاء في الصدارة في الأسواق التنافسية، وعليه وفي عالم تتوفر فيه البيانات بكثرة تكمن الميزة الحقيقية في مدى فعالية استخدامها لتحقيق نتائج أعمال ذات معنى
Data Science has evolved into one of the most sought-after careers in the tech industry, driven by advancements in artificial intelligence, machine learning, and big data analytics. As we step into 2025, the demand for skilled data scientists continues to grow across various industries, from healthcare to finance and e-commerce. This roadmap is designed to provide a structured approach to mastering data science, covering fundamental concepts, essential tools, and real-world applications.
1. Understanding the Basics of Data Science
Before diving into complex algorithms and big data processing, it is crucial to understand the foundation of data science.
Definition and Scope: Data Science is the interdisciplinary field that combines statistics, programming, and domain expertise to extract insights from data. For example, in healthcare, predictive models analyze patient data to forecast disease outbreaks and personalize treatment plans.
Mathematics & Statistics: Concepts such as probability, linear algebra, and statistical inference are the backbone of data science. A strong grasp of these topics enables data scientists to develop models that provide actionable insights, such as predicting customer churn in a subscription service.
2. Programming Languages for Data Science
Programming is a fundamental skill in data science, with Python and R being the most popular choices.
Python: Widely used due to its versatility and extensive libraries such as NumPy, Pandas, and Scikit-learn. For instance, Netflix uses Python to analyze user viewing patterns and recommend content.
R: Preferred in academia and research for statistical analysis and visualization, with applications in pharmaceutical companies for clinical trials and drug efficacy studies.
3. Data Collection and Cleaning
Data is often messy and unstructured, making data cleaning a vital step in the data science workflow.
Data Collection: Sourcing data from APIs, web scraping, or databases like SQL. For example, e-commerce platforms collect user purchase history to understand buying trends.
Data Cleaning: Handling missing values, removing duplicates, and standardizing formats using libraries like Pandas. Poor data quality in financial analytics can lead to inaccurate risk assessments, affecting investment decisions.
4. Exploratory Data Analysis (EDA)
EDA is the process of analyzing data sets to summarize their main characteristics and discover patterns.
Data Visualization: Using Matplotlib and Seaborn to create charts and graphs. For instance, sales teams use bar charts to identify seasonal trends in product demand.
Statistical Analysis: Identifying correlations and distributions. In sports analytics, teams analyze player performance data to refine strategies and optimize team selection.
Advertisements
5. Machine Learning Fundamentals
Machine learning allows computers to learn patterns from data and make predictions without being explicitly programmed.
Supervised Learning: Training models using labeled data. A bank may use classification models to detect fraudulent transactions.
Unsupervised Learning: Clustering and association techniques to find hidden patterns, such as customer segmentation in marketing campaigns.
Deep Learning: Neural networks that power AI applications like image recognition in self-driving cars.
6. Big Data Technologies
With the exponential growth of data, big data technologies are essential for efficient processing and analysis.
Hadoop & Spark: Distributed computing frameworks for handling massive datasets. Social media companies process user interactions using Spark to recommend personalized content.
NoSQL Databases: MongoDB and Cassandra for handling unstructured data in real-time applications, such as ride-sharing apps tracking driver and passenger locations.
7. Model Deployment and MLOps
Deploying models into production ensures they provide value in real-world applications.
Flask & FastAPI: Creating APIs for machine learning models. A healthcare provider may deploy a patient risk assessment model via an API to integrate it into hospital management systems.
MLOps: Automating ML pipelines using CI/CD tools. For instance, companies like Spotify continuously update their recommendation engines based on user listening habits.
8. Ethics and Bias in Data Science
Data science has ethical implications, and addressing biases is critical to ensuring fairness and accuracy.
Bias in AI Models: AI models trained on biased data can produce discriminatory results. For example, biased hiring algorithms may favor certain demographics over others.
Data Privacy: Adhering to regulations like GDPR and CCPA to protect user data, as seen in tech companies implementing stricter data-sharing policies.
Conclusion
The journey to becoming a proficient data scientist in 2025 requires a strong foundation in mathematics, programming, machine learning, and big data technologies. By following this roadmap, aspiring data scientists can build the necessary skills to solve real-world problems across various industries. With continuous learning and hands-on practice, mastering data science is an achievable goal.
Advertisements
خارطة الطريق الشاملة لعلم البيانات 2025
Advertisements
مقدمة
تطور علم البيانات ليصبح من أكثر المهن رواجاً في قطاع التكنولوجيا مدفوعاً بالتطورات في الذكاء الاصطناعي والتعلم الآلي وتحليلات البيانات الضخمة، ومع حلول عام 2025 يستمر الطلب على علماء البيانات المهرة في النمو في مختلف القطاعات من الرعاية الصحية إلى التمويل والتجارة الإلكترونية، صُممت هذه الخارطة لتوفير نهج منظم لإتقان علم البيانات يغطي المفاهيم الأساسية والأدوات الضرورية والتطبيقات العملية
1. فهم أساسيات علم البيانات
قبل الخوض في الخوارزميات المعقدة ومعالجة البيانات الضخمة من الضروري فهم أسس علم البيانات
التعريف والنطاق: علم البيانات هو مجال متعدد التخصصات يجمع بين الإحصاء والبرمجة والخبرة في مختلف المجالات لاستخلاص رؤى من البيانات، فعلى سبيل المثال: في مجال الرعاية الصحية تُحلل النماذج التنبؤية بيانات المرضى للتنبؤ بتفشي الأمراض وتخصيص خطط العلاج
الرياضيات والإحصاء: تُشكل مفاهيم مثل الاحتمالات والجبر الخطي والاستدلال الإحصائي العمود الفقري لعلم البيانات، ويُمكّن الإلمام القوي بهذه المواضيع علماء البيانات من تطوير نماذج تُقدم رؤى عملية مثل التنبؤ بانخفاض عدد العملاء في خدمة الاشتراك
2. لغات البرمجة لعلم البيانات
تُعدّ البرمجة مهارة أساسية في علم البيانات
الخيارين الأكثر شيوعاً Rويُعدّ بايثون و
بايثون: يُستخدم على نطاق واسع نظراً لتعدد استخداماته ومكتباته الواسعة
NumPy و Pandas و Scikit-learn مثل
بايثون لتحليل أنماط مشاهدة Netflix فعلى سبيل المثال: تستخدم
المستخدمين وتوصية المحتوى
يُفضّل استخدامه في الأوساط الأكاديمية :R
والبحثية للتحليل الإحصائي والتصور وله تطبيقات في شركات الأدوية للتجارب السريرية ودراسات فعالية الأدوية
3. جمع البيانات وتنظيفها
غالباً ما تكون البيانات فوضوية وغير مُهيكلة مما يجعل تنظيفها خطوة حيوية في سير عمل علم البيانات
جمع البيانات: الحصول على البيانات
(APIs) من واجهات برمجة التطبيقات
أو كشط البيانات من الويب أو قواعد البيانات مثل SQL، على سبيل المثال: تجمع منصات التجارة الإلكترونية سجل مشتريات المستخدمين لفهم اتجاهات الشراء
تنظيف البيانات: معالجة القيم المفقودة وإزالة التكرارات وتوحيد التنسيقات
Pandas باستخدام مكتبات مثل
وقد يؤدي ضعف جودة البيانات في التحليلات المالية إلى تقييمات غير دقيقة للمخاطر مما يؤثر على قرارات الاستثمار
4. (EDA)تحليل البيانات الاستكشافي
تحليل البيانات الاستكشافي هو عملية تحليل مجموعات البيانات لتلخيص خصائصها الرئيسية واكتشاف أنماطها
:التصور البياني
لإنشاء المخططات والرسوم البيانية Matplotlib و Seaborn استخدام
فعلى سبيل المثال: تستخدم فرق المبيعات المخططات الشريطية لتحديد الاتجاهات الموسمية في الطلب على المنتجات
التحليل الإحصائي: تحديد الارتباطات والتوزيعات، ففي التحليلات الرياضية تُحلل الفرق بيانات أداء اللاعبين لتحسين الاستراتيجيات وتحسين اختيار الفريق
Advertisements
5. أساسيات التعلم الآلي
يسمح التعلم الآلي لأجهزة الكمبيوتر بتعلم الأنماط من البيانات وإجراء تنبؤات دون الحاجة إلى برمجة صريحة
التعلم المُشرف: تدريب النماذج باستخدام بيانات مُصنفة بحيث قد يستخدم البنك نماذج التصنيف للكشف عن المعاملات الاحتيالية
التعلم غير المُشرف: تقنيات التجميع والترابط لاكتشاف الأنماط الخفية مثل تقسيم العملاء في الحملات التسويقية
التعلم العميق: الشبكات العصبية التي تُشغّل تطبيقات الذكاء الاصطناعي مثل التعرف على الصور في السيارات ذاتية القيادة
6. تقنيات البيانات الضخمة
مع النمو الهائل للبيانات تُعدّ تقنيات البيانات الضخمة أساسيةً للمعالجة والتحليل الفعّال
:Hadoop و Spark
أطر عمل حوسبة موزعة للتعامل مع مجموعات البيانات الضخمة، إذ تُعالج شركات التواصل الاجتماعي تفاعلات المستخدمين
لتوصية محتوى مُخصّص Spark باستخدام
: MongoDBقواعد بيانات
Cassandra و NoSQL
للتعامل مع البيانات غير المُهيكلة في تطبيقات الوقت الفعلي مثل تطبيقات مشاركة الرحلات التي تتتبّع مواقع السائقين والركاب
7. (MLOps)نشر النماذج وعمليات إدارة التعلم الآلي
يضمن نشر النماذج في بيئة الإنتاج تقديم قيمة مُضافة في التطبيقات الواقعية
إنشاء واجهات برمجة تطبيقات لنماذج التعلم الآلي : Flask و FastAPI
بحيث يُمكن لمُقدّم الرعاية الصحية نشر نموذج تقييم مخاطر المريض عبر واجهة برمجة تطبيقات لدمجه في أنظمة إدارة المستشفيات
:(MLOps)عمليات التعلم الآلي
أتمتة مسارات التعلم الآلي باستخدام أدوات
(CI/CD) التكامل المستمر/التضمين المستمر
Spotify فعلى سبيل المثال: تُحدّث شركات مثل
محركات التوصيات الخاصة بها باستمرار بناءً على عادات استماع المستخدمين
8. الأخلاقيات والتحيز في علوم البيانات
لعلم البيانات آثار أخلاقية ومعالجة التحيزات أمر بالغ الأهمية لضمان العدالة والدقة
التحيز في نماذج الذكاء الاصطناعي: يمكن أن تُنتج نماذج الذكاء الاصطناعي المُدرّبة على بيانات متحيزة نتائج تمييزية، فعلى سبيل المثال: قد تُفضّل خوارزميات التوظيف المتحيزة فئات سكانية مُعيّنة على أخرى
خصوصية البيانات: الالتزام بلوائح مثل اللائحة العامة
وقانون خصوصية المستهلك (GDPR) لحماية البيانات
لحماية بيانات المستخدم (CCPA) في كاليفورنيا
كما هو الحال في شركات التكنولوجيا التي تُطبّق سياسات أكثر صرامة لمشاركة البيانات
الخلاصة
تتطلب رحلة التحول إلى عالم بيانات ماهر بحلول عام ٢٠٢٥ أساساً متيناً في الرياضيات والبرمجة والتعلم الآلي وتقنيات البيانات الضخمة، فباتباع هذه الخارطة يمكن لعلماء البيانات الطموحين بناء المهارات اللازمة لحل مشكلات واقعية في مختلف القطاعات، ومع التعلم المستمر والممارسة العملية يُصبح إتقان علم البيانات هدفاً قابلاً للتحقيق
Creating a professional dashboard requires careful planning, an understanding of user needs, and the application of design principles to ensure clarity and usability.
Step 1: Defining the purpose and audience:
Before diving into design or development, it’s essential to identify what the dashboard aims to achieve. Whether it’s for business analytics, financial tracking, or project management, understanding the end-user’s needs and the key metrics they will rely on ensures that the dashboard delivers relevant and actionable insights. This step often involves gathering requirements from stakeholders, analyzing existing workflows, and determining which data points are most critical to decision-making. Without this foundational understanding, the dashboard risks being cluttered, ineffective, or overwhelming.
Step 2: Data collection and integration:
A dashboard is only as useful as the quality and accuracy of the data it presents. At this stage, data sources must be identified and connected. These sources can include databases, APIs, spreadsheets, or third-party services. Ensuring data consistency and reliability is crucial, as any errors or inconsistencies can mislead users and negatively impact decision-making. Data transformation and cleaning processes may be necessary to standardize formats and remove inconsistencies. Moreover, real-time or scheduled data updates must be considered based on the dashboard’s intended use. For dashboards requiring live data, establishing secure and efficient connections with data sources is essential to ensure smooth operation and performance.
Advertisements
Step 3: Designing the dashboard layout and user interface:
Effective dashboard design prioritizes clarity, ease of use, and visual hierarchy. This means organizing data in a way that allows users to quickly understand and interpret information without unnecessary distractions. The use of charts, graphs, tables, and key performance indicators (KPIs) should be carefully planned to enhance readability. Selecting the right type of visualization for different data sets is critical; for instance, line charts work well for trends over time, while pie charts are more suited for proportional comparisons. Additionally, applying a consistent color scheme, typography, and spacing improves the overall aesthetic and usability of the dashboard. Interactive elements such as filters, drill-down capabilities, and tooltips can be incorporated to provide users with more control over how they view and analyze data.
Step 4: Development and implementation:
Depending on the complexity of the dashboard, development can involve using business intelligence (BI) tools such as Tableau, Power BI, or Google Data Studio, or custom development using programming languages like JavaScript with libraries such as D3.js or React.js. The choice of technology depends on factors such as scalability, customization needs, and integration capabilities. During the development phase, it’s crucial to ensure that the dashboard is responsive, meaning it functions well on different screen sizes, including desktops, tablets, and mobile devices. User authentication and role-based access control may also be necessary to restrict sensitive data to authorized users only.
Step 5: Testing, feedback, and iteration:
This step is vital for ensuring the dashboard meets user expectations and performs efficiently. Testing should include both technical and usability aspects. Performance testing ensures that the dashboard loads data quickly and functions smoothly, even with large datasets. Usability testing involves gathering feedback from actual users to identify any issues with navigation, readability, or overall experience. Based on feedback, necessary refinements should be made to improve functionality and user satisfaction. Continuous monitoring and updates should be planned to keep the dashboard relevant as business needs and data sources evolve.
By following these steps—defining purpose and audience, collecting and integrating data, designing an intuitive interface, implementing with the right tools, and continuously improving through testing and feedback—a professional dashboard can provide valuable insights and enhance decision-making processes across various industries.
Advertisements
مراحل إنشاء لوحة معلومات احترافية
Advertisements
يتطلب إنشاء لوحة معلومات احترافية تخطيطاً دقيقاً وفهماً لاحتياجات المستخدم وتطبيق مبادئ التصميم لضمان الوضوح وسهولة الاستخدام
الخطوة 1: تحديد الغرض والجمهور
قبل الخوض في التصميم أو التطوير من الضروري تحديد ما تهدف لوحة المعلومات إلى تحقيقه، سواء كان ذلك لتحليلات الأعمال أو التتبع المالي أو إدارة المشاريع فإن فهم احتياجات المستخدم النهائي والمقاييس الرئيسية التي سيعتمد عليها يضمن أن لوحة المعلومات تقدم رؤى ذات صلة وقابلة للتنفيذ، فغالباً ما تتضمن هذه الخطوة جمع المتطلبات من أصحاب المصلحة وتحليل سير العمل الحالية وتحديد نقاط البيانات الأكثر أهمية لاتخاذ القرار، وبدون هذا الفهم الأساسي تخاطر لوحة المعلومات بالتكدس أو عدم الفعالية أو الإرهاق
الخطوة 2: جمع البيانات ودمجها
لوحة المعلومات مفيدة فقط بقدر جودة ودقة البيانات التي تقدمها، ففي هذه المرحلة يجب تحديد مصادر البيانات وتوصيلها، ويمكن أن تشمل هذه المصادر قواعد البيانات أو واجهات برمجة التطبيقات أو جداول البيانات أو خدمات الجهات الخارجية، لذا فإن ضمان اتساق البيانات وموثوقيتها أمر بالغ الأهمية حيث أن أي أخطاء أو تناقضات يمكن أن تضلل المستخدمين وتؤثر سلباً على اتخاذ القرار قد تكون عمليات تحويل البيانات وتنظيفها ضرورية لتوحيد التنسيقات وإزالة التناقضات، علاوة على ذلك يجب النظر في تحديثات البيانات في الوقت الفعلي أو المجدولة بناءً على الاستخدام المقصود للوحة المعلومات، فبالنسبة للوحات المعلومات التي تتطلب بيانات مباشرة فإن إنشاء اتصالات آمنة وفعالة مع مصادر البيانات أمر ضروري لضمان التشغيل السلس والأداء
Advertisements
الخطوة 3: تصميم تخطيط لوحة المعلومات وواجهة المستخدم
يعطي تصميم لوحة المعلومات الفعال الأولوية للوضوح وسهولة الاستخدام والتسلسل الهرمي المرئي، وهذا يعني تنظيم البيانات بطريقة تسمح للمستخدمين بفهم المعلومات وتفسيرها بسرعة دون تشتيتات غير ضرورية، لذا يجب التخطيط بعناية لاستخدام المخططات والرسوم البيانية والجداول
لتحسين قابلية القراءة (KPIs) ومؤشرات الأداء الرئيسية
بحيث يعد اختيار النوع المناسب من التصور لمجموعات البيانات المختلفة أمراً بالغ الأهمية فعلى سبيل المثال: تعمل المخططات الخطية بشكل جيد للاتجاهات بمرور الوقت، بينما تكون المخططات الدائرية أكثر ملاءمة للمقارنات النسبية، بالإضافة إلى ذلك يؤدي تطبيق مخطط ألوان وخطوط وتباعد متناسق إلى تحسين المظهر الجمالي العام وسهولة استخدام لوحة المعلومات، بحيث يمكن دمج العناصر التفاعلية مثل المرشحات وإمكانيات التنقيب وإرشادات الأدوات لتزويد المستخدمين بمزيد من التحكم في كيفية عرض البيانات وتحليلها
الخطوة 4: التطوير والتنفيذ
اعتماداً على تعقيد لوحة المعلومات يمكن أن يتضمن التطوير استخدام أدوات ذكاء الأعمال
Google Data Studio أو Power BI أو Tableau مثل (BI)
أو التطوير المخصص باستخدام لغات البرمجة
React.js. أو D3.js مع مكتبات مثل JavaScript مثل
يعتمد اختيار التكنولوجيا على عوامل مثل قابلية التوسع واحتياجات التخصيص وإمكانيات التكامل، فأثناء مرحلة التطوير من الأهمية بمكان التأكد من أن لوحة المعلومات سريعة الاستجابة مما يعني أنها تعمل بشكل جيد على أحجام شاشات مختلفة بما في ذلك أجهزة الكمبيوتر المكتبية والأجهزة اللوحية والأجهزة المحمولة، قد يكون مصادقة المستخدم والتحكم في الوصول القائم على الدور ضروريين أيضاً لتقييد البيانات الحساسة للمستخدمين المصرح لهم فقط
الخطوة 5: الاختبار والملاحظات والتكرار
هذه الخطوة حيوية لضمان تلبية لوحة المعلومات لتوقعات المستخدم وأدائها بكفاءة، فيجب أن يتضمن الاختبار كلاً من الجوانب الفنية وقابلية الاستخدام، بحيث يضمن اختبار الأداء أن لوحة المعلومات تقوم بتحميل البيانات بسرعة وتعمل بسلاسة حتى مع مجموعات البيانات الكبيرة، وعليه يتضمن اختبار قابلية الاستخدام جمع الملاحظات من المستخدمين الفعليين لتحديد أي مشكلات في التنقل أو قابلية القراءة أو التجربة الشاملة، وبناءً على الملاحظات يجب إجراء التحسينات اللازمة لتحسين الوظائف ورضا المستخدم، كما ويجب التخطيط للمراقبة والتحديثات المستمرة للحفاظ على لوحة المعلومات ذات صلة باحتياجات العمل ومصادر البيانات المتطورة
باتباع هذه الخطوات: تحديد الغرض والجمهور وجمع البيانات ودمجها وتصميم واجهة بديهية والتنفيذ بالأدوات المناسبة والتحسين المستمر من خلال الاختبار والملاحظات يمكن أن توفر لوحة المعلومات الاحترافية رؤى قيمة وتعزز عمليات اتخاذ القرار عبر مختلف الصناعات
The introduction of ChatGPT has transformed the way many professionals approach their work, and data science is no exception. As a data scientist, my daily tasks, workflows, and problem-solving strategies have significantly evolved since integrating ChatGPT into my routine. Here’s how.
1. Streamlined Data Cleaning and Preprocessing:
Data cleaning, once a time-consuming process, has become much more efficient. With ChatGPT’s ability to generate code snippets in Python, R, or SQL, I can quickly tackle issues like handling missing values, encoding categorical variables, or normalizing data. Instead of searching through endless documentation, I now receive instant suggestions tailored to my specific dataset challenges.
2. Faster Prototyping and Experimentation:
When testing new machine learning models, speed matters. ChatGPT helps by providing boilerplate code for various algorithms, suggesting hyperparameter tuning techniques, and explaining the pros and cons of each model. This acceleration allows me to spend more time interpreting results rather than building experiments from scratch.
3. Enhanced Collaboration and Communication:
Explaining complex data science concepts to non-technical stakeholders has always been challenging. ChatGPT assists in translating technical jargon into simple language. Whether preparing reports, presentations, or dashboards, I now craft narratives that resonate with diverse audiences, making data-driven decisions easier to communicate.
Advertisements
4. Improved Documentation and Code Quality:
Good documentation is essential but often overlooked. ChatGPT helps generate comprehensive docstrings, comments, and README files. This ensures that my codebase remains understandable and maintainable, especially when collaborating with larger teams.
5. Rapid Troubleshooting and Debugging:
Debugging code used to be a time sink. Now, I describe errors to ChatGPT and receive potential solutions instantly. It also offers best practices for optimizing performance, ensuring my models run efficiently without extensive trial and error.
6. Continuous Learning and Skill Development:
Data science is an ever-evolving field. ChatGPT acts as a personalized tutor, explaining new algorithms, statistical concepts, or advanced machine learning techniques on demand. This constant learning support helps me stay ahead of industry trends without sifting through countless resources.
7. Ethical Considerations and Bias Detection:
AI ethics is more important than ever. ChatGPT highlights potential biases in datasets and suggests mitigation strategies. This has made me more conscious of fairness, accountability, and transparency in my projects.
Conclusion
ChatGPT has become an indispensable part of my data science toolkit. From boosting productivity and code quality to enhancing communication and ethical awareness, its impact is undeniable. While it doesn’t replace human expertise, it amplifies our capabilities, enabling data scientists like me to focus on what truly matters: deriving meaningful insights and driving informed decisions.
Advertisements
في تطوير أدائك الوظيفي في علم البيانات؟ChatGPTكيف يساهم
Advertisements
إلى تحويل الطريقة ChatGPT لقد أدى ظهور
التي يتعامل بها العديد من المحترفين مع عملهم، وعلم البيانات ليس استثناءً فبصفتي عالِم بيانات تطورت مهامي اليومية وسير العمل واستراتيجيات حل المشكلات
في روتيني ChatGPT بشكل كبير منذ دمج برنامج
وإليك الطريقة
1. تنظيف البيانات ومعالجتها مسبقاً بشكل مبسط
تنظيف البيانات الذي كان في السابق عملية تستغرق وقتاً طويلاً أصبح الآن أكثر كفاءة
ChatGPT فبفضل قدرة برنامج
على إنشاء مقتطفات من التعليمات البرمجية
SQL أو R أو Python في
يمكنني معالجة مشكلات مثل التعامل مع القيم المفقودة أو ترميز المتغيرات التصنيفية أو تطبيع البيانات بسرعة، فبدلاً من البحث عبر وثائق لا نهاية لها أصبحت أتلقى الآن اقتراحات فورية مصممة خصيصاً لتحديات مجموعة البيانات الخاصة بي
2. إنشاء نماذج أولية وتجارب أسرع
عند اختبار نماذج التعلم الآلي الجديدة فإن السرعة مهمة
ChatGPT إذ يساعد برنامج
من خلال توفير التعليمات البرمجية الجاهزة لخوارزميات مختلفة واقتراح تقنيات ضبط المعلمات الفائقة وشرح إيجابيات وسلبيات كل نموذج، بحيث يتيح لي هذا التسارع قضاء المزيد من الوقت في تفسير النتائج بدلاً من بناء التجارب من الصفر
3. تعزيز التعاون والتواصل
كان شرح مفاهيم علوم البيانات المعقدة لأصحاب المصلحة غير الفنيين دائماً أمراً صعباً
ChatGPT إذ يساعد
في ترجمة المصطلحات الفنية إلى لغة بسيطة سواء كنت أقوم بإعداد التقارير أو العروض التقديمية أو لوحات المعلومات فأنا الآن أقوم بصياغة سرديات تتردد صداها مع جماهير متنوعة مما يجعل القرارات القائمة على البيانات أسهل في التواصل
Advertisements
4. تحسين التوثيق وجودة التعليمات البرمجية
التوثيق الجيد ضروري ولكن غالباً ما يتم تجاهله
ChatGPT وعليه أصبح
README يساعد في إنشاء سلاسل توثيق شاملة وتعليقات وملفات
وهذا يضمن أن قاعدة التعليمات البرمجية الخاصة بي تظل مفهومة وقابلة للصيانة خاصة عند التعاون مع فرق أكبر
5. استكشاف الأخطاء وإصلاحها بسرعة
كان تصحيح أخطاء التعليمات البرمجية مضيعة للوقت
وأتلقى الحلول المحتملة على الفور ChatGPT أما الآن أصف الأخطاء لـ
كما يقدم أفضل الممارسات لتحسين الأداء مما يضمن تشغيل نماذجي بكفاءة دون تجربة وخطأ مكثفين
6. التعلم المستمر وتطوير المهارات
يعد علم البيانات مجالاً متطوراً باستمرار
كمعلم شخصي ChatGPT وفي هذا السياق يعمل
يشرح الخوارزميات الجديدة أو المفاهيم الإحصائية أو تقنيات التعلم الآلي المتقدمة عند الطلب، فيساعدني دعم التعلم المستمر هذا في البقاء في طليعة اتجاهات الصناعة دون غربلة موارد لا حصر لها
7. الاعتبارات الأخلاقية واكتشاف التحيز
أصبحت أخلاقيات الذكاء الاصطناعي أكثر أهمية من أي وقت مضى
يسلط الضوء على التحيزات المحتملة في مجموعات البيانات ChatGPT فأصبح
ويقترح استراتيجيات التخفيف، مما جعلني أكثر وعياً بالعدالة والمساءلة والشفافية في مشاريعي
الخلاصة
جزءاً لا غنى عنه ChatGPT أصبح
من مجموعة أدوات علم البيانات الخاصة بي، فمن تعزيز الإنتاجية وجودة الكود إلى تعزيز التواصل والوعي الأخلاقي فإن تأثيره لا يمكن إنكاره، في حين أنه لا يحل محل الخبرة البشرية فإنه يعزز قدراتنا مما يمكن علماء البيانات مثلي من التركيز على ما يهم حقاً استخلاص رؤى ذات مغزى واتخاذ قرارات مستنيرة
The Google UX Design Certificate is a comprehensive, fully online program designed to equip learners with the essential skills required for entry-level positions in user experience (UX) design. As of 2025, this certificate remains a valuable resource for individuals aiming to enter the UX field, regardless of their prior experience.
Program Overview
Hosted on the Coursera platform, the Google UX Design Professional Certificate encompasses seven courses that cover a wide array of UX design topics. The curriculum is structured to provide both theoretical knowledge and practical application, ensuring that learners can develop job-ready skills. Key areas of focus include:
User-Centered Design: Understanding and applying design principles that prioritize the needs and experiences of users.
UX Research: Learning methodologies for planning and conducting research studies, including user interviews and usability testing.
Wireframing and Prototyping: Gaining proficiency in creating wireframes and interactive prototypes using industry-standard tools like Figma and Adobe XD.
Usability Testing: Developing skills to test designs with users, gather feedback, and iterate on solutions to enhance usability.
Responsive Web Design: Designing applications and websites that function seamlessly across various devices and screen sizes.
Upon completion, learners will have developed a professional portfolio featuring three end-to-end projects: a mobile app, a responsive website, and a cross-platform experience. This portfolio serves as a tangible demonstration of the skills acquired throughout the program.
Time Commitment and Cost
The program is designed to be flexible, allowing learners to progress at their own pace. On average, it is structured to be completed in approximately six months, with an estimated commitment of 10 hours per week. The cost is based on a monthly subscription model, priced at $49 per month. Therefore, the total investment for the program typically ranges between $234 and $300, depending on the time taken to complete the coursework.
Career Support and Opportunities
Graduates of the Google UX Design Certificate program gain access to a variety of career resources. These include resume-building assistance, interview preparation guidance, and exclusive access to a job board through the Google Career Certificates Employer Consortium. This consortium comprises numerous employers interested in hiring individuals with demonstrated UX design competencies.
The demand for UX designers continues to grow, with over 63,000 open jobs in the field and a median entry-level salary of $115,000 as of 2025. This underscores the potential return on investment for individuals who successfully complete the program and pursue a career in UX design.
Advertisements
Student Experiences and Considerations
Feedback from program participants highlights several strengths of the Google UX Design Certificate:
Comprehensive Curriculum: Learners appreciate the thorough coverage of fundamental UX concepts and practical applications.
Flexibility: The self-paced nature of the program allows individuals to balance their studies with other commitments.
Portfolio Development: The inclusion of real-world projects enables learners to build a professional portfolio, which is crucial for job applications.
However, some learners have noted areas for improvement:
Peer Feedback: While peer reviews are part of the learning process, some students feel the need for more structured mentorship and professional critique to enhance their learning experience.
Career Support: Although resources are provided, a more robust, structured career support system could further assist graduates in transitioning to the workforce.
Conclusion
In 2025, the Google UX Design Certificate stands as a valuable and accessible pathway for individuals aspiring to enter the UX design profession. Its comprehensive curriculum, practical project work, and flexible online format make it a strong contender for those seeking to develop job-ready skills in a cost-effective manner. Prospective learners should consider their personal learning preferences and career objectives to determine if this program aligns with their professional aspirations.
Advertisements
في عام 2025Googleدليلك للحصول على شهادة تصميم تجربة المستخدم من
Advertisements
Google شهادة تصميم تجربة المستخدم من
هي برنامج شامل عبر الإنترنت مصمم لتزويد المتعلمين بالمهارات الأساسية المطلوبة
(UX) لشغل وظائف المبتدئين في تصميم تجربة المستخدم
اعتباراً من عام 2025 تظل هذه الشهادة مورداً قيماً للأفراد الذين يهدفون إلى دخول مجال تجربة المستخدم بغض النظر عن خبرتهم السابقة
نظرة عامة على البرنامج
Google تتضمن شهادة تصميم تجربة المستخدم الاحترافية من
سبع دورات Coursera التي تستضيفها منصة
تغطي مجموعة واسعة من موضوعات تصميم تجربة المستخدم، بحيث تم تصميم المنهج الدراسي لتوفير المعرفة النظرية والتطبيق العملي مما يضمن قدرة المتعلمين على تطوير المهارات اللازمة للوظيفة
:تشمل مجالات التركيز الرئيسية ما يلي
التصميم الموجه نحو المستخدم: فهم وتطبيق مبادئ التصميم التي تعطي الأولوية لاحتياجات وتجارب المستخدمين
بحث تجربة المستخدم: تعلم منهجيات التخطيط وإجراء الدراسات البحثية بما في ذلك مقابلات المستخدمين واختبار قابلية الاستخدام
النمذجة والنماذج الأولية: اكتساب الكفاءة في إنشاء النماذج الأولية والنماذج الأولية التفاعلية
Figma و Adobe XD باستخدام أدوات قياسية في الصناعة مثل
اختبار قابلية الاستخدام: تطوير المهارات اللازمة لاختبار التصميمات مع المستخدمين وجمع الملاحظات وتكرار الحلول لتحسين قابلية الاستخدام
تصميم الويب المستجيب: تصميم التطبيقات ومواقع الويب التي تعمل بسلاسة عبر أجهزة وأحجام شاشات مختلفة
عند الانتهاء سيتمكن المتعلمون من تطوير محفظة احترافية تضم ثلاثة مشاريع شاملة: تطبيق جوال وموقع ويب مستجيب وتجربة متعددة المنصات، فتعمل هذه المحفظة كدليل ملموس على المهارات المكتسبة طوال البرنامج
الالتزام بالوقت والتكلفة
تم تصميم البرنامج ليكون مرناً مما يسمح للمتعلمين بالتقدم بالسرعة التي تناسبهم، ففي المتوسط تم تصميمه ليتم إكماله في حوالي ستة أشهر مع التزام تقديري بـ 10 ساعات في الأسبوع، تعتمد التكلفة على نموذج اشتراك شهري بسعر 49 دولاراً شهرياً لذلك يتراوح إجمالي الاستثمار في البرنامج عادةً بين 234 دولاراً و300 دولار اعتماداً على الوقت المستغرق لإكمال الدورة التدريبية
Advertisements
دعم فرص العمل
يحصل خريجو برنامج شهادة تصميم تجربة المستخدم
Google من
على إمكانية الوصول إلى مجموعة متنوعة من موارد العمل، وتشمل هذه المساعدة في بناء السيرة الذاتية وإرشادات إعداد المقابلة والوصول الحصري إلى لوحة الوظائف من خلال اتحاد
المهنية Google أصحاب العمل لشهادات
إذ يتألف هذا الاتحاد من العديد من أصحاب العمل المهتمين بتوظيف الأفراد الذين لديهم كفاءات تصميم تجربة المستخدم
يستمر الطلب على مصممي تجربة المستخدم في النمو مع وجود أكثر من 63000 وظيفة شاغرة في هذا المجال ومتوسط راتب للمبتدئين يبلغ 115000 دولار اعتباراً من عام 2025، وهذا يؤكد على العائد المحتمل على الاستثمار للأفراد الذين يكملون البرنامج بنجاح ويواصلون مهنة في تصميم تجربة المستخدم
تجارب الطلاب واعتباراتهم
تسلط ملاحظات المشاركين في البرنامج الضوء على العديد من نقاط القوة
Google في شهادة تصميم تجربة المستخدم من
المنهج الشامل: يقدر المتعلمون التغطية الشاملة لمفاهيم تجربة المستخدم الأساسية والتطبيقات العملية
المرونة: تسمح طبيعة البرنامج ذاتية التعلم للأفراد بموازنة دراستهم مع الالتزامات الأخرى
تطوير المحفظة: يتيح إدراج المشاريع الواقعية للمتعلمين بناء محفظة مهنية وهو أمر بالغ الأهمية لطلبات التوظيف
:ومع ذلك لاحظ بعض المتعلمين مجالات للتحسين
ملاحظات الأقران: في حين أن مراجعات الأقران هي جزء من عملية التعلم، فيشعر بعض الطلاب بالحاجة إلى إرشاد أكثر تنظيماً ونقداً مهنياً لتعزيز تجربة التعلم الخاصة بهم
دعم المهنة: على الرغم من توفير الموارد فإن نظام دعم المهنة الأكثر قوة وهيكلة يمكن أن يساعد الخريجين بشكل أكبر في الانتقال إلى القوى العاملة
:الخلاصة
في عام 2025 تقف شهادة تصميم
كمسار قيم Google تجربة المستخدم من
ويمكن الوصول إليه للأفراد الذين يطمحون إلى دخول مهنة تصميم تجربة المستخدم، فمنهجها الشامل وعمل المشروع العملي وتنسيقها المرن عبر الإنترنت يجعلها منافساً قوياً لأولئك الذين يسعون إلى تطوير مهارات جاهزة للوظيفة بطريقة فعالة من حيث التكلفة، إذ ينبغي على الطلاب المحتملين الأخذ بعين الاعتبار تفضيلات التعلم الشخصية وأهدافهم المهنية لتحديد ما إذا كان هذا البرنامج يتماشى مع تطلعاتهم المهنية
Artificial Intelligence (AI) has revolutionized the field of programming, and Python has emerged as the leading language for AI development due to its simplicity and extensive libraries. In this article, we will explore five AI projects of increasing sophistication, providing a detailed narrative explanation for each, followed by step-by-step implementation details, libraries, and code snippets.
1. Sentiment Analysis (Beginner Level)
Sentiment analysis is a Natural Language Processing (NLP) technique used to determine the sentiment expressed in text data. It categorizes a given text into positive, negative, or neutral sentiments. This project is useful for analyzing customer reviews, social media feedback, and other text-based inputs.
Implementation Steps:
Preprocess text by tokenizing and normalizing input.
Use NLP techniques to analyze text sentiment.
Classify sentiment based on polarity scores.
Optimize accuracy using a trained dataset.
Libraries Required:
nltk (Natural Language Toolkit)
textblob
Code Implementation:
2. Image Recognition (Intermediate Level)
Image recognition is a core AI application used in facial recognition, self-driving cars, and medical imaging. The project utilizes Convolutional Neural Networks (CNNs) to classify images based on trained datasets.
Implementation Steps:
Load an image dataset.
Normalize images for better training results.
Build a CNN model to process and classify images.
Train and evaluate the model.
Libraries Required:
tensorflow
keras
numpy
matplotlib
Code Implementation:
Advertisements
3. Chatbot (Intermediate Level)
A chatbot simulates human conversation using NLP. This project involves processing user queries and responding intelligently using pre-defined intents and a neural network-based text classifier.
Implementation Steps:
Define a dataset of user intents and responses.
Tokenize and preprocess text data.
Train a simple neural network to recognize user inputs.
Implement the chatbot to generate responses.
Libraries Required:
nltk
tensorflow
keras
json
pickle
Code Implementation:
4. Object Detection (Advanced Level)
Object detection is a crucial AI application used in security, surveillance, and autonomous vehicles. The YOLO (You Only Look Once) model is a popular choice for real-time object detection.
Stock price prediction leverages deep learning, particularly Long Short-Term Memory (LSTM) networks, to forecast future stock prices based on historical data.
Implementation Steps:
Collect and preprocess historical stock data.
Normalize the data for training.
Train an LSTM model on sequential data.
Make predictions and visualize results.
Libraries Required:
pandas
numpy
tensorflow
matplotlib
Code Implementation:
Conclusion
These five AI projects provide a solid foundation for AI development using Python. Beginners can start with sentiment analysis, while advanced users can explore object detection and stock price prediction. By implementing these projects step-by-step, you can gain hands-on experience with AI and deepen your understanding of machine learning techniques.
Advertisements
خمسة مشاريع ذكاء اصطناعي باستخدام بايثون: من المبتدئين إلى المتقدمين
Advertisements
لقد أحدث الذكاء الاصطناعي ثورة في مجال البرمجة وبرزت لغة بايثون كلغة رائدة لتطوير الذكاء الاصطناعي نظراً لبساطتها ومكتباتها الواسعة
في هذه المقالة سوف نستكشف خمسة مشاريع ذكاء اصطناعي تتسم بتعقيد متزايد ونقدم شرحاً سردياً مفصلاً لكل منها متبوعاً بتفاصيل التنفيذ خطوة بخطوة والمكتبات ومقاطع التعليمات البرمجية
1. تحليل المشاعر (مستوى المبتدئين)
(NLP) تحليل المشاعر هي تقنية معالجة اللغة الطبيعية
تُستخدم لتحديد المشاعر المعبر عنها في بيانات النص، وهي تصنف نصاً معيناً إلى مشاعر إيجابية أو سلبية أو محايدة، هذا المشروع مفيد لتحليل مراجعات العملاء وردود الفعل على وسائل التواصل الاجتماعي وغيرها من المدخلات المستندة إلى النص
:خطوات التنفيذ
معالجة النص مسبقاً عن طريق ترميز المدخلات وتطبيعها *
استخدام تقنيات معالجة اللغة الطبيعية لتحليل مشاعر النص *
تصنيف المشاعر بناءً على درجات الاستقطاب *
تحسين الدقة باستخدام مجموعة بيانات مدربة *
:المكتبات المطلوبة
(مجموعة أدوات اللغة الطبيعية) nltk *
textblob *
:تنفيذ التعليمات البرمجية
2. التعرف على الصور (المستوى المتوسط)
يعد التعرف على الصور أحد تطبيقات الذكاء الاصطناعي الأساسية المستخدمة في التعرف على الوجه والسيارات ذاتية القيادة والتصوير الطبي
(CNNs) يستخدم المشروع الشبكات العصبية
لتصنيف الصور بناءً على مجموعات البيانات المدربة
:خطوات التنفيذ
تحميل مجموعة بيانات الصور *
تطبيع الصور للحصول على نتائج تدريب أفضل *
لمعالجة الصور وتصنيفها CNN بناء نموذج *
تدريب النموذج وتقييمه *
:المكتبات المطلوبة
tensorflow, keras, numpy and matplotlib
Advertisements
3. Chatbot (مستوى متوسط)
المحادثة البشرية باستخدام معالجة اللغة الطبيعية Chatbot يحاكي
يتضمن هذا المشروع معالجة استعلامات المستخدم والاستجابة بذكاء باستخدام نوايا محددة مسبقاً ومصنف نصي قائم على الشبكة العصبية
:خطوات التنفيذ
تحديد مجموعة بيانات من نوايا المستخدم واستجاباته *
ترميز البيانات النصية ومعالجتها مسبقاً *
تدريب شبكة عصبية بسيطة للتعرف على مدخلات المستخدم *
لتوليد الاستجابات Chatbot تنفيذ *
:المكتبات المطلوبة
Nltk, tensorflow, keras, json and pickle
:تنفيذ الكود
4. اكتشاف الكائنات (المستوى المتقدم)
يعد اكتشاف الكائنات أحد تطبيقات الذكاء الاصطناعي المهمة المستخدمة في الأمن والمراقبة والمركبات ذاتية القيادة
YOLO (You Only Look Once) يعد نموذج
خياراً شائعاً لاكتشاف الكائنات في الوقت الفعلي
:خطوات التنفيذ
المدرب مسبقاً YOLO قم بتحميل نموذج *
قم بمعالجة الصور مسبقاً للنموذج *
قم بإجراء اكتشاف الكائنات وتصنيفها *
قم بعرض الكائنات المكتشفة على صورة *
:المكتبات المطلوبة
Opencv, numpy and tensorflow
:تنفيذ التعليمات البرمجية
5. التنبؤ بأسعار الأسهم باستخدام الذكاء الاصطناعي (المستوى المتقدم)
يستفيد التنبؤ بأسعار الأسهم من التعلم العميق
(LSTM) وخاصة شبكات الذاكرة طويلة المدى القصيرة
للتنبؤ بأسعار الأسهم المستقبلية استناداً إلى البيانات التاريخية
:خطوات التنفيذ
جمع ومعالجة بيانات الأسهم التاريخية مسبقاً *
تطبيع البيانات للتدريب *
على البيانات المتسلسلة LSTM تدريب نموذج *
إجراء التنبؤات وتصور النتائج *
:المكتبات المطلوبة
Pandas, numpy, tensorflow and matplotlib
:تنفيذ التعليمات البرمجية
:الخلاصة
توفر هذه المشاريع الخمسة للذكاء الاصطناعي أساساً قوياً لتطوير الذكاء الاصطناعي باستخدام بايثون، فيمكن للمبتدئين البدء بتحليل المشاعر بينما يمكن للمستخدمين المتقدمين استكشاف اكتشاف الكائنات والتنبؤ بأسعار الأسهم، فمن خلال تنفيذ هذه المشاريع خطوة بخطوة يمكنك اكتساب خبرة عملية في الذكاء الاصطناعي وتعميق فهمك لتقنيات التعلم الآلي
As technology evolves at an unprecedented pace, the job market adapts accordingly, creating new opportunities and redefining existing roles. The year 2025 is set to witness a surge in demand for tech professionals, with companies seeking candidates who possess cutting-edge skills to drive innovation and efficiency.
This essay explores the most in-demand tech jobs and skills for 2025, backed by real-world examples and key statistics.
Top In-Demand Tech Roles
1. Artificial Intelligence (AI) and Machine Learning (ML) Engineers
With AI transforming industries from healthcare to finance, AI and ML engineers are among the most sought-after professionals. According to a report by LinkedIn, AI-related job postings have increased by 74% year-over-year. Companies like Tesla and Google are heavily investing in AI, creating roles that require expertise in deep learning, natural language processing, and neural networks.
2. Cybersecurity Specialists
The rise in cyber threats has led to a growing need for cybersecurity experts. The global cybersecurity market is expected to reach $366 billion by 2028, as reported by Grand View Research. Organizations such as IBM and Microsoft are expanding their cybersecurity teams to combat increasingly sophisticated cyberattacks.
3. Cloud Computing Engineers
As businesses migrate to cloud platforms, cloud computing professionals are in high demand. Roles focusing on AWS, Azure, and Google Cloud certifications are particularly valuable. A recent Gartner study predicts that public cloud spending will surpass $600 billion in 2025, driving the need for cloud architects and engineers.
4. Data Scientists and Analysts
The ability to analyze and interpret large datasets remains a cornerstone of decision-making. The U.S. Bureau of Labor Statistics projects that data science roles will grow by 36% between 2021 and 2031, far outpacing the average for all occupations. Companies like Netflix leverage data science to enhance user experience and content recommendations.
5. Full-Stack Developers
The demand for web applications continues to rise, making full-stack developers indispensable. Startups and tech giants alike require engineers proficient in both front-end and back-end development, particularly those skilled in JavaScript, Python, and frameworks like React and Node.js.
Advertisements
Essential Tech Skills for 2025
1. AI and Machine Learning
Understanding AI algorithms, TensorFlow, and Python programming is crucial for engineers working on automation and predictive analytics.
2. Cybersecurity and Ethical Hacking
Proficiency in risk assessment, penetration testing, and cryptography will help professionals protect digital assets from evolving threats.
3. Cloud Computing
Skills in AWS, Microsoft Azure, and Google Cloud Platform (GCP) are essential for managing cloud-based infrastructure and services.
4. Data Analytics and SQL
The ability to extract insights from big data using tools like SQL, Power BI, and Tableau is a major asset across industries.
5. Software Development and DevOps
DevOps methodologies, containerization (Docker, Kubernetes), and agile development practices streamline software deployment and scalability.
Conclusion
The 2025 tech job market will be defined by advancements in AI, cybersecurity, cloud computing, and data science. Professionals who upskill in these areas will find themselves at the forefront of the industry, securing lucrative and fulfilling careers. With the right expertise and adaptability, tech talent will continue to shape the future of innovation and digital transformation.
Advertisements
الوظائف والمهارات التقنية الأكثر طلباً لعام 2025
Advertisements
مع تطور التكنولوجيا بوتيرة غير مسبوقة يتكيف سوق العمل وفقاً لذلك مما يخلق فرصاً جديدة ويعيد تعريف الأدوار الحالية، فمن المقرر أن يشهد عام 2025 زيادة في الطلب على المتخصصين في التكنولوجيا حيث تبحث الشركات عن مرشحين يمتلكون مهارات متطورة لدفع الابتكار والكفاءة
يستكشف هذا المقال الوظائف والمهارات التقنية الأكثر طلباً لعام 2025 مدعومة بأمثلة من العالم الحقيقي وإحصائيات رئيسية
أهم الأدوار التقنية المطلوبة
1. مهندسو الذكاء الاصطناعي والتعلم الآلي
مع تحول الذكاء الاصطناعي للصناعات من الرعاية الصحية إلى التمويل يعد مهندسو الذكاء الاصطناعي والتعلم الآلي من بين أكثر المهنيين طلباً
LinkedIn فوفقاً لتقرير صادر عن
زادت الوظائف المعلن عنها المتعلقة بالذكاء الاصطناعي بنسبة 74٪ على أساس سنوي
Tesla و Google إذ تستثمر شركات مثل
بشكل كبير في الذكاء الاصطناعي مما يخلق أدواراً تتطلب خبرة في التعلم العميق ومعالجة اللغة الطبيعية والشبكات العصبية
2. متخصصو الأمن السيبراني
أدى ارتفاع التهديدات السيبرانية إلى زيادة الحاجة إلى خبراء الأمن السيبراني ومن المتوقع أن يصل سوق الأمن السيبراني العالمي إلى 366 مليار دولار بحلول عام 2028
تعمل منظمات Grand View Research فوفقاً لتقرير
على توسيع فرق الأمن السيبراني الخاصة بها IBM وMicrosoft مثل
لمكافحة الهجمات السيبرانية المعقدة بشكل متزايد
3. مهندسو الحوسبة السحابية
مع انتقال الشركات إلى منصات السحابة يزداد الطلب على محترفي الحوسبة السحابية، إذ تعد الأدوار
ذات قيمة خاصة AWS وAzure وGoogle Cloud التي تركز على شهادات
أن يتجاوز الإنفاقGartner وتتوقع دراسة حديثة لشركة
على السحابة العامة 600 مليار دولار في عام 2025 مما يدفع الحاجة إلى خبراء ومهندسي السحابة
4. علماء البيانات والمحللون
تظل القدرة على تحليل وتفسير مجموعات البيانات الكبيرة حجر الزاوية في عملية اتخاذ القرار، إذ يتوقع مكتب إحصاءات العمل الأمريكي أن تنمو أدوار علوم البيانات بنسبة 36٪ بين عامي 2021 و 2031 وهو ما يتجاوز بكثير المتوسط لجميع المهن، بحيث تستفيد شركات مثل نيتفليكس من علم البيانات لتحسين تجربة المستخدم وتوصيات المحتوى
5. مطورو البرامج الكاملة
يستمر الطلب على تطبيقات الويب في الارتفاع مما يجعل مطوري البرامج الكاملة لا غنى عنهم، إذ تتطلب الشركات الناشئة وشركات التكنولوجيا العملاقة على حد سواء مهندسين مهرة في تطوير الواجهة الأمامية والخلفية وخاصة أولئك المهرة في بايثون وجافا سكريبت
Advertisements
المهارات التقنية الأساسية لعام 2025
1. الذكاء الاصطناعي والتعلم الآلي
TensorFlowيعد فهم خوارزميات الذكاء الاصطناعي و
وبرمجة بايثون أمراً بالغ الأهمية للمهندسين الذين يعملون في مجال الأتمتة والتحليلات التنبؤية
2. الأمن السيبراني والاختراق الأخلاقي
ستساعد الكفاءة في تقييم المخاطر واختبار الاختراق والتشفير المحترفين على حماية الأصول الرقمية من التهديدات المتطورة
3. الحوسبة السحابية
تعد المهارات في
AWS و Microsoft Azure و Google Cloud Platform (GCP)
ضرورية لإدارة البنية التحتية والخدمات المستندة إلى السحابة
4. SQLتحليلات البيانات و
إن القدرة على استخراج الأفكار من البيانات الضخمة
SQL و Power BI و Tableau باستخدام أدوات مثل
تعد من الأصول الرئيسية في مختلف الصناعات
5. DevOpsتطوير البرمجيات و
(Docker و Kubernetes) والحاويات DevOps إن منهجيات
وممارسات التطوير الرشيقة تعمل على تبسيط نشر البرمجيات وقابليتها للتوسع
الخلاصة
سيتم تحديد سوق العمل في مجال التكنولوجيا في عام 2025 من خلال التطورات في الذكاء الاصطناعي والأمن السيبراني والحوسبة السحابية وعلوم البيانات سيجد المحترفون الذين يطورون مهاراتهم في هذه المجالات أنفسهم في طليعة الصناعة مما يضمن لهم وظائف مربحة ومجزية، فمع الخبرة المناسبة والقدرة على التكيف ستستمر المواهب التكنولوجية في تشكيل مستقبل الابتكار والتحول الرقمي
Data science has become one of the most lucrative and in-demand career paths in the digital age. With the exponential growth of data and the increasing need for data-driven decision-making, professionals in this field have numerous income opportunities beyond traditional employment.
This essay explores some reliable sources of income that data scientists can leverage to maximize their earning potential.
1. Full-Time Employment :
One of the most stable sources of income for data scientists is full-time employment with companies across various industries, including finance, healthcare, technology, and retail. Many organizations seek skilled data scientists to analyze data, develop predictive models, and optimize business strategies. These roles often come with competitive salaries, benefits, and job security, making them an attractive option for professionals looking for a steady income.
2. Freelancing and Consulting :
Freelancing offers data scientists the flexibility to work with multiple clients on a project basis. Platforms such as Upwork, Fiverr, and Toptal provide opportunities to find clients who need data analysis, machine learning model development, and data visualization services. Additionally, experienced data scientists can establish themselves as consultants, advising businesses on data strategies and analytics solutions for a substantial fee.
3. Online Courses and Tutorials :
With the growing interest in data science, many professionals and students are looking to acquire skills in this field. Data scientists can create and sell online courses through platforms like Udemy, Coursera, or Teachable. They can also produce tutorials and instructional videos on YouTube, monetizing their content through ad revenue, sponsorships, and memberships.
Advertisements
4. Writing and Blogging :
Technical writing and blogging can be a lucrative source of income for data scientists. Many websites and tech publications pay for high-quality articles on data science, artificial intelligence, and machine learning. Platforms such as Medium, Towards Data Science, and Substack allow data scientists to monetize their writing through subscriptions and sponsorships.
5. Building and Selling Data Products :
Data scientists with programming expertise can develop and sell data-driven products, such as machine learning models, automation scripts, or analytics dashboards. These products can be sold on platforms like Gumroad, AWS Marketplace, or as software-as-a-service (SaaS) solutions. Developing proprietary algorithms and licensing them to businesses can also generate passive income.
6. Participating in Competitions :
Online platforms like Kaggle and DrivenData host data science competitions where participants solve real-world problems for cash prizes and recognition. Winning or ranking high in these competitions can not only provide financial rewards but also enhance a data scientist’s reputation, leading to better career opportunities and collaborations.
7. Speaking Engagements and Workshops :
Experienced data scientists can earn income by speaking at conferences, workshops, and corporate training events. Organizations often seek industry experts to provide insights on data science trends and applications. Conducting in-person or virtual workshops on data analytics and machine learning can also be a profitable venture.
Conclusion :
Data scientists have a wide array of income opportunities beyond traditional employment. By exploring freelancing, online education, writing, product development, competitions, and public speaking, professionals in this field can diversify their revenue streams and maximize their earning potential. The key to success lies in continuously improving skills, staying updated with industry trends, and strategically leveraging available platforms to monetize expertise.
Advertisements
بعض مصادر الدخل التي يمكن أن تعتمد عليها كعالم بيانات
Advertisements
أصبح علم البيانات أحد أكثر مسارات العمل المربحة والمطلوبة في العصر الرقمي، فمع النمو الهائل للبيانات والحاجة المتزايدة إلى اتخاذ القرارات القائمة على البيانات يتمتع المهنيون في هذا المجال بالعديد من فرص الدخل التي تتجاوز التوظيف التقليدي
يستكشف هذا المقال بعض مصادر الدخل الموثوقة التي يمكن لعلماء البيانات الاستفادة منها لزيادة إمكاناتهم في الكسب
1. العمل بدوام كامل:
يعد العمل بدوام كامل مع شركات في مختلف الصناعات بما في ذلك التمويل والرعاية الصحية والتكنولوجيا والتجزئة أحد أكثر مصادر الدخل استقراراً لعلماء البيانات، إذ تسعى العديد من المنظمات إلى توظيف علماء بيانات مهرة لتحليل البيانات وتطوير نماذج تنبؤية وتحسين استراتيجيات العمل، وغالباً ما تأتي هذه الأدوار برواتب ومزايا وأمان وظيفي تنافسي مما يجعلها خياراً جذاباً للمهنيين الذين يبحثون عن دخل ثابت
2. العمل الحر والاستشارات:
يوفر العمل الحر لعلماء البيانات المرونة للعمل مع عملاء متعددين على أساس المشروع
Upwork و Fiverr و Toptal وعليه توفر منصات مثل
فرصاً للعثور على العملاء الذين يحتاجون إلى تحليل البيانات وتطوير نماذج التعلم الآلي وخدمات تصور البيانات، بالإضافة إلى ذلك يمكن لعلماء البيانات ذوي الخبرة أن يثبتوا أنفسهم كمستشارين ويقدمون المشورة للشركات بشأن استراتيجيات البيانات وحلول التحليلات مقابل رسوم كبيرة
3. الدورات التعليمية عبر الإنترنت:
مع الاهتمام المتزايد بعلم البيانات يتطلع العديد من المهنيين والطلاب إلى اكتساب مهارات في هذا المجال، إذ يمكن لعلماء البيانات إنشاء وبيع الدورات عبر الإنترنت
Udemy أو Coursera أو Teachable من خلال منصات مثل
كما ويمكنهم أيضاً إنتاج دروس تعليمية ومقاطع فيديو إرشادية على يوتيوب وتحقيق الدخل من محتواهم من خلال عائدات الإعلانات والرعاية والعضويات
Advertisements
4. الكتابة والتدوين:
يمكن أن تكون الكتابة الفنية والتدوين مصدر دخل مربح لعلماء البيانات، بحيث تدفع العديد من المواقع الإلكترونية والمنشورات التقنية مقابل مقالات عالية الجودة حول علم البيانات والذكاء الاصطناعي والتعلم الآلي
Medium و Towards Data Science و Substack وعليه تسمح منصات مثل
لعلماء البيانات بتحقيق الدخل من كتاباتهم من خلال الاشتراكات والرعاية
5. بناء وبيع منتجات البيانات:
يمكن لعلماء البيانات ذوي الخبرة في البرمجة تطوير وبيع المنتجات التي تعتمد على البيانات مثل نماذج التعلم الآلي أو نصوص الأتمتة أو لوحات معلومات التحليلات، كما ويمكن بيع هذه المنتجات
Gumroad أو AWS Marketplace على منصات مثل
(SaaS) أو كحلول برمجية كخدمة
ولاسيما أن تطوير الخوارزميات الملكية وترخيصها للشركات أيضاً يؤدي إلى توليد دخل سلبي
6. المشاركة في المسابقات:
Kaggle و DrivenData تستضيف المنصات عبر الإنترنت مثل
مسابقات علوم البيانات حيث يحل المشاركون مشاكل العالم الحقيقي للحصول على جوائز نقدية، حيث أن التقدير أو الفوز أو الترتيب العالي في هذه المسابقات لا يمكن أن يوفر مكافآت مالية فحسب بل يعزز أيضاً سمعة عالم البيانات مما يؤدي إلى فرص عمل وتعاون أفضل
7. المشاركات وورش العمل:
يمكن لعلماء البيانات ذوي الخبرة كسب الدخل من خلال التحدث في المؤتمرات وورش العمل وفعاليات التدريب للشركات، فغالباً ما تسعى المنظمات إلى خبراء الصناعة لتقديم رؤى حول اتجاهات وتطبيقات علوم البيانات، ويمكن أن يكون إجراء ورش عمل شخصية أو افتراضية حول تحليلات البيانات والتعلم الآلي مشروعاً مربحاً أيضاً
:وفي الختام
يتمتع علماء البيانات بمجموعة واسعة من فرص الدخل تتجاوز التوظيف التقليدي، فمن خلال استكشاف العمل الحر والتعليم عبر الإنترنت والكتابة وتطوير المنتجات والمسابقات والتحدث أمام الجمهور يمكن للمحترفين في هذا المجال تنويع مصادر دخلهم وتعظيم إمكاناتهم في الكسب، إذ يكمن مفتاح النجاح في تحسين المهارات باستمرار والبقاء على اطلاع بأحدث اتجاهات الصناعة والاستفادة الاستراتيجية من المنصات المتاحة لتحقيق الدخل من الخبرة
In Meta’s data science and data engineering interviews, candidates often encounter complex SQL questions that assess their ability to handle real-world data scenarios. One such challenging question is:
Question: Average Post Hiatus
Given a table of Facebook posts, for each user who posted at least twice in 2024, write a SQL query to find the number of days between each user’s first post of the year and last post of the year in 2024. Output the user and the number of days between each user’s first and last post.
Table Schema:
posts
user_id (INTEGER): ID of the user who made the post
post_id (INTEGER): Unique ID of the post
post_date (DATE): Date when the post was made
Approach:
Filter Posts from 2024:
Select posts where the post_date falls within the year 2024.
Identify First and Last Post Dates:
For each user, determine the minimum (first_post_date) and maximum (last_post_date) post dates in 2024.
Calculate the Difference in Days:
Compute the difference in days between last_post_date and first_post_date for each user.
Filter Users with At Least Two Posts:
Ensure that only users who have posted more than once are considered.
SQL Solution:
Advertisements
Explanation:
Common Table Expression (CTE):user_posts_2024 filters posts from 2024 and groups them by user_id. It calculates the first and last post dates and counts the total posts per user.
Main Query: Selects users with more than one post and computes the difference in days between their first and last posts using the DATEDIFF function.
Key Considerations:
Date Functions: The DATEDIFF function calculates the difference between two dates. Note that the syntax may vary depending on the SQL dialect. For instance, in some systems, the order of parameters in DATEDIFF might be reversed.
Filtering by Date: Ensure the date filter accurately captures the entire year of 2024.
Handling Users with Single Posts: By counting posts per user and filtering out those with only one post (post_count > 1), we ensure that only users with multiple posts are considered.
Personal Experience:
In my experience preparing for SQL interviews at major tech companies, including Meta, it’s crucial to practice a variety of SQL problems that test different aspects of data manipulation and analysis. Resources like DataLemur offer curated questions that mirror the complexity and style of actual interview scenarios.
Additionally, engaging in mock interviews and solving problems from platforms like StrataScratch can provide practical experience and enhance problem-solving skills.
By systematically practicing such problems and understanding the underlying concepts, candidates can develop the proficiency needed to excel in SQL interviews at Meta and similar companies.
Advertisements
SQLالتعامل الأمثل مع سؤال (المستوى الصعب) في مقابلة
Advertisements
في مقابلات علوم البيانات وهندسة البيانات في ميتا غالباً ما يواجه المرشحون
معقدة تقيم قدرتهم على التعامل SQL أسئلة
مع سيناريوهات البيانات في العالم الحقيقي
:أحد هذه الأسئلة الصعبة هو
متوسط فترة التوقف عن النشر
بالنظر إلى جدول منشورات فيسبوك لكل مستخدم نشر مرتين على الأقل في عام 2024
SQL اكتب استعلام
للعثور على عدد الأيام بين أول منشور لكل مستخدم في العام وآخر منشور في العام في عام 2024
قم بإخراج المستخدم وعدد الأيام بين أول منشور وآخر منشور لكل مستخدم
:مخطط الجدول
posts
معرف المستخدم الذي نشر المنشور :user_id (INTEGER)
معرف فريد للمنشور :post_id (INTEGER)
التاريخ الذي تم فيه نشر المنشور :post_date (DATE)
:النهج
تصفية المنشورات من عام 2024 *
حدد المنشورات التي يقع تاريخ النشر فيها ضمن عام 2024
حدد تاريخي أول وآخر منشور *
(first_post_date) بالنسبة لكل مستخدم، حدد تاريخي النشر الأدنى
في عام 2024 (last_post_date) والأقصى
: احسب الفرق بالأيام *
last_post_date احسب الفرق بالأيام بين
لكل مستخدم first_post_date و
:تصفية المستخدمين الذين لديهم منشوران على الأقل *
تأكد من مراعاة المستخدمين الذين نشروا أكثر من مرة فقط
: SQL حل
Advertisements
:توضيح
(CTE) تعبير الجدول الشائع
بتصفية المنشورات من عام 2024 user_posts_2024 يقوم
user_id وتجميعها حسب
يحسب تاريخ أول وآخر منشور ويحسب إجمالي المنشورات لكل مستخدم
الاستعلام الرئيسي: يحدد المستخدمين الذين لديهم أكثر من منشور ويحسب الفرق بالأيام بين منشوراتهم الأولى والأخيرة
DATEDIFF باستخدام دالة
:الاعتبارات الرئيسية
الفرق بين تاريخين DATEDIFF وظائف التاريخ: تحسب الدالة
SQL لاحظ أن بناء الجملة قد يختلف حسب لهجة
على سبيل المثال في بعض الأنظمة
معكوساً DATEDIFF قد يكون ترتيب المعلمات في
التصفية حسب التاريخ : تأكد من أن مرشح التاريخ يلتقط بدقة عام 2024 بالكامل
التعامل مع المستخدمين الذين لديهم منشورات فردية: من خلال حساب المنشورات لكل مستخدم وتصفية تلك التي
(post_count > 1) تحتوي على منشور واحد فقط
نضمن مراعاة المستخدمين الذين لديهم منشورات متعددة فقط
:الخبرة الشخصية
SQL في تجربتي في التحضير لمقابلات
في شركات التكنولوجيا الكبرى
Meta بما في ذلك
SQL من الأهمية بمكان ممارسة مجموعة متنوعة من مشكلات
التي تختبر جوانب مختلفة من معالجة البيانات وتحليلها
By 2025, data science and artificial intelligence (AI) continue to evolve, influencing various sectors and reshaping our daily lives. Here are ten key predictions for the landscape of data science and AI in 2025, supported by current statistics and trends:
1. Surge in AI-Driven Personalization
AI algorithms are enabling brands to offer unprecedented levels of personalization. In 2024, 70% of consumers noted a clear distinction between companies effectively leveraging AI in customer service and those that are not. This trend is expected to intensify, with AI delivering tailored experiences across shopping, entertainment, and healthcare.
As AI systems become integral to decision-making, the demand for transparency has surged. In 2024, 94% of data and AI leaders reported an increased focus on data due to AI interest, underscoring the need for explainable AI to build trust and ensure ethical use.
With rising data breaches and privacy concerns, there’s a shift towards privacy-preserving technologies. By 2025, it’s anticipated that 40% of large organizations will implement privacy-enhancing computation techniques in analytics, balancing innovation with security.
AI is moving beyond routine tasks to automate complex processes in industries like law, finance, and healthcare. For instance, automating middle-office tasks with AI can save North American banks $70 billion by 2025.
Governments and organizations are establishing robust AI ethics guidelines and regulatory frameworks. In 2024, 49% of technology leaders reported that AI was fully integrated into their companies’ core business strategy, highlighting the need for ethical oversight.
The fusion of quantum computing and AI is expected to revolutionize areas like drug discovery and cryptography. By 2025, major tech companies are projected to invest significantly in quantum AI research, aiming to achieve breakthroughs in data processing speeds and capabilities.
AI processing is increasingly occurring on devices rather than centralized servers. This shift enhances real-time data processing, reduces latency, and improves data security. The global edge AI software market is projected to reach $3.15 billion by 2025, reflecting this trend.
AI systems capable of understanding and integrating data from multiple sources are becoming standard. In 2024, 83% of Chief Data Officers and data leaders prioritized generative AI, indicating a move towards more advanced, multimodal applications.
AI is playing a pivotal role in addressing climate change by optimizing energy consumption and promoting sustainable practices. By 2025, AI-driven solutions are expected to reduce global greenhouse gas emissions by 4%, equivalent to 2.4 gigatons of CO2.
User-friendly AI tools are empowering individuals without technical backgrounds. In 2024, 67% of top-performing companies benefited from generative AI-based product and service innovation, reflecting a broader trend towards accessible AI solutions.
In conclusion, 2025 is shaping up to be a transformative year for data science and AI, with advancements poised to enhance personalization, transparency, and efficiency across various sectors. Staying informed and adaptable will be crucial for individuals and organizations aiming to thrive in this dynamic landscape.
Advertisements
عشرة تنبؤات رئيسية في علم البيانات والذكاء الاصطناعي في عام 2025
Advertisements
مع حلول عام 2025 يستمر علم البيانات والذكاء الاصطناعي في التطور مما يؤثر على قطاعات مختلفة ويعيد تشكيل حياتنا اليومية
:فيما يلي عشرة تنبؤات رئيسية لمشهد علم البيانات والذكاء الاصطناعي في عام 2025 مدعومة بالإحصائيات والاتجاهات الحالية
1. زيادة التخصيص المعتمد على الذكاء الاصطناعي
تمكن خوارزميات الذكاء الاصطناعي العلامات التجارية من تقديم مستويات غير مسبوقة من التخصيص، ففي عام 2024 لاحظ 70% من المستهلكين تمييزاً واضحاً بين الشركات التي تستفيد بشكل فعال من الذكاء الاصطناعي في خدمة العملاء وتلك التي لا تفعل ذلك، ومن المتوقع أن يشتد هذا الاتجاه مع تقديم الذكاء الاصطناعي لتجارب مخصصة عبر التسوق والترفيه والرعاية الصحية
2. التركيز على الذكاء الاصطناعي القابل للتفسير
مع تزايد أهمية أنظمة الذكاء الاصطناعي في عملية صنع القرار ارتفع الطلب على الشفافية، ففي عام 2024 أفاد 94% من قادة البيانات والذكاء الاصطناعي بزيادة التركيز على البيانات بسبب الاهتمام بالذكاء الاصطناعي مما يؤكد الحاجة إلى الذكاء الاصطناعي القابل للتفسير لبناء الثقة وضمان الاستخدام الأخلاقي
3. إعطاء الأولوية لخصوصية البيانات
مع تزايد خروقات البيانات ومخاوف الخصوصية هناك تحول نحو تقنيات الحفاظ على الخصوصية، فبحلول عام 2025 من المتوقع أن تنفذ 40% من المؤسسات الكبيرة تقنيات الحوسبة المعززة للخصوصية في التحليلات وموازنة الابتكار بالأمان
4. توسيع الأتمتة التي يقودها الذكاء الاصطناعي
يتجاوز الذكاء الاصطناعي المهام الروتينية لأتمتة العمليات المعقدة في الصناعات مثل القانون والتمويل والرعاية الصحية، فعلى سبيل المثال يمكن أن يوفر أتمتة مهام المكتب الأوسط باستخدام الذكاء الاصطناعي للبنوك في أمريكا الشمالية 70 مليار دولار بحلول عام 2025
5. نمو أخلاقيات الذكاء الاصطناعي والتنظيم
تضع الحكومات والمنظمات إرشادات أخلاقية قوية وأطر تنظيمية للذكاء الاصطناعي، ففي عام 2024 أفاد 49% من قادة التكنولوجيا أن الذكاء الاصطناعي تم دمجه بالكامل في استراتيجية الأعمال الأساسية لشركاتهم مما يسلط الضوء على الحاجة إلى الرقابة الأخلاقية
Advertisements
6. دمج الحوسبة الكمومية مع الذكاء الاصطناعي
من المتوقع أن يؤدي اندماج الحوسبة الكمومية والذكاء الاصطناعي إلى إحداث ثورة في مجالات مثل اكتشاف الأدوية والتشفير، فبحلول عام 2025 من المتوقع أن تستثمر شركات التكنولوجيا الكبرى بشكل كبير في أبحاث الذكاء الاصطناعي الكمي بهدف تحقيق اختراقات في سرعات وقدرات معالجة البيانات
7. زخم الذكاء الاصطناعي الحافة
تتم معالجة الذكاء الاصطناعي بشكل متزايد على الأجهزة بدلاً من الخوادم المركزية مما يعزز معالجة البيانات في الوقت الفعلي ويقلل من زمن الوصول ويحسن أمان البيانات، ومن المتوقع أن يصل سوق برمجيات الذكاء الاصطناعي الحافة العالمي إلى 3.15 مليار دولار بحلول عام 2025 مما يعكس هذا الاتجاه
8. التبني السائد للذكاء الاصطناعي المتعدد الوسائط
أصبحت أنظمة الذكاء الاصطناعي القادرة على فهم ودمج البيانات من مصادر متعددة معيارية، ففي عام 2024 أعطى 83% من كبار مسؤولي البيانات وقادة البيانات الأولوية للذكاء الاصطناعي التوليدي مما يشير إلى التحرك نحو تطبيقات متعددة الوسائط وأكثر تقدماً
9. الذكاء الاصطناعي من أجل الاستدامة البيئية
يلعب الذكاء الاصطناعي دوراً محورياً في معالجة تغير المناخ من خلال تحسين استهلاك الطاقة وتعزيز الممارسات المستدامة، فبحلول عام 2025 من المتوقع أن تعمل الحلول القائمة على الذكاء الاصطناعي على تقليل انبعاثات الغازات المسببة للانحباس الحراري العالمي بنسبة 4% أي ما يعادل 2.4 جيجا طن من ثاني أكسيد الكربون
10. ديمقراطية الذكاء الاصطناعي وعلوم البيانات
تعمل أدوات الذكاء الاصطناعي سهلة الاستخدام على تمكين الأفراد الذين ليس لديهم خلفيات تقنية، ففي عام 2024 استفادت 67% من الشركات ذات الأداء الأفضل من ابتكار المنتجات والخدمات القائمة على الذكاء الاصطناعي التوليدي مما يعكس اتجاهاً أوسع نحو حلول الذكاء الاصطناعي التي يمكن الوصول إليها
In the fast-paced world of technology, data science has emerged as one of the most transformative fields, influencing industries across the globe. Mastering data science requires years of learning and experience, yet we will attempt to distill years of expertise into just few minutes.
This essay highlights the fundamental pillars of data science, its essential tools, and key applications, providing a concise yet comprehensive understanding of this dynamic domain.
1. Foundations of Data Science
Data science is an interdisciplinary field that combines statistics, programming, and domain expertise to extract meaningful insights from data. The journey begins with understanding mathematics, particularly statistics and linear algebra, which form the backbone of data analysis. Probability, hypothesis testing, regression models, and clustering techniques are crucial in interpreting data trends.
Programming is another cornerstone of data science, with Python and R being the most widely used languages. Libraries such as NumPy, Pandas, Matplotlib, and Scikit-learn in Python facilitate efficient data manipulation, visualization, and machine learning model implementation.
2. Data Collection and Preprocessing
Raw data is rarely perfect. Data scientists spend a significant portion of their time cleaning, preprocessing, and transforming data. Techniques such as handling missing values, removing duplicates, encoding categorical variables, and normalizing data ensure accuracy and reliability. SQL plays a vital role in querying databases, while tools like Apache Spark handle big data efficiently.
3. Exploratory Data Analysis (EDA)
Before diving into modeling, understanding the dataset is crucial. Exploratory Data Analysis (EDA) involves summarizing main characteristics through statistical summaries, visualizations, and pattern detection. Libraries such as Seaborn and Plotly assist in generating insightful graphs that reveal correlations and anomalies within the data.
Advertisements
4. Machine Learning and Model Building
Machine learning is the heart of data science. It can be broadly classified into:
Supervised Learning: Algorithms like linear regression, decision trees, random forests, and neural networks make predictions based on labeled data.
Unsupervised Learning: Techniques such as k-means clustering and principal component analysis (PCA) help uncover hidden patterns in unlabeled data.
Reinforcement Learning: Used in robotics and gaming, this technique allows models to learn optimal strategies through rewards and penalties.
Deep learning, powered by neural networks and frameworks like TensorFlow and PyTorch, has revolutionized fields such as image recognition and natural language processing (NLP).
5. Model Evaluation and Optimization
Building a model is not enough; assessing its performance is crucial. Metrics such as accuracy, precision, recall, and F1-score help evaluate classification models, while RMSE and R-squared measure regression models. Techniques like cross-validation, hyperparameter tuning, and ensemble methods improve model robustness and accuracy.
6. Deployment and Real-World Applications
Once a model is optimized, deploying it for real-world use is the next step. Cloud platforms such as AWS, Google Cloud, and Azure provide scalable solutions. Deployment tools like Flask and FastAPI allow integration with applications. Monitoring and updating models ensure continued performance over time.
7. Future Trends in Data Science
Data science continues to evolve with advancements in AI, automation, and ethical considerations. Explainable AI (XAI), AutoML, and federated learning are reshaping the field. Understanding the ethical implications of AI, including bias mitigation and data privacy, is becoming increasingly important.
Conclusion
years of data science encompasses vast knowledge, yet at its core, it is about transforming raw data into actionable insights. Mastering the fundamentals, staying updated with emerging technologies, and continuously experimenting are key to success in this field. Whether you are a beginner or an experienced practitioner, the journey of data science is one of constant learning and innovation.
Advertisements
هل يمكننا تلخيص سنوات من الخبرة في علم البيانات في بضع دقائق فقط؟
Advertisements
في عالم التكنولوجيا المتسارع برز علم البيانات كواحد من أكثر المجالات تحولاً حيث يؤثر على الصناعات في جميع أنحاء العالم، فيتطلب إتقان علم البيانات سنوات من التعلم والخبرة ومع ذلك سنحاول تلخيص عدة سنوات من الخبرة في دقائق فقط
تسلط هذه المقالة الضوء على الركائز الأساسية لعلم البيانات وأدواته الأساسية وتطبيقاته الرئيسية مما يوفر فهماً موجزاً وشاملاً لهذا المجال الديناميكي
1.أسس علم البيانات
علم البيانات هو مجال متعدد التخصصات يجمع بين الإحصاء والبرمجة والخبرة في المجال لاستخراج رؤى ذات مغزى من البيانات، فتبدأ الرحلة بفهم الرياضيات وخاصة الإحصاء والجبر الخطي والتي تشكل العمود الفقري لتحليل البيانات، وتعد الاحتمالات واختبار الفرضيات ونماذج الانحدار وتقنيات التجميع أمراً بالغ الأهمية في تفسير اتجاهات البيانات البرمجة هي حجر الزاوية الآخر لعلم البيانات
أكثر اللغات استخداماً R حيث تعد لغة بايثون ولغة
وبالتالي تسهل المكتبات
في بايثون Scikit-learn و Matplotlib و Pandas و NumPy :مثل
معالجة البيانات بكفاءة وتصورها وتنفيذ نموذج التعلم الآلي
2. جمع البيانات ومعالجتها مسبقاً
نادراً ما تكون البيانات الخام مثالية، إذ يقضي علماء البيانات جزءاً كبيراً من وقتهم في تنظيف البيانات ومعالجتها مسبقاً وتحويلها، وتضمن التقنيات مثل التعامل مع القيم المفقودة وإزالة التكرارات وترميز المتغيرات التصنيفية وتطبيع البيانات الدقة والموثوقية
دوراً حيوياً في استعلام قواعد البيانات بينما تتعامل أدوات SQL وتلعب
مع البيانات الضخمة بكفاءة Apache Spark مثل
3. (EDA)تحليل البيانات الاستكشافي
قبل الخوض في النمذجة يعد فهم مجموعة البيانات أمراً بالغ الأهمية، إذ يتضمن تحليل البيانات الاستكشافي تلخيص الخصائص الرئيسية من خلال الملخصات الإحصائية والتصورات واكتشاف الأنماط
Plotly و Seaborn :وتساعد المكتبات مثل
في إنشاء رسوم بيانية ثاقبة تكشف عن الارتباطات والشذوذ داخل البيانات
Advertisements
4.التعلم الآلي وبناء النماذج
:يعتبر التعلم الآلي جوهر علم البيانات ويمكن تصنيفه على نطاق واسع إلى
التعلم الخاضع للإشراف: تقوم الخوارزميات مثل الانحدار الخطي وأشجار القرار والغابات العشوائية والشبكات العصبية بإجراء تنبؤات بناءً على بيانات مصنفة
التعلم غير الخاضع للإشراف: تساعد تقنيات مثل التجميع
(PCA) وتحليل المكونات الأساسية k باستخدام متوسطات
في الكشف عن الأنماط المخفية في البيانات غير المصنفة
التعلم التعزيزي: يستخدم هذا الأسلوب في الروبوتات والألعاب ويسمح للنماذج بتعلم الاستراتيجيات المثلى من خلال المكافآت والعقوبات
NLP ثورة في مجالات مثل التعرف على الصور ومعالجة اللغة الطبيعية
5. تقييم النموذج وتحسينه
إن بناء النموذج ليس كافياً فتقييم أدائه أمر بالغ الأهمية، فتساعد المقاييس
F1 مثل الدقة والدقة والتذكر ودرجة
R-squared و RMSE في تقييم نماذج التصنيف بينما تقيس
نماذج الانحدار، وتعمل التقنيات مثل التحقق المتبادل وضبط المعلمات الفائقة وطرق المجموعة على تحسين قوة النموذج ودقته
6. النشر والتطبيقات في العالم الحقيقي
بمجرد تحسين النموذج فإن نشره للاستخدام في العالم الحقيقي هو الخطوة التالية، إذ توفر منصات السحابة
AWS و Google Cloud و Azure :مثل
حلولاً قابلة للتطوير، وبالتالي تسمح أدوات النشر
Flask و FastAPI :مثل
بالتكامل مع التطبيقات فتضمن مراقبة وتحديث النماذج الأداء المستمر بمرور الوقت
7. الاتجاهات المستقبلية في علم البيانات
يستمر علم البيانات في التطور مع التقدم في الذكاء الاصطناعي والأتمتة والاعتبارات الأخلاقية
AutoMLو (XAI) بحيث يعيد الذكاء الاصطناعي القابل للتفسير
والتعلم الفيدرالي تشكيل المجال، وعليه أصبح فهم الآثار الأخلاقية للذكاء الاصطناعي بما في ذلك التخفيف من التحيز وخصوصية البيانات مهماً بشكل متزايد
الخلاصة
عدة سنوات من علم البيانات تشمل معرفة واسعة ولكن في جوهرها يتعلق الأمر بتحويل البيانات الخام إلى رؤى قابلة للتنفيذ، وبالتالي فإن إتقان الأساسيات ومواكبة التقنيات الحديثة والتجريب المستمر هي مفتاح النجاح في هذا المجال، سواء كنت مبتدئاً أو ممارساً متمرساً فإن رحلة علم البيانات هي رحلة تعلم وابتكار مستمرين
In the fast-evolving world of data analytics, staying ahead requires a combination of technical expertise, adaptability, and strategic foresight. As businesses increasingly rely on data-driven decision-making, the role of a data analyst has become pivotal. Here are some key strategies to ensure continued growth and success in this dynamic field.
1. Master Core Technical Skills
The foundation of a successful data analyst lies in their technical proficiency. Core skills such as data manipulation, visualization, and statistical analysis are non-negotiable. Proficiency in tools like Python, R, SQL, and Excel is essential. Furthermore, familiarity with data visualization platforms such as Tableau, Power BI, or Looker can make your insights more impactful and accessible to stakeholders.
To stay ahead, dedicate time to learning emerging technologies and tools. For example, cloud platforms like AWS, Azure, and Google Cloud are becoming increasingly relevant for handling large-scale data. Additionally, understanding machine learning fundamentals and algorithms can provide a competitive edge.
2. Adopt a Growth Mindset
The data analytics landscape is constantly changing, with new tools, frameworks, and methodologies emerging regularly. A growth mindset—characterized by curiosity and a willingness to learn—is crucial for staying relevant. Attend workshops, webinars, and industry conferences to keep abreast of the latest trends and best practices.
Online learning platforms such as Coursera, Udemy, and LinkedIn Learning offer specialized courses on topics like advanced data analytics, AI, and big data. Subscribing to industry blogs, podcasts, and newsletters can also help you stay informed about new developments and opportunities.
3. Focus on Business Acumen
Technical expertise is only one part of the equation. Data analysts must also understand the business context of their work. Familiarize yourself with your company’s industry, goals, and challenges. This knowledge enables you to frame your analysis in a way that directly addresses organizational needs and drives value.
Collaborate with stakeholders to understand their pain points and decision-making processes. By aligning your insights with business objectives, you can position yourself as a strategic partner rather than just a technical resource.
4. Hone Communication Skills
The ability to communicate complex data insights clearly and effectively is a hallmark of a great data analyst. Strong communication skills—both written and verbal—are essential for presenting findings to non-technical audiences.
Practice creating concise reports, compelling dashboards, and impactful presentations. Storytelling with data is a valuable skill that helps convey the significance of your analysis. Use visualizations to make data more digestible and actionable for decision-makers.
Advertisements
5. Build a Strong Professional Network
Networking with other professionals in the field can provide valuable insights, mentorship, and career opportunities. Join online forums, social media groups, and professional organizations such as the International Institute for Analytics (IIA) or the Data Science Association.
Participating in hackathons, meetups, and local events can also expand your network. Engaging with others in the analytics community allows you to exchange ideas, stay inspired, and learn from peers’ experiences.
6. Embrace Automation and Efficiency
In a field where time is of the essence, automating repetitive tasks can significantly boost productivity. Learn to use scripting and automation tools like Python libraries (e.g., Pandas and NumPy) or workflow management platforms such as Apache Airflow.
Additionally, staying informed about advancements in AI and machine learning can help you leverage automation for more sophisticated tasks, such as predictive modeling and anomaly detection.
7. Prioritize Ethical Data Practices
As the volume and importance of data grow, so does the responsibility to handle it ethically. Familiarize yourself with data privacy regulations like GDPR and CCPA, and ensure compliance in your work. Ethical data practices build trust with stakeholders and safeguard your organization from legal risks.
Consider taking courses or earning certifications in data ethics and governance to demonstrate your commitment to responsible analytics.
8. Track and Measure Your Progress
Finally, continually evaluate your own growth and performance. Set clear goals, whether it’s mastering a new tool, completing a certification, or improving your presentation skills. Regularly review your achievements and identify areas for improvement.
Solicit feedback from colleagues and supervisors to gain insights into how you can enhance your contributions. By tracking your progress, you can stay motivated and focused on long-term career growth.
Conclusion
The role of a data analyst is both challenging and rewarding. By mastering technical skills, cultivating a growth mindset, and aligning your work with business objectives, you can stay ahead in this competitive field. Communication, networking, and ethical practices further enhance your value as a data professional. Ultimately, a commitment to continuous learning and self-improvement will ensure your success as a data analyst in the ever-changing world of data analytics.
Advertisements
بعض الاستراتيجيات الرئيسية لضمان النجاح والنمو المستمر في علم البيانات
Advertisements
في عالم تحليل البيانات سريع التطور يتطلب البقاء متقدماً مزيجاً من الخبرة الفنية والقدرة على التكيف الاستراتيجي، ومع اعتماد الشركات بشكل متزايد على اتخاذ القرارات القائمة على البيانات أصبح دور محلل البيانات محورياً
فيما يلي بعض الاستراتيجيات الرئيسية لضمان بقائك في المقدمة في هذا المجال الديناميكي
1. إتقان المهارات الفنية الأساسية
يعتمد أساس محلل البيانات الناجح على كفاءته الفنية، فالمهارات الأساسية مثل معالجة البيانات والتصور والتحليل الإحصائي غير قابلة للجدل
أمراً ضرورياً Excel و SQL و Python إذ تعد الكفاءة في أدوات مثل
وعلاوة على ذلك فإن الإلمام بمنصات تصور البيانات
Looker أو Power BI أو Tableau مثل
يمكن أن يجعل رؤيتك أكثر تأثيراً ويمكن الوصول إليها من قبل أصحاب العمل
للبقاء متقدماً خصص وقتاً لتعلم التقنيات والأدوات الحديثة، فعلى سبيل المثال أصبحت منصات السحابة
Google Cloud و AWS مثل
ذات صلة متزايدة بالتعامل مع البيانات واسعة النطاق، بالإضافة إلى ذلك فإن فهم أساسيات التعلم الآلي والخوارزميات يمكن أن يوفر لك ميزة تنافسية
2. تبنّي عقلية النمو
يتغير مشهد تحليلات البيانات باستمرار مع ظهور أدوات وأطر ومنهجيات جديدة بانتظام، إذ تعد عقلية النمو – التي تتميز بالفضول والرغبة في التعلم – أمراً بالغ الأهمية للبقاء على صلة، لذا احرص على حضور ورش العمل والندوات عبر الإنترنت ومؤتمرات الصناعة لمواكبة أحدث الاتجاهات وأفضل الممارسات تقدم منصات التعلم عبر الإنترنت
LinkedIn Learning و Udemy و Coursera مثل
دورات متخصصة حول مواضيع مثل تحليلات البيانات المتقدمة والذكاء الاصطناعي والبيانات الضخمة، بحيث يمكن أن يساعدك الاشتراك في مدونات الصناعة والبودكاست والنشرات الإخبارية أيضاً في البقاء على اطلاع بالتطورات والفرص الجديدة
3. التركيز على الفطنة التجارية
الخبرة الفنية ليست سوى جزء واحد من المعادلة، إذ يجب على محللي البيانات أيضاً فهم السياق التجاري لعملهم، لذا تعرف على صناعة شركتك وأهدافها وتحدياتها، إذ تمكنك هذه المعرفة من صياغة تحليلك بطريقة تعالج بشكل مباشر احتياجات المنظمة وتساهم في دفع عجلة تطورها إلى الأمام
تعاون مع أصحاب المصلحة لفهم نقاط ضعفهم وعمليات صنع القرار، فمن خلال مواءمة رؤاك مع أهداف العمل يمكنك وضع نفسك كشريك استراتيجي بدلاً من مجرد مورد فني
4. صقل مهارات الاتصال
القدرة على توصيل رؤى البيانات المعقدة بوضوح وفعالية هي السمة المميزة لمحلل البيانات العظيم، فمهارات الاتصال القوية – سواء المكتوبة أو اللفظية – ضرورية لتقديم النتائج للجمهور غير الفني
تدرب على إنشاء تقارير موجزة ولوحات معلومات مقنعة وعروض تقديمية مؤثرة، إذ يعد سرد القصص بالبيانات مهارة قيمة تساعد في نقل أهمية تحليلك، واستخدم التصورات لجعل البيانات أكثر قابلية للهضم وقابلية للتنفيذ لصناع القرار
Advertisements
5. بناء شبكة مهنية قوية
يمكن أن يوفر التواصل مع المهنيين الآخرين في هذا المجال رؤى قيمة وإرشاداً وفرصاً وظيفية، لذا احرص دائماً إلى الانضمام إلى المنتديات عبر الإنترنت ومجموعات وسائل التواصل الاجتماعي والمنظمات المهنية
أو جمعية علوم البيانات (IIA) مثل المعهد الدولي للتحليلات
المشاركة في اللقاءات والأحداث المحلية يمكن أن توسع شبكتك أيضاً، إذ يتيح لك التواصل مع الآخرين في مجتمع التحليلات تبادل الأفكار والبقاء مستوحى والتعلم من تجارب الأقران
6. تبني الأتمتة والكفاءة
اعلم دائماً أن الوقت هو جوهر الأمر، ومن هذا المنطق يمكن أن يؤدي أتمتة المهام المتكررة إلى تعزيز الإنتاجية بشكل كبير، لذا تعلم كيفية استخدام أدوات البرمجة النصية والأتمتة مثل مكتبات بايثون
Apache Airflow أو منصات إدارة سير العمل مثل
بالإضافة إلى ذلك فإن البقاء على اطلاع بالتطورات في الذكاء الاصطناعي والتعلم الآلي يمكن أن يساعدك في الاستفادة من الأتمتة للمهام الأكثر تعقيداً مثل النمذجة التنبؤية واكتشاف الشذوذ
7. إعطاء الأولوية لممارسات البيانات الأخلاقية
مع نمو حجم وأهمية البيانات تزداد أيضاً مسؤولية التعامل معها بشكل أخلاقي، لذا تعرف على لوائح خصوصية البيانات
وتأكد من الالتزام في عملك CCPA و GDPR مثل
فممارسات البيانات الأخلاقية تبني الثقة مع أصحاب المصلحة وتحمي مؤسستك من المخاطر القانونية
فكر في أخذ دورات أو الحصول على شهادات في أخلاقيات البيانات والحوكمة لإثبات التزامك بالتحليلات المسؤولة
8. متابعة وتقييم أدائك وتقدمك
أخيراً.. قم بتقييم نموك وأدائك باستمرار وذلك عن طريق تحديد أهداف واضحة، سواء كانت إتقان أداة جديدة أو إكمال شهادة أو تحسين مهارات العرض التقديمي، لذا راجع إنجازاتك بانتظام وحدد مجالات التحسين
اطلب ملاحظات من الزملاء والمشرفين للحصول على رؤى حول كيفية تحسين مساهماتك، فمن خلال تتبع تقدمك يمكنك البقاء متحفزاً ومركزاً على النمو الوظيفي على المدى الطويل
الخلاصة
دور محلل البيانات هو أمر صعب ولكنه يستحق العناء، فمن خلال إتقان المهارات الفنية من خلال تنمية عقلية النمو ومواءمة عملك مع أهداف العمل يمكنك البقاء في المقدمة في هذا المجال التنافسي، كما تعمل الاتصالات والتواصل والممارسات الأخلاقية على تعزيز قيمتك كمحترف بيانات، وفي النهاية سيضمن الالتزام بالتعلم المستمر وتحسين الذات نجاحك كمحلل بيانات في عالم تحليل البيانات المتغير باستمرار
In recent years, the integration of Python into Microsoft Excel has revolutionized the field of data analysis. This development bridges the gap between two of the most widely used tools in data analytics, bringing together the accessibility of Excel with the advanced capabilities of Python. This combination is poised to reshape how data analysts work by enhancing efficiency, enabling advanced analytics, and fostering greater collaboration.
Enhanced Efficiency
One of the most immediate benefits of integrating Python into Excel is the significant boost in efficiency. Excel has long been the go-to tool for basic data manipulation and visualization, while Python excels in handling large datasets, automation, and advanced computations. Previously, analysts had to switch between these tools, exporting and importing data between Excel and Python environments. With Python now embedded in Excel, this workflow becomes seamless, saving time and reducing errors. For instance, tasks like cleaning data, automating repetitive processes, or performing complex calculations can now be executed directly within Excel, eliminating redundant steps.
Advanced Analytics Made Accessible
Python’s integration into Excel democratizes access to advanced analytics. Python’s robust libraries, such as Pandas, NumPy, and Matplotlib, empower users to perform sophisticated data manipulation, statistical analysis, and data visualization. Analysts who are already comfortable with Excel can now leverage these powerful tools without needing extensive programming expertise. For example, tasks such as predictive modeling, trend analysis, and machine learning—once the domain of specialized data scientists—can now be performed within Excel by leveraging Python scripts. This makes advanced analytics more accessible to a broader audience, fostering innovation and enabling businesses to extract deeper insights from their data.
Advertisements
Greater Collaboration
Another transformative aspect of this integration is its potential to enhance collaboration. Data analysts often work alongside professionals who may not have programming expertise but are proficient in Excel. By embedding Python directly into Excel, analysts can create solutions that are easily shared and understood by non-technical team members. Python’s ability to generate visually appealing and interactive dashboards, combined with Excel’s familiar interface, ensures that insights are communicated effectively across diverse teams. Additionally, this integration reduces the reliance on external tools, creating a unified platform for analysis and reporting.
Overcoming Challenges
While the integration of Python into Excel offers numerous advantages, it also presents challenges. Users must invest time in learning Python to fully harness its capabilities. Organizations may also need to provide training and resources to bridge the skill gap. Furthermore, managing computational performance within Excel when dealing with large datasets or resource-intensive Python scripts will require careful optimization.
Conclusion
The integration of Python into Excel marks a pivotal moment in the evolution of data analytics. By combining the strengths of both tools, data analysts can work more efficiently, perform advanced analyses, and collaborate more effectively. While there are challenges to address, the potential benefits far outweigh the drawbacks. As this integration continues to evolve, it will undoubtedly reshape the way data analysts work, driving innovation and unlocking new possibilities in the field of analytics.
Advertisements
كيف يعتبر دمج بايثون في إكسل بمثابة تعزيز كبير لكفاءة عمل محللي البيانات؟
Advertisements
في السنوات الأخيرة أحدث دمج بايثون في مايكروسوفت إكسل ثورة في مجال تحليل البيانات، إذ يعمل هذا التطور على سد الفجوة بين اثنتين من أكثر الأدوات استخداماً في تحليل البيانات حيث يجمع بين إمكانية الوصول إلى إكسل والقدرات المتقدمة لبايثون، فمن المتوقع أن يعيد هذا المزيج تشكيل طريقة عمل محللي البيانات من خلال تعزيز الكفاءة وتمكين التحليلات المتقدمة وتعزيز التعاون بشكل أكبر
:تحسين الكفاءة
تتمثل إحدى الفوائد الأكثر أهمية لدمج بايثون في إكسل في الزيادة الكبيرة في الكفاءة، إذ لطالما كان إكسل هو الأداة المفضلة لمعالجة البيانات الأساسية وتصورها بينما يتفوق بايثون في التعامل مع مجموعات البيانات الكبيرة والأتمتة والحسابات المتقدمة، ففي السابق كان على المحللين التبديل بين هذه الأدوات وتصدير البيانات واستيرادها بين بيئات إكسل وبايثون، ولكن مع تضمين بايثون الآن في إكسل أصبح سير العمل هذا سلساً مما يوفر الوقت ويقلل الأخطاء، فعلى سبيل المثال يمكن الآن تنفيذ مهام مثل تنظيف البيانات أو أتمتة العمليات المتكررة أو إجراء حسابات معقدة مباشرةً داخل إكسل، مما يلغي الخطوات المكررة.
:التحليلات المتقدمة أصبحت متاحة
يعمل دمج بايثون في إكسل على إضفاء الطابع الديمقراطي على الوصول إلى التحليلات المتقدمة
Matplotlib و NumPy و Pandas فتعمل مكتبات بايثون القوية مثل
على تمكين المستخدمين من إجراء معالجة معقدة للبيانات والتحليل الإحصائي وتصور البيانات، ويمكن للمحللين الذين يشعرون بالراحة بالفعل مع إكسل الآن الاستفادة من هذه الأدوات القوية دون الحاجة إلى خبرة برمجة واسعة النطاق، فعلى سبيل المثال يمكن الآن تنفيذ مهام مثل النمذجة التنبؤية وتحليل الاتجاهات والتعلم الآلي داخل إكسل من خلال الاستفادة من نصوص بايثون وهذا يجعل التحليلات المتقدمة أكثر سهولة في الوصول إليها لجمهور أوسع مما يعزز الابتكار ويمكِّن الشركات من استخراج رؤى أعمق من بياناتها
Advertisements
:تعاون أكبر
هناك جانب تحويلي آخر لهذا التكامل وهو قدرته على تعزيز التعاون، فغالباً ما يعمل محللو البيانات جنباً إلى جنب مع المحترفين الذين قد لا يتمتعون بخبرة في البرمجة ولكنهم بارعون في إكسل، فمن خلال تضمين بايثون مباشرة في إكسل يمكن للمحللين إنشاء حلول يمكن مشاركتها وفهمها بسهولة من قبل أعضاء الفريق غير الفنيين، وبالتالي تضمن قدرة بايثون على إنشاء لوحات معلومات جذابة بصرياً وتفاعلية جنباً إلى جنب مع واجهة إكسل المألوفة ومن ثم توصيل الأفكار بشكل فعال عبر فرق متنوعة، وبالإضافة إلى ذلك يقلل هذا التكامل من الاعتماد على الأدوات الخارجية مما يخلق منصة موحدة للتحليل وإعداد التقارير
:التغلب على التحديات
في حين أن دمج بايثون في إكسل يوفر العديد من المزايا فإنه يقدم أيضاً تحديات يجب على المستخدمين استثمار الوقت في تعلم بايثون للاستفادة الكاملة من قدراته، وقد تحتاج المؤسسات أيضاً إلى توفير التدريب والموارد لسد فجوة المهارات، علاوة على ذلك فإن إدارة الأداء الحسابي داخل إكسل عند التعامل مع مجموعات بيانات كبيرة أو نصوص بايثون كثيفة الموارد ستتطلب تحسيناً دقيقاً
:نستخلص مما سبق
يمثل دمج بايثون في إكسل لحظة محورية في تطور تحليلات البيانات، فمن خلال الجمع بين نقاط القوة في كلتا الأداتين يمكن لمحللي البيانات العمل بكفاءة أكبر وإجراء تحليلات متقدمة والتعاون بشكل أكثر فعالية، ورغم التحديات التي يتعين علينا معالجتها فإن الفوائد المحتملة تفوق بكثير العيوب ومع استمرار تطور هذا التكامل فإنه سيعمل بلا شك على إعادة تشكيل الطريقة التي يعمل بها محللو البيانات مما سيدفع عجلة الابتكار ويفتح آفاقاً جديدة لإمكانيات في مجال التحليلات
In a world driven by technology and connectivity, the traditional notion of job hunting has evolved dramatically. The idea of scouring job boards, sending out countless résumés, and waiting anxiously for responses is becoming a thing of the past. Instead, the concept of allowing the job to find you is gaining traction. This approach is not only more efficient but also positions individuals to attract opportunities that align with their true talents and passions.
Building Your Personal Brand
One of the most effective ways to let jobs come to you is by cultivating a strong personal brand. This involves showcasing your skills, expertise, and achievements in a way that makes you stand out. Platforms like LinkedIn, personal websites, or even professional social media accounts act as digital resumes and portfolios. By regularly sharing insights, projects, and successes, you position yourself as a thought leader in your field, making it easier for recruiters and employers to notice your unique value.
Networking and Connections
Networking remains a cornerstone of career advancement, but in this context, it is about building authentic relationships rather than simply asking for opportunities. Attending industry events, participating in webinars, and engaging in online communities can help you connect with professionals who may later recommend you for roles. Often, the best job opportunities come not from applications but through referrals from trusted connections.
Mastering the Passive Job Search
Even when you are not actively seeking a job, maintaining an updated and visible professional presence is essential. Recruiters and hiring managers often use tools like LinkedIn Recruiter or industry-specific databases to find candidates. By optimizing your profiles with relevant keywords and highlighting your achievements, you increase the chances of being approached for roles that match your skills.
Advertisements
Upskilling and Staying Relevant
Another key aspect of attracting opportunities is staying ahead in your field. Continuous learning, whether through online courses, certifications, or practical projects, demonstrates a commitment to growth. Employers are naturally drawn to individuals who stay updated with the latest trends and technologies in their industry.
The Shift in Employer Mindset
Employers themselves are changing how they find talent. Instead of relying solely on job postings, many companies now actively search for candidates who align with their values and long-term goals. They look for individuals who demonstrate a strong sense of purpose, creativity, and adaptability. By focusing on building a compelling narrative around your career, you position yourself as someone employers want to pursue.
Conclusion
Letting the job find you is not about being passive; it is about being strategic. By investing in your personal brand, networking authentically, staying visible, and continuously developing your skills, you create a professional persona that attracts opportunities. In this modern age, the most fulfilling jobs are not those we chase but those that are drawn to us because of the value we consistently offer.
Advertisements
كيف تُمكِّن الشركات من العثور عليك بدلاً من إهدار وقتك في البحث عن وظيفة؟
Advertisements
في عالم تحكمه التكنولوجيا والاتصال تطور المفهوم التقليدي للبحث عن وظيفة بشكل كبير، فأصبحت فكرة البحث في لوحات الوظائف وإرسال عدد لا يحصى من السير الذاتية والانتظار بفارغ الصبر للحصول على ردود أصبحت شيئاً من الماضي، وبدلاً من ذلك يكتسب مفهوم السماح للوظيفة بالعثور عليك زخماً، فهذا النهج ليس أكثر كفاءة فحسب بل يضع الأفراد أيضاً في موقف يجذب الفرص التي تتوافق مع مواهبهم الحقيقية وشغفهم
:بناء علامتك التجارية الشخصية
تعتبر تنمية علامة تجارية شخصية قوية واحدة من أكثر الطرق فعالية للسماح للوظائف بالوصول إليك، إذ يتضمن هذا عرض مهاراتك وخبراتك وإنجازاتك بطريقة تجعلك مميزاً،
أو المواقع الشخصية LinkedIn وتعمل المنصات مثل
أو حتى حسابات وسائل التواصل الاجتماعي المهنية كسير ذاتية رقمية ومحافظ أعمال، فمن خلال مشاركة الأفكار والمشاريع والنجاحات بانتظام فإنك تضع نفسك كقائد فكري في مجالك مما يسهل على أصحاب العمل ملاحظة قيمتك الفريدة
التواصل والتفاعل
لا يزال التواصل والتفاعل حجر الزاوية في التقدم الوظيفي ولكن في هذا السياق يتعلق الأمر ببناء علاقات حقيقية بدلاً من مجرد طلب الفرص، إذ يمكن أن يساعدك حضور الفعاليات الصناعية والمشاركة في الندوات عبر الإنترنت والانخراط في المجتمعات عبر الإنترنت في التواصل مع المحترفين الذين قد يوصون بك لاحقاً لوظائف، وغالباً لا تأتي أفضل فرص العمل من الطلبات ولكن من خلال الإحالات من الاتصالات الموثوقة
Advertisements
إتقان البحث السلبي عن الوظائف
حتى عندما لا تبحث بنشاط عن وظيفة فإن الحفاظ على حضور مهني محدث وواضح أمر ضروري، وغالباً ما يستخدم مسؤولو ومديرو التوظيف
أو قواعد البيانات الخاصة LinkedIn Recruiter أدوات مثل
بالصناعة للعثور على المرشحين، فمن خلال تحسين ملفاتك الشخصية باستخدام الكلمات الرئيسية ذات الصلة وتسليط الضوء على إنجازاتك فإنك تزيد من فرص الاتصال بك لوظائف تتناسب مع مهاراتك
تحسين المهارات والبقاء على صلة
هناك جانب رئيسي آخر لجذب الفرص وهو البقاء في المقدمة في مجال عملك، ويُظهر التعلم المستمر سواء من خلال الدورات التدريبية عبر الإنترنت أو الشهادات أو المشاريع العملية الالتزام بالنمو، فينجذب أصحاب العمل بشكل طبيعي إلى الأفراد الذين يبقون على اطلاع بأحدث الاتجاهات والتقنيات في صناعتهم
التحول في عقلية صاحب العمل
يغير أصحاب العمل أنفسهم كيفية العثور على المواهب، فبدلاً من الاعتماد فقط على الوظائف المعلن عنها تبحث العديد من الشركات الآن بنشاط عن المرشحين الذين يتوافقون مع قيمها وأهدافها طويلة الأجل، فهم يبحثون عن الأفراد الذين يظهرون إحساساً قوياً بالهدف والإبداع والقدرة على التكيف، فمن خلال التركيز على بناء سرد مقنع حول حياتك المهنية فإنك تضع نفسك كشخص يريد أصحاب العمل متابعته
نستخلص مما سبق أن السماح للوظيفة بالعثور عليك لا يعني أن تكون سلبياً، بل يتعلق باستراتيجية ناجحة، فمن خلال الاستثمار في علامتك التجارية الشخصية والتواصل والبقاء مرئياً وتطوير مهاراتك باستمرار فإنك تخلق شخصية مهنية تجذب الفرص، ففي هذا العصر الحديث تعتبر الوظائف الأكثر إشباعاً ليست تلك التي نسعى إليها ولكن تلك التي تنجذب إلينا بسبب القيمة التي نقدمها باستمرار
In the era of big data and machine learning, data science has emerged as a critical field, enabling businesses and researchers to make informed decisions. However, the backbone of data science lies in mathematics, which is essential for understanding the algorithms, models, and techniques used. For those new to data science, mastering the required mathematical concepts can seem daunting. Here’s a step-by-step guide to learning the math needed for data science.
1. Identify the Core Areas of Mathematics:
The primary areas of math relevant to data science include:
Linear Algebra: This is foundational for understanding concepts like matrices, vectors, and their operations, which are widely used in machine learning algorithms and neural networks.
Calculus: Knowledge of derivatives and integrals is vital for optimization problems, which are at the heart of model training.
Probability and Statistics: These are essential for analyzing data, understanding distributions, and building predictive models.
Discrete Mathematics: Concepts like set theory and graph theory can help in database management and network analysis.
2. Start with Practical Applications:
Rather than diving deep into abstract theory, begin by understanding how math applies to real-world data problems. For instance, learn about matrix operations in linear algebra through examples like image manipulation or recommendation systems. Online tutorials and courses often tie mathematical concepts to coding exercises, making the learning process more engaging.
3. Use Online Resources and Courses:
Platforms like Khan Academy, Coursera, and edX offer beginner-friendly courses in mathematics for data science. Start with foundational topics like basic statistics or linear algebra before progressing to advanced concepts. Many of these courses also incorporate Python or R for practical exercises, allowing you to apply math to data problems immediately.
Advertisements
4. Practice with Tools and Libraries:
Programming libraries such as NumPy, SciPy, and pandas in Python provide built-in functions to perform mathematical operations. Practicing with these tools not only solidifies mathematical understanding but also prepares you to tackle real-world data science projects.
5. Focus on Problem-Solving:
Solving data science problems on platforms like Kaggle or HackerRank helps reinforce mathematical concepts. For example, while working on a regression problem, you can delve into the calculus behind gradient descent or use statistical tests to validate results.
6. Join Study Groups and Communities:
Collaborating with peers can accelerate learning. Online forums like Stack Overflow or Reddit’s r/datascience are excellent places to ask questions, share resources, and learn from others’ experiences.
7. Maintain a Growth Mindset:
Finally, remember that learning math for data science is a gradual process. Focus on building a solid foundation and tackle advanced topics as your confidence grows. Stay curious, and don’t hesitate to revisit concepts that feel challenging.
Conclusion:
While data science requires proficiency in math, the key to mastering it lies in consistent practice, using real-world applications, and leveraging modern learning tools. By approaching mathematical concepts step by step and integrating them into practical data science projects, you’ll not only enhance your technical skills but also gain the confidence needed to excel in this dynamic field.
Advertisements
دليل خطوة بخطوة لتعلم الرياضيات اللازمة لعلم البيانات
Advertisements
في عصر البيانات الضخمة والتعلم الآلي برز علم البيانات كمجال بالغ الأهمية مما يتيح للشركات والباحثين اتخاذ قرارات مستنيرة، ومع ذلك فإن العمود الفقري لعلم البيانات يكمن في الرياضيات وهو أمر ضروري لفهم الخوارزميات والنماذج والتقنيات المستخدمة، فبالنسبة لأولئك الجدد في علم البيانات قد يبدو إتقان المفاهيم الرياضية المطلوبة أمراً شاقاً
:إليك دليل خطوة بخطوة لتعلم الرياضيات اللازمة لعلم البيانات
1. تحديد المجالات الأساسية للرياضيات
:تشمل المجالات الأساسية للرياضيات ذات الصلة بعلم البيانات ما يلي
• الجبر الخطي: يعد هذا أساساً لفهم المفاهيم مثل المصفوفات والمتجهات وعملياتها والتي تُستخدم على نطاق واسع في خوارزميات التعلم الآلي والشبكات العصبية
• حساب التفاضل والتكامل: تعد معرفة المشتقات والتكاملات أمراً حيوياً لمشاكل التحسين والتي تشكل جوهر تدريب النموذج
• الاحتمالات والإحصاء: تعد هذه ضرورية لتحليل البيانات وفهم التوزيعات وبناء النماذج التنبؤية
• الرياضيات المنفصلة: يمكن أن تساعد المفاهيم مثل نظرية المجموعات ونظرية الرسم البياني في إدارة قواعد البيانات وتحليل الشبكات
2. ابدأ بالتطبيقات العملية
بدلاً من التعمق في النظرية المجردة ابدأ بفهم كيفية تطبيق الرياضيات على مشاكل البيانات في العالم الحقيقي، على سبيل المثال تعرّف على عمليات المصفوفة في الجبر الخطي من خلال أمثلة مثل معالجة الصور أو أنظمة التوصية، فغالباً ما تربط الدروس التعليمية والدورات التدريبية عبر الإنترنت المفاهيم الرياضية بتمارين الترميز مما يجعل عملية التعلم أكثر جاذبية
3. استخدم الموارد والدورات التدريبية عبر الإنترنت
Khan Academy و Coursera و edX تقدم منصات مثل
دورات تدريبية للمبتدئين في الرياضيات لعلوم البيانات، لذا ابدأ بالموضوعات الأساسية مثل الإحصاء الأساسي أو الجبر الخطي قبل التقدم إلى المفاهيم المتقدمة، فتتضمن العديد من هذه الدورات أيضاً Python أو R للتدريبات العملية مما يسمح لك بتطبيق الرياضيات على مشاكل البيانات على الفور
Advertisements
4. تدرب باستخدام الأدوات والمكتبات
في بايثون NumPy و SciPy و pandas توفر مكتبات البرمجة مثل
وظائف مدمجة لإجراء العمليات الرياضية، فالتدرب على هذه الأدوات لا يعزز فهمك للرياضيات فحسب بل ويجهزك أيضاً للتعامل مع مشاريع علم البيانات في العالم الحقيقي
5. التركيز على حل المشكلات
يساعد حل مشكلات علم البيانات
HackerRank أو Kaggle على منصات مثل
في تعزيز المفاهيم الرياضية، فعلى سبيل المثال أثناء العمل على مشكلة الانحدار يمكنك التعمق في حساب التفاضل والتكامل وراء الانحدار التدريجي أو استخدام الاختبارات الإحصائية للتحقق من صحة النتائج
6. الانضمام إلى مجموعات الدراسة والمجتمعات
يمكن أن يؤدي التعاون مع الأقران إلى تسريع التعلم، إذ تعد المنتديات
Reddit’s r/datascience أو Stack Overflow عبر الإنترنت مثل
أماكن ممتازة لطرح الأسئلة ومشاركة الموارد والتعلم من تجارب الآخرين
7. الحفاظ على عقلية النمو
أخيراً تذكر أن تعلم الرياضيات لعلم البيانات هو عملية تدريجية وركز على بناء أساس متين وتناول الموضوعات المتقدمة مع نمو ثقتك بنفسك وحافظ على فضولك ولا تتردد في إعادة النظر في المفاهيم التي تشعر أنها صعبة
الخلاصة
في حين يتطلب علم البيانات إتقان الرياضيات فإن مفتاح إتقانها يكمن في الممارسة المستمرة واستخدام التطبيقات في العالم الحقيقي والاستفادة من أدوات التعلم الحديثة، فمن خلال التعامل مع المفاهيم الرياضية خطوة بخطوة ودمجها في مشاريع علم البيانات العملية لن تعمل على تعزيز مهاراتك الفنية فحسب بل ستكتسب أيضاً الثقة اللازمة للتفوق في هذا المجال الديناميكي
Becoming a data scientist is a journey that often appears daunting due to the wealth of information, tools, and training programs available. It is easy to fall into the trap of spending excessive money on courses, certifications, and resources. However, with the right approach, you can save both time and money while accelerating your learning process. Here are five crucial lessons every beginner data scientist should know:
1. Master the Fundamentals Before Diving into Advanced Topics:
One of the biggest mistakes beginners make is trying to learn everything at once or jumping directly into advanced topics like deep learning or big data tools. Start with the basics:
Mathematics and Statistics: Build a strong foundation in linear algebra, calculus, probability, and statistics. These are the cornerstones of data science.
Programming: Focus on learning Python or R, as these are the most widely used languages in data science. Master libraries like NumPy, pandas, and matplotlib for data manipulation and visualization.
Data Analysis: Learn to clean, analyze, and draw insights from datasets. Practicing these skills on free datasets from platforms like Kaggle or UCI Machine Learning Repository is cost-effective and impactful.
Skipping the fundamentals can lead to frustration and wasted money on courses that assume prior knowledge.
2. Leverage Free and Open-Source Resources:
The internet is a treasure trove of free resources for aspiring data scientists. Before investing in expensive bootcamps or certifications, explore these options:
Online Courses: Platforms like Coursera, edX, and YouTube offer free or affordable courses from top universities and industry experts.
Open-Source Tools: Familiarize yourself with tools like Jupyter Notebook, scikit-learn, TensorFlow, and PyTorch, all of which are freely available.
Books and Blogs: Read beginner-friendly books like “Python for Data Analysis” by Wes McKinney and follow blogs by industry leaders to stay updated.
Many successful data scientists have built their careers using these free and open resources, proving that spending a fortune is not a requirement.
Advertisements
3. Practice Real-World Projects Over Theoretical Learning:
Theoretical knowledge is important, but the real value lies in applying what you learn to real-world problems. Working on projects helps you understand the nuances of data science and builds your portfolio, which is crucial for landing a job. Here are some tips:
Start Small: Begin with simple projects like analyzing a public dataset or building a basic machine learning model.
Participate in Competitions: Platforms like Kaggle and DrivenData host competitions that allow you to solve real-world problems and collaborate with other data enthusiasts.
Contribute to Open-Source Projects: This not only enhances your skills but also helps you build connections in the data science community.
Practical experience is far more valuable to employers than a long list of certifications.
4. Focus on Building a Portfolio, Not Collecting Certificates:
While certifications can be a good starting point, they are not the ultimate measure of your capabilities. Employers prioritize your ability to solve problems and showcase results. Here’s how to build a compelling portfolio:
Document Your Projects: Clearly explain the problem, your approach, and the results in each project.
Host Your Work: Use platforms like GitHub to display your code and results. A well-maintained GitHub profile can serve as your professional portfolio.
Highlight Diverse Skills: Showcase projects that demonstrate your proficiency in different areas, such as data visualization, machine learning, and natural language processing.
A strong portfolio can open doors to opportunities that even the most expensive certification might not.
5. Network and Seek Mentorship:
Networking and mentorship can significantly accelerate your learning curve and save you from costly mistakes. Connect with professionals in the field through:
LinkedIn: Engage with data scientists by commenting on their posts or asking for advice.
Meetups and Conferences: Attend local or virtual events to learn from experts and grow your network.
Mentorship Platforms: Platforms like Data Science Society or Kaggle’s community forums can connect you with mentors willing to guide you.
Learning from someone who has already navigated the path you are on can provide insights that no course or book can offer.
Conclusion
Becoming a professional data scientist doesn’t require spending thousands of dollars. By focusing on the fundamentals, leveraging free resources, gaining practical experience, building a strong portfolio, and networking with industry professionals, you can achieve your goals without breaking the bank. The key is consistency, curiosity, and a willingness to learn through hands-on practice. Remember, the journey to becoming a data scientist is a marathon, not a sprint. Invest your time wisely, and success will follow.
Advertisements
كعالم بيانات مبتدئ إليك 5 دروس أساسية تغنيك عن إنفاق آلاف الدولارات لتصبح عالم بيانات محترف
Advertisements
إن التحول إلى عالم بيانات هو رحلة تبدو شاقة في كثير من الأحيان بسبب وفرة المعلومات والأدوات وبرامج التدريب المتاحة، فمن السهل الوقوع في فخ إنفاق أموال مفرطة على الدورات والشهادات والموارد، ومع ذلك من خلال النهج الصحيح يمكنك توفير الوقت والمال مع تسريع عملية التعلم الخاصة بك
:فيما يلي خمسة دروس حاسمة يجب أن يعرفها كل عالم بيانات مبتدئ
1. إتقان الأساسيات قبل الغوص في الموضوعات المتقدمة
أحد أكبر الأخطاء التي يرتكبها المبتدئون هو محاولة تعلم كل شيء دفعة واحدة أو القفز مباشرة إلى الموضوعات المتقدمة مثل التعلم العميق أو أدوات البيانات الضخمة، لذا ابدأ بالأساسيات
الرياضيات والإحصاء: قم ببناء أساس قوي في الجبر الخطي وحساب التفاضل والتكامل والاحتمالات والإحصاء، فهذه هي أحجار الزاوية في علم البيانات
R أو Python البرمجة: ركز على تعلم
حيث أن هذه هي اللغات الأكثر استخداماً في علم البيانات
matplotlib و pandas و NumPy ولاسيما إتقان المكتبات مثل
لمعالجة البيانات وتصورها
تحليل البيانات: تعلم كيفية تنظيف وتحليل واستخلاص الأفكار من مجموعات البيانات، إذ تعتبر ممارسة هذه المهارات على مجموعات البيانات المجانية من منصات
UCI Machine Learning Repository أو Kaggle :مثل
مؤثرة وفعالة من حيث التكلفة
قد يؤدي تخطي الأساسيات إلى الإحباط وإهدار المال على الدورات التي تفترض المعرفة المسبقة
2. الاستفادة من الموارد المجانية والمفتوحة المصدر
يعد الإنترنت كنزاً من الموارد المجانية لعلماء البيانات الطموحين، فقبل الاستثمار في معسكرات التدريب أو الشهادات باهظة الثمن استكشف الخيارات التالية
:الدورات التدريبية عبر الإنترنت
YouTube و edX و Coursera :تقدم منصات مثل
دورات مجانية أو بأسعار معقولة من أفضل الجامعات وخبراء الصناعة
أدوات مفتوحة المصدر: تعرف على أدوات
PyTorch و TensorFlow و scikit-learn و Jupyter Notebook :مثل
وكلها متاحة مجاناً
الكتب والمدونات: اقرأ كتباً مناسبة للمبتدئين
Wes McKinney بقلم Python for Data Analysis :مثل
واتبع مدونات رواد الصناعة للبقاء على اطلاع دائم
لقد بنى العديد من علماء البيانات الناجحين حياتهم المهنية باستخدام هذه الموارد المجانية والمفتوحة مما يثبت أنه لا يشترط إنفاق ثروة لتحصيل هذه العلوم
Advertisements
3. ممارسة المشاريع الواقعية بدلاً من التعلم النظري
المعرفة النظرية مهمة لكن القيمة الحقيقية تكمن في تطبيق ما تعلمته على مشاكل العالم الحقيقي، بحيث يساعدك العمل على المشاريع على فهم الفروق الدقيقة في علم البيانات وبناء محفظتك وهو أمر بالغ الأهمية للحصول على وظيفة، إليك بعض النصائح
انطلق بمشاريع صغيرة: ابدأ بمشاريع بسيطة مثل تحليل مجموعة بيانات عامة أو بناء نموذج أساسي للتعلم الآلي
:شارك في المسابقات
Kaggle و DrivenData :تستضيف منصات مثل
مسابقات تتيح لك حل مشاكل العالم الحقيقي والتعاون مع المتحمسين الآخرين للبيانات
ساهم في المشاريع مفتوحة المصدر: لا يعزز هذا مهاراتك فحسب بل يساعدك أيضاً في بناء اتصالات في مجتمع علم البيانات، ولا تنسى أن الخبرة العملية أكثر قيمة لأصحاب العمل من قائمة طويلة من الشهادات
4. ركز على بناء محفظة أعمال وليس جمع الشهادات
في حين أن الشهادات يمكن أن تكون نقطة بداية جيدة إلا أنها ليست المقياس النهائي لقدراتك، إذ يعطي أصحاب العمل الأولوية لقدرتك على حل المشكلات وعرض النتائج
:إليك كيفية بناء محفظة أعمال مقنعة
وثق مشاريعك: اشرح بوضوح المشكلة ونهجك والنتائج في كل مشروع
GitHub العرض على المنصات: استخدم منصات مثل
لعرض الكود والنتائج الخاصة بك
GitHub ويمكن أن يكون ملف تعريف
الذي يتم صيانته جيداً بمثابة محفظة أعمال مهنية
سلط الضوء على المهارات المتنوعة: اعرض المشاريع التي توضح كفاءتك في مجالات مختلفة مثل تصور البيانات والتعلم الآلي ومعالجة اللغة الطبيعية
يمكن أن تفتح المحفظة القوية الأبواب أمام فرص قد لا تتمكن حتى أغلى الشهادات من فتحها
5. التواصل والبحث عن الإرشاد
يمكن أن يؤدي التواصل والبحث عن الإرشاد إلى تسريع منحنى التعلم بشكل كبير وإنقاذك من الأخطاء المكلفة، تواصل مع المحترفين في هذا المجال من خلال
تواصل مع علماء البيانات :LinkedIn
من خلال التعليق على منشوراتهم أو طلب النصيحة
اللقاءات والمؤتمرات: احضر الأحداث المحلية أو الافتراضية للتعلم من الخبراء وتنمية شبكتك
منصات الإرشاد: يمكن لمنصات
Data Science Society :مثل
Kaggle أو منتديات مجتمع
أن تربطك بمرشدين على استعداد لإرشادك
يمكن أن يوفر لك التعلم من شخص سلك المسار الذي تسلكه بالفعل رؤى لا يمكن لأي دورة أو كتاب أن يقدمها
الخلاصة
لا يتطلب التحول إلى عالم بيانات محترف إنفاق آلاف الدولارات، فمن خلال التركيز على الأساسيات والاستفادة من الموارد المجانية واكتساب الخبرة العملية وبناء محفظة قوية والتواصل مع خبراء الصناعة يمكنك تحقيق أهدافك دون إنفاق الكثير من المال، والمفتاح هو الاتساق والفضول والرغبة في التعلم من خلال الممارسة العملية، وتذكر أن الرحلة إلى التحول إلى عالم بيانات هي ماراثون طويل وليس سباقاً قصيراً، لذا استثمر وقتك بحكمة وسيكون النجاح حليفك
Designing Spotify, a global music streaming platform, is a popular system design interview question. It challenges candidates to demonstrate their ability to build a scalable, distributed, and user-focused system. This article explores how to design such a platform, considering its functionality, architecture, and challenges.
Understanding the Requirements
Before diving into the design, it’s essential to understand the system’s requirements. These can be categorized into functional and non-functional requirements.
Low Latency: Provide seamless music playback with minimal buffering.
High Availability: Ensure the system is always accessible.
Data Consistency: Maintain accurate song metadata and playlists.
System Design Overview
Spotify’s system can be divided into multiple components, each handling a specific aspect of the service:
1. Client Applications
Spotify must offer a rich user experience across platforms like web, mobile, and desktop. The clients communicate with backend services through APIs for functionalities like playback, search, and recommendations.
2. API Gateway
An API Gateway acts as an entry point for all client requests. It routes requests to appropriate backend services, handles rate limiting, and ensures secure communication using HTTPS.
3. Metadata Service
The metadata service stores details about songs, albums, artists, and playlists. A relational database like PostgreSQL or a distributed key-value store like DynamoDB can be used.
Example metadata schema:
Song: ID, title, artist, album, genre, duration.
Playlist: ID, userID, songIDs, creation date.
4. Search Service
Spotify’s search feature allows users to find songs, artists, or playlists quickly. To achieve this:
Use a search engine like ElasticSearch or Apache Solr for indexing metadata.
Implement autocomplete suggestions for a better user experience.
Advertisements
5. Music Storage and Streaming
Spotify stores audio files in a distributed file system, often backed by cloud storage services like Amazon S3. For efficient delivery:
Use Content Delivery Networks (CDNs) to cache audio files close to users, reducing latency.
Implement adaptive bitrate streaming protocols like HLS (HTTP Live Streaming) to provide smooth playback across varying network conditions.
6. Recommendation Engine
Personalized recommendations are a core feature of Spotify. Machine learning models can analyze user behavior, listening history, and playlists to suggest relevant songs. Key techniques include:
Collaborative Filtering: Recommendations based on similar users’ preferences.
Content-Based Filtering: Recommendations based on song attributes (e.g., genre, mood).
7. User Data Service
This service manages user profiles, playlists, and preferences. A NoSQL database like MongoDB or Cassandra can efficiently store and retrieve this information.
8. Payment Service
Spotify’s premium model requires a payment system to handle subscriptions. Integration with third-party payment gateways like Stripe or PayPal is essential for managing transactions securely.
High-Level Architecture
Below is an outline of the architecture for Spotify:
Load Balancer: Distributes traffic across multiple servers to handle user requests efficiently.
Microservices: Each core feature (e.g., search, recommendations, streaming) is handled by independent microservices.
Databases:
SQL Databases: For structured metadata.
NoSQL Databases: For user preferences and activity logs.
Distributed Storage: For storing large audio files.
CDNs: Cache and serve audio files globally.
Event Queue: Use message queues like Kafka to process events (e.g., user activity logging, playlist updates).
Scaling the System
To ensure scalability and performance:
Horizontal Scaling: Add more servers to handle increasing user traffic.
Caching: Use in-memory caches like Redis for frequently accessed data (e.g., popular playlists, recent searches).
Partitioning: Shard databases based on criteria like user IDs or geographic regions.
High Traffic: Handling millions of concurrent users while maintaining low latency.
Consistency vs. Availability: Striking a balance between fast access and accurate metadata.
Global Coverage: Delivering content efficiently to users worldwide.
Copyright Management: Ensuring compliance with music licensing laws.
Machine Learning: Continuously improving recommendation algorithms to enhance user satisfaction.
Conclusion
Designing Spotify involves creating a distributed system capable of handling high traffic while ensuring low latency and high availability. By leveraging modern technologies like microservices, CDNs, and machine learning, developers can build a scalable and robust platform. This system design question tests a candidate’s ability to break down complex problems, prioritize features, and propose practical solutions.
Advertisements
؟Spotifyكيف تصمم
أحد أسئلة مقابلة تصميم النظام
Advertisements
سؤالاً شائعاً في مقابلات تصميم النظام Spotify يعد تصميم
ويتحدى المرشحين لإظهار قدرتهم على بناء نظام قابل للتطوير وموزع ومركّز على المستخدم
تستكشف هذه المقالة كيفية تصميم مثل هذه المنصة مع مراعاة وظائفها وبنيتها والتحديات التي تواجهها
فهم المتطلبات
قبل الخوض في التصميم من الضروري فهم متطلبات النظام بحيث يمكن تصنيفها إلى متطلبات وظيفية وغير وظيفية
:المتطلبات الوظيفية
بث الموسيقى عند الطلب *
البحث عن الأغاني أو الألبومات أو الفنانين *
إنشاء قوائم التشغيل ومشاركتها وإدارتها *
التوصيات الشخصية *
Daily Mix و Discover Weekly :على سبيل المثال
التنزيلات دون اتصال بالإنترنت للمستخدمين المتميزين *
:المتطلبات غير الوظيفية
قابلية التوسع: التعامل مع ملايين المستخدمين المتزامنين
زمن انتقال منخفض: توفير تشغيل موسيقى سلس مع الحد الأدنى من التخزين المؤقت
التوافر العالي: ضمان إمكانية الوصول إلى النظام دائماً
اتساق البيانات: الحفاظ على دقة بيانات الأغاني وقوائم التشغيل
:نظرة عامة على تصميم النظام
إلى عدة مكونات Spotify يمكن تقسيم نظام
:كل منها يتعامل مع جانب معين من الخدمة
1. تطبيقات العميل
Spotify يجب أن تقدم
تجربة مستخدم غنية عبر منصات مثل الويب والجوال وسطح المكتب، فيتواصل العملاء مع خدمات الواجهة الخلفية من خلال واجهات برمجة التطبيقات للحصول على وظائف مثل التشغيل والبحث والتوصيات
2. بوابة واجهة برمجة التطبيقات
تعمل بوابة واجهة برمجة التطبيقات كنقطة دخول لجميع طلبات العملاء، فهي توجه الطلبات إلى خدمات الواجهة الخلفية المناسبة وتتولى تحديد المعدلات
HTTPS وتضمن الاتصال الآمن باستخدام
3. خدمة البيانات الوصفية
خزن خدمة البيانات الوصفية تفاصيل حول الأغاني والألبومات والفنانين وقوائم التشغيل
(على سبيل المثال: تسجيل نشاط المستخدم، وتحديثات قائمة التشغيل)
توسيع نطاق النظام
:لضمان قابلية التوسع والأداء
التوسع الأفقي: أضف المزيد من الخوادم للتعامل مع حركة مرور المستخدم المتزايدة
التخزين المؤقت: استخدم ذاكرة التخزين المؤقت في الذاكرة
للبيانات التي يتم الوصول إليها بشكل متكرر Redis مثل
(على سبيل المثال، قوائم التشغيل الشائعة، عمليات البحث الأخيرة)
التقسيم: قواعد بيانات مجزأة بناءً على معايير مثل معرفات المستخدم أو المناطق الجغرافية
المعالجة غير المتزامنة: نقل المهام غير الحرجة (على سبيل المثال، التسجيل، التحليلات) إلى العاملين في الخلفية
Spotifyالتحديات في تصميم
حركة مرور عالية: التعامل مع ملايين المستخدمين المتزامنين مع الحفاظ على زمن انتقال منخفض
الاتساق مقابل التوافر: إيجاد توازن بين الوصول السريع والبيانات الوصفية الدقيقة
التغطية العالمية: تقديم المحتوى بكفاءة للمستخدمين في جميع أنحاء العالم
إدارة حقوق النشر: ضمان الامتثال لقوانين ترخيص الموسيقى
التعلم الآلي: تحسين خوارزميات التوصية بشكل مستمر لتعزيز رضا المستخدم
الاستنتاج
إنشاء نظام موزع Spotify يتضمن تصميم
قادر على التعامل مع حركة مرور عالية مع ضمان زمن انتقال منخفض وتوافر عالٍ، فمن خلال الاستفادة من التقنيات الحديثة مثل الخدمات المصغرة وشبكات توصيل المحتوى والتعلم الآلي يمكن للمطورين بناء منصة قابلة للتطوير وقوية، إذ يختبر سؤال تصميم النظام هذا قدرة المرشح على تحليل المشكلات المعقدة وإعطاء الأولوية للميزات واقتراح حلول عملية
In today’s data-driven world, the role of a data analyst has emerged as one of the most sought-after professions. A “real” data analyst is not merely someone who understands numbers but a professional capable of extracting meaningful insights from data and translating them into actionable strategies. Becoming a proficient data analyst requires a combination of technical expertise, business acumen, and a continuous learning mindset. This essay explores the essential steps to becoming a successful data analyst.
1. Acquiring Foundational Knowledge
The journey to becoming a data analyst begins with understanding the basics. Foundational knowledge in mathematics and statistics is crucial since these form the backbone of data analysis. Concepts such as probability, descriptive statistics, and hypothesis testing are indispensable tools for interpreting data. Moreover, familiarity with Excel is often a stepping stone, as it allows beginners to perform data cleaning and basic analysis tasks.
A firm grasp of SQL (Structured Query Language) is also essential. SQL enables analysts to extract and manipulate data from relational databases, which is a fundamental aspect of the job. These skills form the core of data analysis and serve as the foundation for more advanced techniques.
2. Mastering Technical Skills
A “real” data analyst is equipped with advanced technical skills that go beyond basic tools. Learning programming languages such as Python and R is highly recommended. These languages allow analysts to perform complex data manipulation, automate repetitive tasks, and create visualizations. Libraries like Pandas, NumPy, and Matplotlib in Python, or ggplot2 in R, are invaluable for data analysis.
In addition to programming, proficiency in data visualization tools like Tableau and Power BI is essential. These tools enable analysts to present data in an intuitive and visually appealing way, making it easier for stakeholders to grasp insights. As data grows in size and complexity, familiarity with big data technologies like Hadoop or Spark can also provide a competitive edge.
3. Understanding the Business Context
Technical skills alone do not make a great data analyst. The ability to understand the business context is equally important. A real data analyst knows how to ask the right questions and align their analysis with business objectives. This involves identifying key performance indicators (KPIs), understanding the target audience, and framing insights in a way that drives decision-making.
Business acumen also includes effective communication. Analysts must bridge the gap between raw data and business strategies by presenting findings in a clear and concise manner. Storytelling with data is a powerful skill that ensures stakeholders can act on the insights provided.
Advertisements
4. Gaining Practical Experience
Real-world experience is crucial for becoming a proficient data analyst. Internships and entry-level positions provide exposure to practical challenges, from handling messy datasets to meeting tight deadlines. Working on personal projects is another excellent way to build experience. By analyzing publicly available datasets, aspiring analysts can create a portfolio that showcases their skills and problem-solving abilities.
Online platforms like Kaggle offer opportunities to work on real-world problems and participate in competitions, allowing analysts to benchmark their skills against a global community. These experiences not only enhance technical proficiency but also foster a deeper understanding of how to approach complex problems.
5. Adopting a Growth Mindset
The field of data analytics is dynamic, with new tools, techniques, and technologies emerging regularly. To stay relevant, a data analyst must adopt a growth mindset and commit to continuous learning. Online courses, certifications, and webinars are excellent resources for staying updated. Certifications from organizations like Google, IBM, or Microsoft can validate an analyst’s skills and make them more attractive to employers.
Networking within the data analytics community can also provide valuable insights into industry trends and best practices. Attending conferences, joining professional groups, and engaging in online forums can help analysts stay connected and informed.
6. Building Soft Skills
While technical and analytical skills are critical, soft skills often differentiate a good data analyst from a great one. Problem-solving is at the heart of data analysis, requiring creativity and critical thinking. Time management is equally important, as analysts often juggle multiple projects with competing deadlines.
Teamwork and collaboration are vital, as analysts frequently work with cross-functional teams, including marketing, finance, and operations. The ability to communicate effectively, both verbally and visually, ensures that insights are understood and acted upon.
Conclusion
Becoming a “real” data analyst is a multifaceted journey that combines technical expertise, business understanding, and practical experience. It requires a solid foundation in statistics and programming, mastery of visualization tools, and the ability to communicate insights effectively. By continuously learning and adapting to new challenges, aspiring analysts can establish themselves as valuable contributors in the ever-evolving world of data analytics. With dedication and persistence, anyone can transform raw data into powerful insights that drive meaningful change.
Advertisements
الخطوات الأساسية لتصبح محلل بيانات ناجحاً
Advertisements
في عالم اليوم الذي تحركه البيانات برز دور محلل البيانات كواحد من أكثر المهن المطلوبة، فمحلل البيانات “الحقيقي” ليس مجرد شخص يفهم الأرقام ولكنه محترف قادر على استخراج رؤى ذات مغزى من البيانات وترجمتها إلى استراتيجيات قابلة للتنفيذ، إذ يتطلب أن تصبح محلل بيانات ماهراً مزيجاً من الخبرة الفنية وفطنة الأعمال وعقلية التعلم المستمر
يستكشف هذا المقال الخطوات الأساسية لتصبح محلل بيانات ناجحاً
1. اكتساب المعرفة الأساسية
تبدأ الرحلة لتصبح محلل بيانات بفهم الأساسيات، فالمعرفة الأساسية في الرياضيات والإحصاء أمر بالغ الأهمية لأنها تشكل العمود الفقري لتحليل البيانات، والمفاهيم مثل الاحتمالات والإحصاء الوصفي واختبار الفرضيات هي أدوات لا غنى عنها لتفسير البيانات، علاوة على ذلك غالباً ما تكون الألفة مع برنامج إكسل بمثابة حجر الأساس بحيث تسمح للمبتدئين بأداء مهام تنظيف البيانات والتحليل الأساسية
(لغة الاستعلام الهيكلية) SQL يعد الفهم القوي لـ
أمراً ضرورياً أيضاً، إذ تمكّن هذه اللغة المحللين من استخراج البيانات ومعالجتها من قواعد البيانات العلائقية وهو جانب أساسي من الوظيفة، بحيث تشكل هذه المهارات جوهر تحليل البيانات وتعمل كأساس لتقنيات أكثر تقدماً
2. إتقان المهارات الفنية
يتمتع محلل البيانات “الحقيقي” بمهارات فنية متقدمة تتجاوز الأدوات الأساسية، إذ يوصى بشدة بتعلم لغات البرمجة
إذ أن هذه اللغات R مثل بايثون و
تسمح للمحللين بإجراء معالجة معقدة للبيانات وأتمتة المهام المتكررة وإنشاء تصورات، لذا تعد المكتبات
في بايثون Pandas و NumPy و Matplotlib مثل
لا تقدر بثمن لتحليل البيانات R في ggplot2 أو
بالإضافة إلى البرمجة فإن إتقان أدوات تصور البيانات
أمر ضروري Tableau و Power BI مثل
بحيث تمكن هذه الأدوات المحللين من تقديم البيانات بطريقة بديهية وجذابة بصرياً مما يسهل على أصحاب المصلحة فهم الرؤى، وعليه ومع نمو حجم البيانات وتعقيدها يمكن أن توفر الألفة بتقنيات البيانات الضخمة
أيضاً ميزة تنافسية Hadoop أو Spark مثل
3. فهم سياق العمل
لا تكفي المهارات الفنية وحدها لصنع محلل بيانات رائع، إذ أن القدرة على فهم سياق العمل مهمة بنفس القدر، فيعرف محلل البيانات الحقيقي كيفية طرح الأسئلة الصحيحة ومواءمة تحليله مع أهداف العمل، فيتضمن هذا تحديد مؤشرات الأداء الرئيسية وفهم الجمهور المستهدف وصياغة الأفكار بطريقة تدفع عملية اتخاذ القرار
تتضمن الفطنة التجارية أيضاً التواصل الفعال بحيث يجب على المحللين سد الفجوة بين البيانات الخام واستراتيجيات العمل من خلال تقديم النتائج بطريقة واضحة وموجزة، وعليه فإن سرد القصص باستخدام البيانات مهارة قوية تضمن قدرة أصحاب المصلحة على التصرف بناءً على الأفكار المقدمة
Advertisements
4. اكتساب الخبرة العملية
إن الخبرة في العالم الحقيقي أمر بالغ الأهمية لكي تصبح محلل بيانات ماهراً، فتوفر التدريبات والمناصب الأولية التعرض للتحديات العملية من التعامل مع مجموعات البيانات الفوضوية إلى تلبية المواعيد النهائية الضيقة، فيعد العمل في المشاريع الشخصية طريقة ممتازة أخرى لبناء الخبرة، فمن خلال تحليل مجموعات البيانات المتاحة للجمهور يمكن للمحللين الطموحين إنشاء محفظة تعرض مهاراتهم وقدراتهم على حل المشكلات
Kaggle توفر المنصات عبر الإنترنت مثل
فرصاً للعمل على مشاكل العالم الحقيقي والمشاركة في المسابقات مما يسمح للمحللين بمقارنة مهاراتهم بمجتمع عالمي، فلا تعمل هذه التجارب على تعزيز الكفاءة الفنية فحسب بل تعزز أيضاً فهماً أعمق لكيفية التعامل مع المشكلات المعقدة
5. تبني عقلية النمو
يعتبر مجال تحليل البيانات ديناميكياً مع ظهور أدوات وتقنيات جديدة بانتظام للبقاء على صلة يجب على محلل البيانات تبني عقلية النمو والالتزام بالتعلم المستمر، فالدورات التدريبية عبر الإنترنت والشهادات والندوات عبر الإنترنت هي موارد ممتازة للبقاء على اطلاع
Google أو IBM أو Microsoft ويمكن للشهادات من منظمات مثل
التحقق من صحة مهارات المحلل وجعلها أكثر جاذبية لأصحاب العمل
يمكن أن توفر الشبكات داخل مجتمع تحليل البيانات أيضاً رؤى قيمة حول اتجاهات الصناعة وأفضل الممارسات، إذ يمكن أن يساعد حضور المؤتمرات والانضمام إلى المجموعات المهنية والمشاركة في المنتديات عبر الإنترنت المحللين على البقاء على اتصال وإطلاع
6. بناء المهارات الشخصية
في حين أن المهارات الفنية والتحليلية بالغة الأهمية فإن المهارات الشخصية غالباً ما تميز محلل البيانات الجيد عن المحلل المتمرس بحيث يعتبر حل المشكلات هو جوهر تحليل البيانات ويتطلب الإبداع والتفكير النقدي، كما أن إدارة الوقت مهمة بنفس القدر حيث غالباً ما يتنقل المحللون بين مشاريع متعددة ومواعيد نهائية متنافسة
إن العمل الجماعي والتعاون أمران حيويان حيث يعمل المحللون غالباً مع فرق متعددة الوظائف بما في ذلك التسويق والتمويل والعمليات، وتضمن القدرة على التواصل بشكل فعال سواء لفظياً أو بصرياً فهم الأفكار والعمل عليها
الخلاصة
إن التحول إلى محلل بيانات “حقيقي” هو رحلة متعددة الأوجه تجمع بين الخبرة الفنية وفهم الأعمال والخبرة العملية ويتطلب الأمر أساساً متيناً في الإحصاء والبرمجة وإتقان أدوات التصور والقدرة على توصيل الأفكار بشكل فعال، ومن خلال التعلم المستمر والتكيف مع التحديات الجديدة يمكن للمحللين الطموحين ترسيخ أنفسهم كمساهمين قيمين في عالم تحليل البيانات المتطور باستمرار، وبالتفاني والمثابرة يمكن لأي شخص تحويل البيانات الخام إلى رؤى قوية تدفع إلى تغيير ذي مغزى
In recent years, YouTube has become one of the most popular platforms for content creators to share their work and monetize their efforts. But one question often lingers in the minds of aspiring creators: how much does YouTube actually pay for 1 million views? Having achieved this milestone myself, I’d like to share my experience and shed some light on how YouTube’s monetization system works.
The Basics of YouTube Monetization
To understand how much YouTube pays for a million views, it’s important to first grasp how monetization works. YouTube pays creators through its Partner Program, which allows ads to run on their videos. Earnings are based on several factors, including ad impressions, viewer demographics, content type, and the advertiser’s budget. These earnings are typically measured in CPM (Cost Per Mille), which is the amount advertisers pay per 1,000 ad views, and RPM (Revenue Per Mille), which is what the creator actually earns per 1,000 views after YouTube’s 45% cut.
Advertisements
Factors That Influence Earnings
When I hit 1 million views on one of my videos, I quickly learned that the amount I earned was not a flat rate. Here are some key factors that influenced my earnings:
Audience Demographics: The majority of my audience was based in the United States and Europe, regions where advertisers tend to pay higher rates. If my viewers were primarily from countries with lower CPM rates, my earnings would have been significantly less.
Content Type: My video was in the “educational” niche, which generally attracts higher-paying advertisers compared to entertainment or general lifestyle content. Topics like finance, technology, and business tend to have higher CPMs due to increased competition among advertisers.
Engagement and Watch Time: Viewer engagement, including how long they watched the video and whether they interacted with ads, played a significant role. Longer videos with mid-roll ads tend to generate more revenue.
Ad Blockers: Not all views result in ad revenue. A significant portion of my audience used ad blockers, which reduced the overall monetizable views.
My Earnings for 1 Million Views
After all these factors were accounted for, my video with 1 million views earned approximately $4,000. This translates to an average RPM of $4. While some creators report earning as little as $1,000 or as much as $10,000 for the same number of views, my earnings fell somewhere in the middle.
It’s worth noting that these numbers can vary dramatically even for the same creator across different videos. For example, a video about personal finance or real estate might have a CPM of $20-$30, while a video about comedy sketches might only earn $1-$5 per CPM.
Lessons Learned and Insights
Consistency is Key: Hitting 1 million views is an incredible milestone, but it’s not enough to sustain a full-time income on YouTube unless you’re consistently reaching those numbers across multiple videos.
Diversify Revenue Streams: Relying solely on ad revenue can be risky. Sponsorships, merchandise, and affiliate marketing are excellent ways to supplement your income.
Know Your Niche: Choosing a niche with high CPM potential can make a significant difference in your earnings.
Engage Your Audience: Building a loyal audience who watches your content consistently can lead to better ad performance and higher revenue.
Conclusion
So, how much does YouTube pay for 1 million views? The answer isn’t straightforward and depends on numerous factors. For me, the milestone brought in $4,000, but others might earn more or less depending on their niche, audience, and content strategy. If you’re an aspiring creator, focus on creating valuable content, understanding your audience, and exploring multiple revenue streams. The journey to 1 million views is both challenging and rewarding, and it’s just the beginning of what’s possible on YouTube.
Advertisements
كم دفعت لي يوتيوب مقابل مليون مشاهدة
Advertisements
في السنوات الأخيرة أصبح يوتيوب أحد أكثر المنصات شعبية لمنشئي المحتوى لمشاركة أعمالهم وتحقيق الدخل من جهودهم ولكن هناك سؤال واحد يتردد في أذهان المبدعين الطموحين: كم يدفع يوتيوب فعلياً مقابل مليون مشاهدة؟ بعد أن حققت هذا الإنجاز بنفسي أود أن أشارك تجربتي وألقي بعض الضوء على كيفية عمل نظام تحقيق الدخل في يوتيوب
أساسيات تحقيق الدخل في يوتيوب
لفهم المبلغ الذي يدفعه يوتيوب مقابل مليون مشاهدة من المهم أولاً فهم كيفية عمل تحقيق الدخل، يدفع يوتيوب للمبدعين من خلال برنامج الشركاء والذي يسمح بتشغيل الإعلانات على مقاطع الفيديو الخاصة بهم، وتعتمد الأرباح على عدة عوامل بما في ذلك مرات ظهور الإعلان والتركيبة السكانية للمشاهدين ونوع المحتوى وميزانية المعلن
(التكلفة لكل ألف ظهور) CPM ويتم قياس هذه الأرباح عادةً بـ
وهو المبلغ الذي يدفعه المعلنون لكل 1000 مشاهدة للإعلان
(الإيرادات لكل ألف ظهور) RPM و
وهو ما يكسبه المنشئ فعلياً لكل 1000 مشاهدة بعد خصم 45% من يوتيوب
:العوامل المؤثرة على الأرباح
عندما حققت مليون مشاهدة على أحد مقاطع الفيديو الخاصة بي تعلمت بسرعة أن المبلغ الذي كسبته لم يكن بمعدل ثابت
:فيما يلي بعض العوامل الرئيسية التي أثرت على أرباحي
:التركيبة السكانية للجمهور
كانت غالبية جمهوري في الولايات المتحدة وأوروبا، المناطق التي يميل المعلنون فيها إلى دفع أسعار أعلى، فإذا كان المشاهدون في المقام الأول
أقل CPM من بلدان ذات معدلات
لكانت أرباحي أقل بشكل كبير
Advertisements
نوع المحتوى: كان الفيديو الخاص بي في مجال “التعليم” والذي يجذب عموماً المعلنين الذين يدفعون أجوراً أعلى مقارنة بالمحتوى الترفيهي أو محتوى نمط الحياة العام، وتميل مواضيع مثل التمويل والتكنولوجيا والأعمال
CPM إلى الحصول على معدلات
أعلى بسبب زيادة المنافسة بين المعلنين
المشاركة ووقت المشاهدة: لعب تفاعل المشاهد بما في ذلك المدة التي شاهد فيها الفيديو وما إذا كان قد تفاعل مع الإعلانات دوراً مهماً، وتميل مقاطع الفيديو الأطول التي تحتوي على إعلانات أثناء التشغيل إلى توليد المزيد من الإيرادات
أدوات حظر الإعلانات: لا تؤدي جميع المشاهدات إلى عائدات إعلانية، إذ استخدم جزء كبير من جمهوري أدوات حظر الإعلانات مما أدى إلى تقليل إجمالي المشاهدات القابلة للربح
أرباحي مقابل مليون مشاهدة
بعد مراعاة كل هذه العوامل حقق الفيديو الخاص بي الذي حقق مليون مشاهدة ما يقرب من 4000 دولار وهذا يعني متوسط عائد لكل ألف ظهور يبلغ 4 دولارات، وفي حين أفاد بعض المبدعين بكسب ما لا يقل عن 1000 دولار أو ما يصل إلى 10000 دولار لنفس عدد المشاهدات فقد انخفضت أرباحي في مكان ما في المنتصف
من الجدير بالذكر أن هذه الأرقام يمكن أن تختلف بشكل كبير حتى بالنسبة لنفس المبدع عبر مقاطع فيديو مختلفة، فعلى سبيل المثال قد يكون لفيديو حول التمويل الشخصي أو العقارات تكلفة لكل ألف ظهور تتراوح بين 20 و30 دولاراً، بينما قد يحقق فيديو حول اسكتشات كوميدية ما بين 1 و5 دولارات فقط لكل ألف ظهور
الدروس المستفادة والرؤى
الاتساق هو المفتاح: إن الوصول إلى مليون مشاهدة يعد إنجازاً مذهلاً ولكنه ليس كافياً للحفاظ على دخل بدوام كامل على يوتيوب ما لم تكن تصل إلى هذه الأرقام باستمرار عبر مقاطع فيديو متعددة
تنويع مصادر الدخل: الاعتماد فقط على عائدات الإعلانات قد يكون محفوفاً بالمخاطر، وتعد الرعايات والسلع والتسويق بالعمولة طرقاً ممتازة لتكملة دخلك
تعرف على تخصصك: يمكن أن يؤدي اختيار
CPM تخصص يتمتع بإمكانات
عالية إلى إحداث فرق كبير في أرباحك
إشراك جمهورك: يمكن أن يؤدي بناء جمهور مخلص يشاهد المحتوى الخاص بك باستمرار إلى أداء إعلاني أفضل وإيرادات أعلى
الخلاصة
إذاً كم يدفع يوتيوب مقابل مليون مشاهدة؟ الإجابة ليست واضحة وتعتمد على عوامل عديدة، فبالنسبة لي جلب لي هذا الإنجاز 4000 دولار لكن الآخرين قد يكسبون أكثر أو أقل اعتماداً على تخصصهم وجمهورهم واستراتيجية المحتوى الخاصة بهم، إذا كنت منشئ محتوى طموحاً فركز على إنشاء محتوى قيّم وفهم جمهورك واستكشاف مصادر دخل متعددة
إن الرحلة إلى مليون مشاهدة صعبة ومجزية في الوقت نفسه وهي مجرد بداية لما هو ممكن على يوتيوب
In the competitive job market of 2025, a well-crafted resume can make all the difference for aspiring data scientists. With advancements in technology and increasing demands for specialized skills, hiring managers now look for resumes that are not only tailored but also demonstrate a strong understanding of the data science field.
This guide will walk you through the essential components of the perfect data science resume, helping you stand out in the crowded talent pool.
1. Understand the Role
Before crafting your resume, thoroughly research the specific data science role you are applying for. Data science encompasses various niches, such as machine learning, data analysis, business intelligence, and artificial intelligence. Each position may prioritize different skills, tools, and experiences. Tailoring your resume to the job description ensures relevance and increases your chances of landing an interview.
2. Choose the Right Format
The structure of your resume should be clean and professional. Opt for reverse chronological order, which highlights your most recent experience and achievements first. Use clear section headings, consistent formatting, and bullet points to improve readability. A one-page resume is ideal, but if you have extensive experience, a two-page resume can be acceptable.
3. Start with a Strong Summary
Begin your resume with a compelling summary that highlights your qualifications and career goals. This section should be concise (2-3 sentences) and tailored to the role. For example:
“Detail-oriented Data Scientist with 5+ years of experience in predictive modeling, data visualization, and machine learning. Proficient in Python, SQL, and Tableau, with a proven track record of driving data-driven decision-making in the e-commerce sector. Seeking to leverage analytical expertise to enhance business outcomes at XYZ Corporation.”
4. Showcase Relevant Skills
The skills section should include technical and soft skills relevant to data science. Group similar skills to improve organization. Example categories include:
In the experience section, focus on achievements rather than responsibilities. Use the STAR (Situation, Task, Action, Result) method to provide context and demonstrate the impact of your contributions. Quantify your achievements wherever possible. For example:
Developed a machine learning model that increased customer retention by 15%, resulting in a $1M revenue boost.
Automated data cleaning processes, reducing analysis time by 30%.
Conducted A/B testing for a marketing campaign, increasing conversion rates by 10%.
6. Include Education and Certifications
List your educational background, starting with your highest degree. Include relevant coursework, honors, or projects if you are a recent graduate. Certifications in data science, machine learning, or specific tools add credibility. Examples include:
Master of Science in Data Science – University of XYZ
Google Data Analytics Professional Certificate
Certified Machine Learning Specialist – Coursera
7. Feature Data Science Projects
Highlighting personal or academic projects is essential, especially for candidates with limited work experience. Describe each project briefly, emphasizing your role, the tools you used, and the results. For instance:
Built a predictive analytics model using Python to forecast sales, achieving 95% accuracy.
Designed an interactive dashboard in Tableau to monitor key performance indicators for a non-profit organization.
Analyzed social media trends using sentiment analysis and NLP, generating actionable insights for brand strategy.
8. Tailor for Applicant Tracking Systems (ATS)
Most companies use ATS software to filter resumes before they reach hiring managers. Ensure your resume contains relevant keywords from the job description. Avoid complex formatting, as it can confuse the ATS.
9. Add a Professional Touch
Include links to your professional profiles, such as LinkedIn, GitHub, or a personal portfolio website. This demonstrates transparency and allows recruiters to explore your work further. Ensure these profiles are up-to-date and showcase your skills effectively.
10. Proofread and Edit
Errors in your resume can leave a negative impression. Proofread multiple times or seek feedback from peers. Consider using tools like Grammarly to catch typos and grammatical issues.
Final Thoughts
Creating the perfect data science resume in 2025 requires a blend of technical expertise, strategic presentation, and attention to detail. By aligning your resume with the job requirements, showcasing measurable achievements, and ensuring clarity, you can position yourself as a top candidate. Remember, your resume is your first impression—make it count.
Advertisements
السيرة الذاتية المثالية لعلم البيانات في عام 2025: دليل شامل
Advertisements
في سوق العمل التنافسي لعام 2025 يمكن أن تحدث السيرة الذاتية المصممة جيداً فرقاً كبيراً لعلماء البيانات الطموحين، فمع التقدم في التكنولوجيا والطلب المتزايد على المهارات المتخصصة يبحث مديرو التوظيف الآن عن السير الذاتية التي لا تكون مصممة خصيصاً فحسب بل تُظهر أيضاً فهماً قوياً لمجال علم البيانات
سيرشدك هذا الدليل خلال المكونات الأساسية للسيرة الذاتية المثالية لعلم البيانات مما يساعدك على التميز في مجموعة المواهب المزدحمة
1. فهم الدور
قبل صياغة سيرتك الذاتية ابحث جيداً عن الدور المحدد لعلم البيانات الذي تتقدم إليه، إذ أن علم البيانات يشمل مجالات مختلفة مثل التعلم الآلي وتحليل البيانات وذكاء الأعمال والذكاء الاصطناعي، لذا قد يعطي كل منصب الأولوية لمهارات وأدوات وخبرات مختلفة، وبناءً عليه يضمن تصميم سيرتك الذاتية وفقاً لوصف الوظيفة الصلة ويزيد من فرصك في الحصول على مقابلة
2. اختر التنسيق المناسب
يجب أن يكون هيكل سيرتك الذاتية نظيفاً ومهنياً، كأن تختار الترتيب الزمني العكسي والذي يسلط الضوء على أحدث خبراتك وإنجازاتك أولاً، واستخدم عناوين الأقسام الواضحة والتنسيق المتسق والنقاط لتحسين قابلية القراءة، السيرة الذاتية المكونة من صفحة واحدة هي المثالية ولكن إذا كانت لديك خبرة واسعة فيمكن قبول السيرة الذاتية المكونة من صفحتين
3. ابدأ بملخص قوي
ابدأ سيرتك الذاتية بملخص مقنع يسلط الضوء على مؤهلاتك وأهدافك المهنية، ويجب أن يكون هذا القسم موجزاً (2-3 جمل) ومصمماً خصيصاً للدور
:على سبيل المثال
“عالم بيانات موجه للتفاصيل مع خبرة تزيد عن 5 سنوات في النمذجة التنبؤية وتصور البيانات والتعلم الآلي
Tableau و SQL و Python متمكن من
مع سجل حافل في قيادة عملية اتخاذ القرار القائمة على البيانات في قطاع التجارة الإلكترونية، وأسعى إلى الاستفادة من الخبرة التحليلية
” XYZ لتعزيز نتائج الأعمال في شركة
4. عرض المهارات ذات الصلة
يجب أن يتضمن قسم المهارات: المهارات الفنية والمهارات الشخصية ذات الصلة بعلم البيانات، قم بتجميع المهارات المتشابهة لتحسين التنظيم
:تشمل فئات الأمثلة
Java و Scala و SQL و R و Python :لغات البرمجة
Pandas و NumPy و Excel و SAS :أدوات تحليل البيانات
TensorFlow و PyTorch و Scikit-learn :أطر التعلم الآلي
Tableau و Power BI و Matplotlib و Seaborn :التصور البياني للبيانات
Hadoop و Spark و AWS و Azure :أدوات البيانات الضخمة
المهارات الشخصية: حل المشكلات والتواصل والعمل الجماعي
Advertisements
5. تسليط الضوء على الخبرة العملية
في قسم الخبرة ركز على الإنجازات بدلاً من المسؤوليات
(الموقف والمهمة والإجراء والنتيجة) STAR واستخدم طريقة
لتوفير السياق وإظهار تأثير مساهماتك، حدد إنجازاتك أينما أمكن
: على سبيل المثال
طور نموذجاً للتعلم الآلي أدى إلى زيادة الاحتفاظ بالعملاء بنسبة 15% مما أدى إلى زيادة الإيرادات بمقدار مليون دولار
عمليات تنظيف البيانات الآلية مما أدى إلى تقليل وقت التحليل بنسبة %30
10%لحملة تسويقية مما أدى إلى زيادة معدلات التحويل بنسبة A/B أجريت اختبار
6. تضمين التعليم والشهادات
قم بإدراج مؤهلاتك التعليمية بدءاً من أعلى درجة حصلت عليها، وقم بتضمين الدورات الدراسية ذات الصلة أو التكريمات أو المشاريع إذا كنت خريجاً حديثاً، واعلم أن إضافة الشهادات في علوم البيانات أو التعلم الآلي أو أدوات معينة يعزز المصداقية
XYZ تشمل الأمثلة: ماجستير العلوم في علوم البيانات – جامعة
Google Data Analytics Professional شهادة
Coursera أخصائي التعلم الآلي المعتمد
7. عرض مشاريع علوم البيانات
يعد تسليط الضوء على المشاريع الشخصية أو الأكاديمية أمراً ضرورياً خاصة للمرشحين ذوي الخبرة العملية المحدودة، قم بوصف كل مشروع بإيجاز مع التركيز على دورك والأدوات التي استخدمتها والنتائج
:على سبيل المثال
قمت ببناء نموذج تحليلي تنبؤي باستخدام بايثون للتنبؤ بالمبيعات وحققت دقة بنسبة %95
Tableau قمت بتصميم لوحة معلومات تفاعلية في
لمراقبة مؤشرات الأداء الرئيسية لمنظمة غير ربحية
تم تحليل اتجاهات وسائل التواصل الاجتماعي باستخدام تحليل المشاعر والبرمجة اللغوية العصبية مما أدى إلى توليد رؤى قابلة للتنفيذ لاستراتيجية العلامة التجارية
8. تصميم أنظمة تتبع المتقدمين
ATS تستخدم معظم الشركات برامج
لتصفية السير الذاتية قبل وصولها إلى مديري التوظيف، وتأكد من أن سيرتك الذاتية تحتوي على كلمات رئيسية ذات صلة من وصف الوظيفة، ثم تجنب التنسيق المعقد
ATS لأنه يمكن أن يربك
9. أضف لمسة احترافية
قم بتضمين روابط لملفاتك الشخصية المهنية
GitHub أو LinkedIn مثل
أو موقع ويب الخاص بالمحفظة الشخصية، فهذا يوضح الشفافية ويسمح للموظفين باستكشاف عملك بشكل أكبر، وتأكد من تحديث هذه الملفات الشخصية وعرض مهاراتك بشكل فعال
10. التدقيق اللغوي والتحرير
يمكن أن تترك الأخطاء في سيرتك الذاتية انطباعاً سلبياً، لذا قم بمراجعة النص عدة مرات أو اطلب ملاحظات من الزملاء
Grammarly وفكر في استخدام أدوات مثل
لتعقب الأخطاء المطبعية والمشكلات النحوية
الأفكار النهائية
يتطلب إنشاء السيرة الذاتية المثالية لعلم البيانات في عام 2025 مزيجاً من الخبرة الفنية والعرض الاستراتيجي والاهتمام بالتفاصيل، فمن خلال توافق سيرتك الذاتية مع متطلبات الوظيفة من خلال عرض إنجازاتك القابلة للقياس وضمان الوضوح يمكنك وضع نفسك كأفضل مرشح، وتذكر أن سيرتك الذاتية هي الانطباع الأول عنك لذا اجعلها ذات قيمة عالية
Structured Query Language (SQL) is an indispensable tool for data scientists. It provides the means to manage, manipulate, and analyze data stored in relational databases. Mastering SQL not only enhances efficiency in handling large datasets but also equips you to extract actionable insights. Here, we’ll discuss some of the best SQL statements to streamline common data science tasks, from data extraction to aggregation and transformation.
1. SELECT: Data Extraction Made Simple
The SELECT statement is foundational for querying data from a database. With its versatility, you can retrieve specific columns, apply filters, and sort results.
This statement allows you to filter data using the WHERE clause and arrange it with ORDER BY. For example, selecting sales data for a specific year can be achieved with this straightforward syntax.
2. GROUP BY and Aggregations: Summarizing Data
Data aggregation is central to many data science tasks. The GROUP BY clause, combined with aggregate functions like SUM, AVG, COUNT, MIN, and MAX, is essential for summarizing data.
This query can help compute metrics like average sales per region or the number of customers per category.
3. JOIN: Combining Data from Multiple Tables
Data often resides in multiple tables, necessitating joins. SQL provides various join types (INNER JOIN, LEFT JOIN, RIGHT JOIN, FULL OUTER JOIN) to merge datasets.
Using joins, you can connect tables to enrich your data, such as merging customer details with purchase histories.
4. CASE: Conditional Logic in Queries
The CASE statement introduces conditional logic, enabling the creation of new derived columns based on existing data.
This is particularly useful for creating classifications or labels directly in the query.
Advertisements
5. CTEs and Subqueries: Structuring Complex Queries
Common Table Expressions (CTEs) and subqueries simplify complex SQL tasks by breaking them into manageable parts.
Using a CTE:
CTEs improve readability and allow the reuse of intermediate results in the main query.
6. WINDOW Functions: Advanced Analytics
Window functions are powerful for performing calculations across rows related to the current row, such as rankings or running totals.
These are ideal for scenarios like identifying the top-performing products in each category.
7. INSERT, UPDATE, DELETE: Data Manipulation
For modifying data, INSERT, UPDATE, and DELETE statements are invaluable.
Insert new data:
Update existing records:
Delete unwanted rows:
These commands maintain database integrity and keep the dataset relevant for analysis.
8. UNION and UNION ALL: Combining Results
When working with multiple queries, UNION combines results into a single output, ensuring uniqueness, while UNION ALL includes duplicates.
This is helpful for consolidating data from different sources.
9. PIVOT and UNPIVOT: Reshaping Data
SQL allows for reshaping data with PIVOT and UNPIVOT, converting rows into columns or vice versa for easier analysis.
This approach is useful for creating summary tables for reporting.
10. EXPLAIN and Performance Optimization
Lastly, the EXPLAIN statement helps optimize query performance by revealing execution plans.
This ensures your queries are efficient and scalable for large datasets.
Conclusion
SQL’s robustness and versatility make it a cornerstone of data science workflows. By mastering these key statements, data scientists can efficiently manage data extraction, transformation, and analysis tasks. Whether handling large-scale databases or generating quick insights, SQL remains an invaluable ally in the data-driven world.
Advertisements
لمعظم مهام علوم البياناتSQLأفضل عبارات
Advertisements
SQL تعد لغة الاستعلامات المنظمة
أداة لا غنى عنها لعلماء البيانات
فهي توفر الوسائل اللازمة لإدارة البيانات المخزنة في قواعد البيانات العلائقية ومعالجتها وتحليلها، فإتقان لغة الاستعلامات المنظمة لا يعزز الكفاءة في التعامل مع مجموعات البيانات الكبيرة فحسب بل يزودك أيضاً بأدوات لاستخراج رؤى قابلة للتنفيذ
SQL سنناقش هنا بعضاً من أفضل عبارات
لتبسيط مهام علوم البيانات الشائعة من استخراج البيانات إلى التجميع والتحويل
استخراج البيانات بطريقة مبسطة . 1 : SELECT
أساسية لاستعلام البيانات من قاعدة البيانات SELECT تعد عبارة
فبفضل تنوعها يمكنك استرداد أعمدة معينة وتطبيق عوامل التصفية وفرز النتائج
تتيح لك هذه العبارة تصفية البيانات
ORDER BY وترتيبها باستخدام WHERE باستخدام عبارة
فعلى سبيل المثال يمكن تحقيق تحديد بيانات المبيعات لسنة معينة باستخدام هذا النحو البسيط
2. والتجميعات : تلخيص البيانات GROUP BY
يعد تجميع البيانات أمراً أساسياً للعديد من مهام علوم البيانات
جنباً إلى جنب مع وظائف التجميع GROUP BY فمثلاً تعتبر جملة
SUM و AVG و COUNT و MIN و MAX :مثل
ضرورية لتلخيص البيانات
يمكن أن يساعد هذا الاستعلام في حساب مقاييس مثل متوسط المبيعات لكل منطقة أو عدد العملاء لكل فئة
3. دمج البيانات من جداول متعددة:JOIN
غالباً ما توجد البيانات في جداول متعددة مما يستلزم عمليات الضم
أنواعاً مختلفة من عمليات الضم SQL ويوفر
(INNER JOIN و LEFT JOIN و RIGHT JOIN و FULL OUTER JOIN)
لدمج مجموعات البيانات
باستخدام عمليات الضم يمكنك ربط الجداول لإثراء بياناتك مثل دمج تفاصيل العملاء مع سجلات الشراء
4. المنطق الشرطي في الاستعلامات:CASE
CASE يقدم بيان
منطقاً شرطياً مما يتيح إنشاء أعمدة مشتقة جديدة استناداً إلى البيانات الموجودة
هذا مفيد بشكل خاص لإنشاء التصنيفات أو العلامات مباشرة في الاستعلام
تعمل تعبيرات الجدول الشائعة على تحسين قابلية القراءة وتسمح بإعادة استخدام النتائج الوسيطة في الاستعلام الرئيسي
Advertisements
6. وظائف النافذة: التحليلات المتقدمة
تعتبر وظائف النافذة قوية لإجراء الحسابات عبر الصفوف المتعلقة بالصف الحالي مثل التصنيفات أو الإجماليات الجارية
هذه مثالية لسيناريوهات مثل تحديد المنتجات ذات الأداء الأعلى في كل فئة
7. الإدراج والتحديث والحذف: معالجة البيانات
لتعديل البيانات تعتبر عبارات الإدراج والتحديث والحذف لا تقدر بثمن
:إدراج بيانات جديدة
:تحديث السجلات الموجودة
:حذف الصفوف غير المرغوب فيها
تحافظ هذه الأوامر على سلامة قاعدة البيانات وتحافظ على أهمية مجموعة البيانات للتحليل
8. دمج النتائج :UNION ALLوUNION
النتائج UNION عند العمل مع استعلامات متعددة يجمع
في إخراج واحد مما يضمن التفرد
التكرارات UNION ALL بينما يتضمن
وهذا مفيد لدمج البيانات من مصادر مختلفة
9. إعادة تشكيل البيانات : UNPIVOTوPIVOT
UNPIVOTو PIVOT بإعادة تشكيل البيانات باستخدام SQL يسمح
وتحويل الصفوف إلى أعمدة أو العكس لتسهيل التحليل
هذا النهج مفيد لإنشاء جداول ملخصة لإعداد التقارير
10. وتحسين الأداءEXPLAIN
في تحسين أداء الاستعلام EXPLAIN تساعد عبارة
من خلال الكشف عن خطط التنفيذ
وهذا يضمن أن تكون استعلاماتك فعالة وقابلة للتطوير لمجموعات البيانات الكبيرة
ختــــاماً
وتنوعها تجعلها حجر الزاوية SQL إن قوة
في سير عمل علوم البيانات، فمن خلال إتقان هذه العبارات الرئيسية يمكن لعلماء البيانات إدارة مهام استخراج البيانات وتحويلها وتحليلها بكفاءة، وسواء كنت تتعامل مع قواعد بيانات واسعة النطاق
Python has been a dominant force in the field of data science for over a decade. Known for its simplicity, readability, and a vast ecosystem of libraries, Python has established itself as the go-to language for data scientists worldwide. However, the landscape of data science is constantly evolving, with new tools and technologies emerging. This raises an important question: Is Python still the reigning king of data science?
Python’s Dominance in Data Science:
Python’s popularity in data science is largely attributed to its rich ecosystem of libraries and frameworks. Libraries like NumPy, Pandas, and Matplotlib provide powerful tools for data manipulation, analysis, and visualization. Additionally, Python’s machine learning libraries, such as scikit-learn, TensorFlow, and PyTorch, have revolutionized how data scientists build and deploy predictive models.
Another key factor in Python’s dominance is its versatility. Python is not only used for data science but also for web development, automation, and scripting. This versatility has made it an attractive choice for individuals and organizations looking to consolidate their tech stack. Its user-friendly syntax also lowers the barrier to entry for beginners, making it a favorite for those new to programming.
Challenges to Python’s Reign:
While Python remains a powerful tool, it faces increasing competition. R, a language developed specifically for statistical computing, is still preferred in academia and industries that require advanced statistical analysis. R offers packages like ggplot2 and dplyr that rival Python’s capabilities.
Additionally, the rise of languages like Julia and tools like SQL and Tableau has introduced alternatives that are often faster or more specialized. Julia, for instance, is gaining traction for its speed and efficiency in numerical computations, which can be a limitation for Python in certain scenarios.
Advertisements
Moreover, the field of data science is seeing a shift towards low-code and no-code platforms like Alteryx and DataRobot, which aim to make data science more accessible to non-programmers. These platforms can handle many tasks traditionally performed using Python, potentially reducing its ubiquity.
Emerging Trends in Data Science:
The future of Python in data science also depends on its ability to adapt to emerging trends. For instance, the integration of artificial intelligence and deep learning has created demand for even more specialized tools and frameworks. While Python’s TensorFlow and PyTorch dominate this space, competition from platforms like Google’s JAX and Facebook’s ONNX is growing.
Python also faces challenges in big data environments, where tools like Apache Spark and languages like Scala or Rust are often more efficient. However, Python’s adaptability is evident in the development of libraries like PySpark, which bridges the gap between Python and Spark.
Conclusion
While Python faces growing competition, it remains the king of data science due to its extensive library support, versatility, and a large, active community. However, its continued dominance is not guaranteed. As the field evolves, Python must keep pace with new challenges and trends to maintain its position. For now, Python’s reign remains strong, but the future of data science may see a more diverse set of tools sharing the throne.
Advertisements
هل لا يزال بايثون هو الملك الحاكم لعلوم البيانات؟
Advertisements
لقد كان بايثون قوة مهيمنة في مجال علوم البيانات لأكثر من عقد من الزمان، إذ تشتهر لغة بايثون ببساطتها وسهولة قراءتها ونظامها البيئي الواسع من المكتبات وقد أثبتت نفسها كلغة مفضلة لعلماء البيانات في جميع أنحاء العالم، ومع ذلك فإن مشهد علوم البيانات يتطور باستمرار مع ظهور أدوات وتقنيات جديدة، وهذا يثير سؤالاً مهماً: هل لا يزال بايثون هو الملك الحاكم لعلوم البيانات؟
:هيمنة بايثون في علوم البيانات
تعزى شعبية بايثون في علوم البيانات إلى حد كبير إلى نظامها البيئي الغني بالمكتبات والأطر
NumPy و Pandas و Matplotlib بحيث توفر المكتبات مثل
أدوات قوية للتلاعب بالبيانات وتحليلها وتصورها، بالإضافة إلى ذلك أحدثت مكتبات التعلم الآلي في بايثون
scikit-learn و TensorFlow و PyTorch مثل
ثورة في كيفية بناء علماء البيانات ونشر النماذج التنبؤية
عامل رئيسي آخر في هيمنة بايثون هو تنوعها، إذ لا يُستخدم بايثون في علم البيانات فحسب بل يُستخدم أيضاً في تطوير الويب والأتمتة وبرمجة النصوص البرمجية وقد جعل هذا التنوع منه خياراً جذاباً للأفراد والمؤسسات التي تتطلع إلى توحيد مجموعة التقنيات الخاصة بها، كما يعمل بناء الجملة سهل الاستخدام على خفض حاجز الدخول للمبتدئين مما يجعله المفضل للمبتدئين في البرمجة
:التحديات التي تواجه حكم بايثون
في حين تظل بايثون أداة قوية إلا أنها تواجه منافسة متزايدة
وهي لغة تم تطويرها خصيصاً للحوسبة الإحصائية R فلا تزال لغة
مفضلة في الأوساط الأكاديمية والصناعات التي تتطلب تحليلاً إحصائياً متقدماً
تنافس قدرات بايثون dplyr و ggplot2 حزماً مثل R تقدم
Julia بالإضافة إلى ذلك أدى ظهور لغات مثل
Tableau و SQL وأدوات مثل
إلى تقديم بدائل غالباً ما تكون أسرع أو أكثر تخصصاً
قوة دفع لسرعتها وكفاءتها Julia فعلى سبيل المثال تكتسب
في الحسابات العددية والتي يمكن أن تشكل قيداً لـبايثون في سيناريوهات معينة
علاوة على ذلك يشهد مجال علم البيانات تحولاً نحو منصات منخفضة الكود
DataRobot و Alteryx ومن دون كود مثل
والتي تهدف إلى جعل علم البيانات أكثر سهولة في الوصول إليه لغير المبرمجين، إذ يمكن لهذه المنصات التعامل مع العديد من المهام التي يتم إجراؤها تقليدياً باستخدام بايثون مما قد يقلل من انتشارها
Advertisements
الاتجاهات الناشئة في علم البيانات
يعتمد مستقبل بايثون في علم البيانات أيضاً على قدرته على التكيف مع الاتجاهات الناشئة، فعلى سبيل المثال أدى دمج الذكاء الاصطناعي والتعلم العميق إلى خلق طلب على أدوات وأطر عمل أكثر تخصصاً
من بايثون على هذا المجال PyTorch و TensorFlow في حين تهيمن
Google من JAX فإن المنافسة من منصات مثل
آخذة في الازدياد Facebook من ONNX و
يواجه بايثون أيضاً تحديات في بيئات البيانات الضخمة
Apache Spark حيث غالباً ما تكون أدوات مثل
أكثر كفاءة Rust أو Scala ولغات مثل
ومع ذلك فإن قدرة بايثون على التكيف واضحة
PySpark في تطوير مكتبات مثل
Spark والتي تسد الفجوة بين بايثون و
الخلاصة
في حين يواجه بايثون منافسة متزايدة فإنه يظل ملك علم البيانات نظراً لدعم مكتبته الواسع وتعدد استخداماته ومجتمعه النشط الكبير، ومع ذلك فإن هيمنته المستمرة ليست مضمونة ومع تطور المجال يجب على بايثون مواكبة التحديات والاتجاهات الجديدة للحفاظ على مكانته
في الوقت الحالي لا يزال حكم بايثون قوياً لكن مستقبل علم البيانات قد يشهد مجموعة أكثر تنوعاً من الأدوات التي تتقاسم العرش مع بايثون الملك
Data science remains one of the most dynamic and in-demand career paths in 2024, offering opportunities to work at the intersection of technology, business, and innovation. However, switching to a career in data science requires more than just enthusiasm; it demands strategic planning, skill acquisition, and a clear understanding of the field’s expectations.
Here’s a detailed guide on what you need to know before making this significant career change, illustrated with examples to provide clarity.
1. Understand What Data Science Entails
Data science involves extracting insights and actionable knowledge from structured and unstructured data using tools, algorithms, and statistical methods. It encompasses roles such as data analysts, machine learning engineers, and data engineers. Before diving in, ensure you have a clear understanding of the specific domain or role that aligns with your interests.
Example: If you’re transitioning from a marketing background, you might find data analytics or business intelligence more aligned with your expertise, focusing on customer segmentation or campaign performance.
2. Acquire the Necessary Skills
Success in data science hinges on technical and analytical skills. Core competencies include:
Programming Languages: Proficiency in Python, R, or SQL.
Mathematics and Statistics: Understanding probability, linear algebra, and hypothesis testing.
Machine Learning: Familiarity with algorithms like linear regression, decision trees, and neural networks.
Data Visualization: Expertise in tools like Tableau, Power BI, or Matplotlib.
Big Data Tools: Knowledge of Hadoop, Spark, or similar technologies.
Illustrative Example: Consider someone switching from HR to data science. They might focus on Python for data manipulation, Tableau for employee performance dashboards, and predictive modeling for attrition rates.
3. Build Practical Experience
Hands-on experience is essential to bridge the gap between theoretical knowledge and real-world application. Begin with projects or internships that simulate industry challenges.
Example: Suppose you’re coming from a finance background. You can build a portfolio project analyzing stock market trends using Python and machine learning models. This project could demonstrate your ability to predict stock prices and identify market anomalies.
Advertisements
4. Leverage Your Domain Knowledge
One of the advantages of transitioning to data science is leveraging expertise from your previous field. Data science applications span industries like healthcare, retail, banking, and entertainment. Your prior experience can set you apart.
Example: An architect transitioning to data science might specialize in urban planning by analyzing spatial data to optimize city layouts or building designs.
5. Learn to Communicate Insights
Data science is not just about crunching numbers; it’s about translating data into actionable insights. Developing storytelling skills through data visualization and presentations is crucial for making your findings accessible to non-technical stakeholders.
Illustrative Scenario: A former journalist moving into data science could excel in creating compelling narratives around consumer behavior trends using data visualizations, making them valuable in media analytics or advertising.
6. Understand the Job Market
Before transitioning, research the job market and identify roles that match your skillset. In 2024, companies are increasingly seeking specialists rather than generalists. Specializations in areas like natural language processing, deep learning, or cloud-based data engineering are highly sought after.
Example: If your current role involves IT systems, transitioning into a cloud data engineering position might be a logical step, given your familiarity with cloud platforms like AWS or Azure.
7. Be Ready for a Learning Curve
Switching to data science is not without challenges. The learning curve can be steep, particularly if your background is not technical. Patience and continuous learning are essential.
Example: Someone from a customer service background might find it challenging to grasp machine learning initially but could ease into data science by focusing on customer behavior analytics.
8. Invest in Networking and Mentorship
Networking is crucial to understanding the nuances of the industry and securing opportunities. Joining data science communities, attending workshops, or seeking mentors can provide guidance and open doors.
Illustrative Example: A lawyer interested in legal tech data science might connect with professionals who work on legal analytics platforms, gaining insights into how machine learning is applied to case law prediction.
Conclusion
Switching to a data science career in 2024 offers immense opportunities but requires thorough preparation. By undserstanding the field, acquiring relevant skills, building practical experience, and leveraging domain expertise, you can position yourself for success. Remember, every step of the transition is an investment in a future-proof career that combines analytical rigor with problem-solving creativity.
Advertisements
دليل مفصل حول ما تحتاج إلى معرفته قبل التحول إلى مهنة علم البيانات
Advertisements
يظل علم البيانات أحد أكثر مسارات العمل طلباً في عام 2024 حيث يوفر فرصاً للعمل في تقاطع التكنولوجيا والأعمال والابتكار، ومع ذلك فإن التحول إلى مهنة في علم البيانات يتطلب أكثر من مجرد الحماس فهو يتطلب التخطيط الاستراتيجي واكتساب المهارات وفهماً واضحاً لتوقعات المجال
فيما يلي دليل مفصل حول ما تحتاج إلى معرفته قبل إجراء هذا التغيير الوظيفي المهم موضحاً بأمثلة لتوفير الوضوح
1.فهم ما يستلزمه علم البيانات
يتضمن علم البيانات استخراج الأفكار والمعرفة القابلة للتنفيذ من البيانات المنظمة وغير المنظمة باستخدام الأدوات والخوارزميات والأساليب الإحصائية ويشمل أدواراً مثل محللي البيانات ومهندسي التعلم الآلي ومهندسي البيانات، قبل الخوض في هذا المجال تأكد من أن لديك فهماً واضحاً للمجال أو الدور المحدد الذي يتماشى مع اهتماماتك
مثال: إذا كنت تنتقل من خلفية تسويقية فقد تجد أن تحليلات البيانات أو استخبارات الأعمال أكثر توافقاً مع خبرتك مع التركيز على تقسيم العملاء أو أداء الحملة
2. اكتساب المهارات اللازمة
:يعتمد النجاح في علم البيانات على المهارات الفنية والتحليلية فتجد أن الكفاءات الأساسية تشمل
SQL أو R أو Python لغات البرمجة: الكفاءة في
الرياضيات والإحصاء: فهم الاحتمالات والجبر الخطي واختبار الفرضيات
التعلم الآلي: الإلمام بالخوارزميات مثل الانحدار الخطي وأشجار القرار والشبكات العصبية
Matplotlib أو Power BI أو Tableau تصور البيانات: الخبرة في أدوات مثل
أو التقنيات المماثلة Spark أو Hadoop أدوات البيانات الضخمة: معرفة
فعلى سبيل المثال: ضع في اعتبارك شخصاً ينتقل من الموارد البشرية إلى علم البيانات فقد يركز على بايثون
للوحات معلومات أداء الموظفين Tableau لمعالجة البيانات وعلى
والنمذجة التنبؤية لمعدلات الاستنزاف
3. بناء الخبرة العملية
إن الخبرة العملية ضرورية لسد الفجوة بين المعرفة النظرية والتطبيق في العالم الحقيقي، ابدأ بالمشاريع أو التدريبات التي تحاكي تحديات الصناعة
مثال: لنفترض أنك قادم من خلفية مالية يمكنك بناء مشروع محفظة لتحليل اتجاهات سوق الأوراق المالية باستخدام بايثون ونماذج التعلم الآلي، ويمكن أن يوضح هذا المشروع قدرتك على التنبؤ بأسعار الأسهم وتحديد الشذوذ في السوق
4. الاستفادة من معرفتك بالمجال
تتمثل إحدى مزايا الانتقال إلى علم البيانات في الاستفادة من الخبرة من مجال عملك السابق، وتمتد تطبيقات علم البيانات إلى صناعات مثل الرعاية الصحية وتجارة التجزئة والخدمات المصرفية والترفيه ويمكن أن تميزك خبرتك السابقة
مثال: قد يتخصص المهندس المعماري الذي ينتقل إلى علم البيانات في التخطيط الحضري من خلال تحليل البيانات المكانية لتحسين تخطيطات المدينة أو تصميمات المباني
Advertisements
5. تعلم كيفية توصيل الأفكار
علم البيانات لا يتعلق فقط بتحليل الأرقام بل يتعلق بترجمة البيانات إلى رؤى قابلة للتنفيذ، إذ أن تطوير مهارات سرد القصص من خلال التصور المرئي للبيانات والعروض التقديمية أمر بالغ الأهمية لجعل النتائج التي توصلت إليها متاحة لأصحاب المصلحة غير الفنيين
سيناريو توضيحي: يمكن لصحفي سابق ينتقل إلى علم البيانات أن يتفوق في إنشاء سرد مقنع حول اتجاهات سلوك المستهلك باستخدام التصور المرئي للبيانات مما يجعلها ذات قيمة في تحليلات الوسائط أو الإعلان
6. فهم سوق العمل
قبل الانتقال ابحث في سوق العمل وحدد الأدوار التي تتناسب مع مجموعة مهاراتك، ففي الوقت الراهن تبحث الشركات بشكل متزايد عن المتخصصين بدلاً من المتخصصين العامين بحيث تعتبر التخصصات في مجالات مثل معالجة اللغة الطبيعية أو التعلم العميق أو هندسة البيانات المستندة إلى السحابة مطلوبة بشدة
مثال: إذا كان دورك الحالي يتضمن أنظمة تكنولوجيا المعلومات فقد يكون الانتقال إلى منصب هندسة البيانات السحابية خطوة منطقية
Azure أو AWS نظراً لمعرفتك بمنصات السحابة مثل
7. كن مستعداً لمنحنى التعلم
التحول إلى علم البيانات ليس بدون تحديات يمكن أن يكون منحنى التعلم حاداً خاصة إذا لم تكن خلفيتك تقنية، لذا الصبر والتعلم المستمر ضروريان
مثال: قد يجد شخص ما من خلفية خدمة العملاء صعوبة في فهم التعلم الآلي في البداية ولكن يمكنه التكيف بسهولة مع علم البيانات من خلال التركيز على تحليلات سلوك العملاء
8. الاستثمار في التواصل والتوجيه
يعد التواصل أمراً بالغ الأهمية لفهم الفروق الدقيقة في الصناعة وتأمين الفرص ويمكن أن يوفر الانضمام إلى مجتمعات علم البيانات أو حضور ورش العمل أو البحث عن مرشدين التوجيه ويفتح الأبواب
مثال توضيحي: قد يتواصل محامٍ مهتم بعلم بيانات التكنولوجيا القانونية مع محترفين يعملون على منصات التحليلات القانونية ويكتسب رؤى حول كيفية تطبيق التعلم الآلي على التنبؤ بقانون القضية
الخلاصة
يوفر التحول إلى مهنة علم البيانات في عام 2024 فرصاً هائلة ولكنه يتطلب إعداداً شاملاً، فمن خلال فهم المجال واكتساب المهارات ذات الصلة وبناء الخبرة العملية والاستفادة من الدومين يمكنك أن تصبح محترفاً في مجال علم البيانات، ومن خلال خبرتك يمكنك أن تضع نفسك في موقف يسمح لك بالنجاح وتذكر أن كل خطوة من خطوات الانتقال هي استثمار في مهنة مستقبلية تجمع بين الدقة التحليلية والإبداع في حل المشكلات
In an era dominated by digital tools, productivity apps are essential for individuals and businesses alike. These apps streamline tasks, enhance focus, and help achieve goals efficiently. In 2024, several productivity apps stand out, offering unique features that cater to diverse needs. Here’s a look at the best apps for productivity this year.
1. Notion: The Ultimate All-in-One Workspace
Notion continues to lead the productivity app market by offering an unparalleled all-in-one workspace. Combining note-taking, task management, and collaboration tools, it’s ideal for personal use and team projects. In 2024, Notion has introduced AI-powered enhancements, such as automated task prioritization and content generation, making it indispensable for professionals juggling multiple responsibilities.
2. Microsoft To Do: Simplifying Task Management
Microsoft To Do excels as a straightforward, user-friendly app for organizing tasks. With seamless integration into Microsoft 365, users can sync their tasks across devices and applications, including Outlook and Teams. Its clean interface and new focus timer feature make it perfect for individuals looking to stay organized without feeling overwhelmed.
3. Trello: Visual Task Management
Trello remains a favorite for teams and individuals who prefer a visual approach to task management. The app’s card-based system allows for easy organization of projects, and its updated automation features in 2024 enable repetitive tasks to be completed effortlessly. With integrations for tools like Slack and Google Drive, Trello continues to be a go-to choice for collaboration.
4. Evernote: The Classic Note-Taking App
Evernote has reinvented itself in 2024 with a suite of new features, including AI-powered search and handwriting recognition. It’s the ideal app for users who want a comprehensive platform to capture ideas, organize notes, and manage documents. The updated interface ensures better usability, keeping Evernote relevant in a competitive market.
5. Focus@Will: Enhancing Concentration with Music
For those who struggle with distractions, Focus@Will is a lifesaver. This app uses scientifically designed music to improve focus and productivity. In 2024, it offers customizable playlists based on personality types and specific tasks, ensuring a distraction-free environment.
Advertisements
6. Slack: Communication for Teams
Slack is more than just a messaging app; it’s a hub for team collaboration. In 2024, Slack has introduced new AI-driven features, including real-time meeting summaries and task generation from chat discussions. With its ability to integrate with tools like Google Workspace, Trello, and Salesforce, Slack enhances productivity for businesses of all sizes.
7. Todoist: Comprehensive Task Management
Todoist is a powerful app for tracking tasks and setting goals. Its intuitive design and gamification features, like productivity streaks, motivate users to stay consistent. In 2024, Todoist’s new priority ranking system helps users tackle urgent tasks effectively, making it a favorite among busy professionals.
8. RescueTime: Tracking and Improving Productivity
RescueTime is the go-to app for those seeking to understand and optimize how they spend their time. With real-time productivity tracking and detailed analytics, it identifies unproductive habits. The 2024 version includes an improved focus mode that temporarily blocks distracting apps and websites, ensuring uninterrupted work.
9. Zapier: Automating Workflows
Zapier simplifies productivity by automating repetitive tasks across different apps. In 2024, Zapier has expanded its compatibility to over 5,000 apps and introduced AI-based workflow suggestions. This allows users to save time and focus on high-value tasks without worrying about mundane processes.
10. Google Workspace: Collaborative Suite
Google Workspace remains an essential productivity tool, offering apps like Google Docs, Sheets, and Drive. In 2024, enhanced AI-powered features, such as smart suggestions and automated data analysis in Sheets, make this suite indispensable for businesses and students. Its cloud-based nature ensures easy collaboration and accessibility.
Conclusion
The best productivity apps in 2024 combine powerful features with ease of use, ensuring individuals and teams can work smarter, not harder. Whether it’s managing tasks, enhancing focus, or automating workflows, these tools cater to various productivity needs. Adopting the right apps can make a significant difference, empowering users to achieve their goals more efficiently.
Advertisements
نظرة على أفضل التطبيقات المفيدة لتحسين الإنتاج لهذا العام
Advertisements
في عصر تهيمن عليه الأدوات الرقمية تعد تطبيقات الإنتاجية ضرورية للأفراد والشركات على حد سواء، إذ تعمل هذه التطبيقات على تبسيط المهام وتعزيز التركيز والمساعدة في تحقيق الأهداف بكفاءة
في عام 2024 تبرز العديد من تطبيقات الإنتاجية وتقدم ميزات فريدة تلبي احتياجات متنوعة
إليك نظرة على أفضل تطبيقات الإنتاجية هذا العام
1. مساحة العمل الشاملة المثالية :Notion
يواصل هذا التطبيق قيادة سوق تطبيقات الإنتاجية من خلال تقديم مساحة عمل شاملة لا مثيل لها، من خلال الجمع بين تدوين الملاحظات وإدارة المهام وأدوات التعاون فهو مثالي للاستخدام الشخصي ومشاريع الفريق
في عام 2024 قدم هذا التطبيق تحسينات مدعومة بالذكاء الاصطناعي مثل تحديد أولويات المهام تلقائياً وإنشاء المحتوى مما يجعله لا غنى عنه للمحترفين الملتزمون بمسؤوليات متعددة
2. تبسيط إدارة المهام :Microsoft To Do
،يتميز هذا التطبيق بأنه مباشر وسهل الاستخدام لتنظيم المهام
Microsoft 365 فبفضل التكامل السلس مع
يمكن للمستخدمين مزامنة مهامهم عبر الأجهزة والتطبيقات
تجعله واجهته السهلة Teams و Outlook بما في ذلك
وميزة مؤقت التركيز الجديدة مثالياً للأفراد الذين يتطلعون إلى البقاء منظمين دون الشعور بالإرهاق
3. إدارة المهام المرئية :Trello
يظل هذا التطبيق المفضل لدى الفرق والأفراد الذين يفضلون النهج المرئي لإدارة المهام، إذ يسمح نظام التطبيق القائم على البطاقات بتنظيم المشاريع بسهولة وتمكن ميزات الأتمتة المحدثة في عام 2024 من إكمال المهام المتكررة دون عناء
Slack و Google Drive مع التكامل مع أدوات مثل
خياراً مفضلاً لتنسيق والتكامل بين أفراد الفريق Trello يظل
4. تطبيق تدوين الملاحظات الكلاسيكي :Evernote
أعاد هذا التطبيق اختراع نفسه في عام 2024 بمجموعة من الميزات الجديدة بما في ذلك البحث المدعوم بالذكاء الاصطناعي والتعرف على الكتابة اليدوية، إنه التطبيق المثالي للمستخدمين الذين يريدون منصة شاملة لالتقاط الأفكار وتنظيم الملاحظات وإدارة المستندات، بحيث تضمن الواجهة المحدثة قابلية استخدام أفضل مما يجعل لهذا التطبيق مكانة جيدة في السوق التنافسية
5. تعزيز التركيز بالموسيقى : Focus@Will
بالنسبة لأولئك الذين يعانون من التشتيت فإن هذا التطبيق هو المنقذ، إذ يستخدم هذا التطبيق موسيقى مصممة علمياً لتحسين التركيز والإنتاجية
في عام 2024 يقدم هذا التطبيق قوائم تشغيل قابلة للتخصيص بناءً على أنواع الشخصية والمهام المحددة مما يضمن بيئة خالية من الفوضى والتشتت
Advertisements
6. للتواصل مع باقي أعضاء الفريق :Slack
هذا التطبيق هو أكثر من مجرد تطبيق مراسلة، إنه ببساطة مركز للتعاون الجماعي في عام 2024 قدم هذا التطبيق ميزات جديدة مدفوعة بالذكاء الاصطناعي بما في ذلك ملخصات الاجتماعات في الوقت الفعلي وإنشاء المهام من مناقشات الدردشة، فمع قدرته على التكامل
Workspace وTrello وSalesforce :مع أدوات مثل
فهو يعزز الإنتاجية للشركات من جميع الأحجام
7. إدارة المهام الشاملة :Todoist
هو تطبيق قوي لتتبع المهام وتحديد الأهداف، فتصميمه البديهي وميزاته الممتعة مثل خطوط الإنتاجية تحفز المستخدمين على البقاء منظمين
في عام 2024 يساعد نظام ترتيب الأولويات الجديد من هذا التطبيق المستخدمين على معالجة المهام العاجلة بشكل فعال مما يجعله المفضل بين المحترفين
8. تتبع وتحسين الإنتاجية :RescueTime
هو التطبيق المفضل لأولئك الذين يسعون إلى فهم وتحسين كيفية قضاء وقتهم، فمن خلال تتبع الإنتاجية في الوقت الفعلي والتحليلات التفصيلية فإنه يحدد العادات غير المنتجة
يتضمن إصدار 2024 وضع تركيز محسّن يحظر مؤقتاً التطبيقات ومواقع الويب المشتتة للانتباه مما يضمن العمل بتركيز ودون انقطاع
9. أتمتة سير العمل :Zapier
يبسط هذا التطبيق الإنتاجية من خلال أتمتة المهام المتكررة عبر تطبيقات مختلفة، ففي عام 2024 وسع هذا التطبيق توافقه ليشمل أكثر من 5000 تطبيق وقدم اقتراحات سير العمل قائمة على الذكاء الاصطناعي مما يتيح للمستخدمين توفير الوقت والتركيز على المهام ذات القيمة العالية
10. Google Workspace: Collaborative Suite
أداة إنتاجية أساسية Google Workspace يظل
Driveو Sheetsو Google Docs بحيث يوفر تطبيقات مثل
في عام 2024 ستجعل الميزات المدعومة بالذكاء الاصطناعي مثل الاقتراحات الذكية وتحليل البيانات الآلي في جداول البيانات هذه المجموعة لا غنى عنها للشركات والطلاب، بحيث تضمن طبيعتها المستندة إلى السحابة التعاون السهل وإمكانية الوصول
الخلاصة
تجمع أفضل تطبيقات الإنتاجية في عام 2024 بين الميزات القوية وسهولة الاستخدام مما يضمن للأفراد والفرق العمل بذكاء وليس بجهد أكبر، فسواء كان الأمر يتعلق بإدارة المهام أو تعزيز التركيز أو أتمتة سير العمل فإن هذه الأدوات تلبي احتياجات الإنتاجية المختلفة، بحيث يمكن أن يحدث تبني التطبيقات المناسبة فرقاً كبيراً مما يمكّن المستخدمين من تحقيق أهدافهم بكفاءة أكبر
In the realm of software development, Python stands out as a versatile and widely adopted programming language. Its simplicity and readability make it a favorite among both beginners and experienced developers. However, when it comes to senior-level Python interview questions, the expectations are much higher. Interviewers often craft challenging problems that test not only a candidate’s coding skills but also their deep understanding of the language’s internals, design principles, and problem-solving strategies. One such question has reportedly stumped many seasoned developers, showcasing the complexity of advanced Python concepts.
The Question: A Tricky Problem in Python
Imagine you are presented with the following problem during an interview:
Write a function to identify duplicate integers in a list, returning them in the order they first appear. The function should be efficient in terms of time and space complexity.
For example:
On the surface, the problem seems straightforward. However, achieving the optimal balance between correctness and efficiency is where most candidates struggle.
Common Pitfalls
Inefficient Solutions Many developers jump into the solution by iterating through the list multiple times, using nested loops or structures like list.count().While these approaches yield correct results, they are computationally expensive, leading to a time complexity of O(n2).
Overlooking Order Another frequent mistake is using a set to track duplicates, as sets do not maintain order in Python versions prior to 3.7. While this ensures duplicates are identified, it violates the requirement to preserve the order of first appearance.
Mismanaging Space Complexity Candidates often use additional data structures unnecessarily, leading to bloated space complexity. Efficient senior-level solutions must strike a balance between time and space usage.
Advertisements
The Optimal Solution
The optimal approach combines a set and a list to efficiently track duplicates while preserving their order:
Explanation:
A set called seen keeps track of all numbers encountered so far.
A list called duplicates ensures the order of first appearance.
The loop checks each number, adding it to duplicates only if it is not already present in that list.
Time Complexity:O(n) — The loop processes each element exactly once. Space Complexity:O(n) — The set and list grow with the input size.
Why Many Fail
Overthinking the Problem Senior developers often anticipate hidden traps and over-engineer their solutions, leading to convoluted, error-prone code.
Lack of Familiarity with Python Internals Understanding how set operations and list indexing work is crucial. Developers who lack this knowledge struggle to design optimal solutions.
Pressure in Interviews The stress of performing under time constraints often leads to hasty decisions and overlooked requirements.
Lessons Learned
This deceptively simple question highlights key principles for success in senior-level Python roles:
Master the Basics: A deep understanding of fundamental data structures like sets, lists, and dictionaries is crucial.
Practice Problem-Solving: Regularly tackling algorithmic problems sharpens the ability to write efficient, clean code.
Focus on Clarity: In interviews, clear and concise solutions are as important as correctness.
Failing this question does not reflect a developer’s inadequacy but rather underscores areas for growth. Embracing challenges like this helps developers refine their skills and advance their careers.
Senior-level Python questions like this one reveal the beauty and complexity of the language. Mastering them not only showcases expertise but also builds confidence in tackling real-world problems.
Advertisements
ما هو السؤال الذي فشل معظم المطورين في الإجابة عليه في مقابلة بايثون
Advertisements
في عالم تطوير البرمجيات تبرز بايثون كلغة برمجة متعددة الاستخدامات ومعتمدة على نطاق واسع تجعلها بساطتها وسهولة قراءتها مفضلة بين المبتدئين والمطورين ذوي الخبرة، ومع ذلك عندما يتعلق الأمر بأسئلة المقابلة الشخصية لمستوى كبار المطورين في بايثون تكون التوقعات أعلى بكثير
غالباً ما يصمم المحاورون مشكلات صعبة لا تختبر مهارات الترميز لدى المرشح فحسب بل وأيضاً فهمه العميق لداخليات اللغة ومبادئ التصميم واستراتيجيات حل المشكلات، يقال إن أحد هذه الأسئلة حير العديد من المطورين المخضرمين مما أظهر تعقيد مفاهيم بايثون المتقدمة
السؤال: مشكلة صعبة في بايثون
:تخيل أنك واجهت المشكلة التالية أثناء المقابلة
اكتب دالة لتحديد الأعداد الصحيحة المكررة في قائمة وإعادتها بالترتيب الذي تظهر به أولاً، يجب أن تكون الدالة فعالة من حيث تعقيد الوقت والمساحة
:على سبيل المثال
ظاهرياً تبدو المشكلة واضحة، ومع ذلك فإن تحقيق التوازن الأمثل بين الصحة والكفاءة هو المكان الذي يرتبك فيه معظم المرشحين
الأخطاء الشائعة
1. الحلول غير الفعّالة
يقفز العديد من المطورين إلى الحل من خلال تكرار القائمة عدة مرات
list.count(). باستخدام حلقات متداخلة أو هياكل مثل
وفي حين أن هذه الأساليب تعطي نتائج صحيحة إلا أنها مكلفة حسابياً
O(n2) مما يؤدي إلى تعقيد زمني
2. تجاهل الترتيب
لتتبع التكرارات set هناك خطأ شائع آخر وهو استخدام
حيث لا تحافظ المجموعات على الترتيب في إصدارات بايثون
3.7. السابقة للإصدار
وفي حين يضمن هذا تحديد التكرارات فإنه ينتهك متطلب الحفاظ على ترتيب الظهور الأول
Advertisements
3. سوء إدارة تعقيد المساحة
غالباً ما يستخدم المرشحون هياكل بيانات إضافية دون داعٍ مما يؤدي إلى تعقيد المساحة، يجب أن تحقق الحلول الفعّالة على مستوى كبار الموظفين توازناً بين استخدام الوقت والمساحة
الحل الأمثل
list و set يجمع النهج الأمثل بين
:لتتبع التكرارات بكفاءة مع الحفاظ على ترتيبها
:التفسير
تتبع جميع الأرقام التي تم مواجهتها حتى الآن seen التي تسمى set
تضمن ترتيب الظهور الأول duplicates التي تسمى list
duplicates تتحقق الحلقة من كل رقم وتضيفه إلى
فقط إذا لم يكن موجوداً بالفعل في تلك القائمة
تعالج الحلقة كل عنصر مرة واحدة بالضبط O(n) :تعقيد الوقت
مع حجم الإدخال listو set تنمو كل من O(n) :تعقيد المساحة
لماذا يفشل الكثيرون
1. التفكير المفرط في المشكلة
غالباً ما يتوقع المطورون الكبار الفخاخ الخفية ويبالغون في هندسة حلولهم مما يؤدي إلى أكواد معقدة وعرضة للخطأ
2. عدم الإلمام بتفاصيل بايثون الداخلية
وفهرسة القائمة set إن فهم كيفية عمل عمليات
أمر بالغ الأهمية ويكافح المطورون الذين يفتقرون إلى هذه المعرفة لتصميم حلول مثالية
3. الضغط في المقابلات
غالباً ما يؤدي الضغط الناتج عن الأداء في ظل قيود الوقت إلى اتخاذ قرارات متسرعة وتجاهل المتطلبات
الدروس المستفادة
يسلط هذا السؤال البسيط الخادع الضوء على المبادئ الأساسية للنجاح في أدوار بايثون على مستوى كبار الموظفين
إتقان الأساسيات: يعد الفهم العميق لهياكل البيانات الأساسية مثل المجموعات والقوائم والقواميس أمراً بالغ الأهمية
ممارسة حل المشكلات: إن معالجة المشكلات الخوارزمية بانتظام تزيد من القدرة على كتابة أكواد فعالة ونظيفة
التركيز على الوضوح: في المقابلات تعد الحلول الواضحة والموجزة بنفس أهمية الدقة
إن الفشل في هذا السؤال لا يعكس عدم كفاءة المطور بل إنه يسلط الضوء على مجالات النمو، إذ يساعد احتضان تحديات مثل هذا المطورين على صقل مهاراتهم وتطوير حياتهم المهنية
تكشف أسئلة بايثون على مستوى كبار الموظفين مثل هذا السؤال عن جمال وتعقيد اللغة، بحيث أن إتقانها لا يُظهر الخبرة فحسب بل يبني أيضاً الثقة في معالجة مشاكل العالم الحقيقي.
In an age where artificial intelligence (AI) is rapidly evolving and becoming more integrated into our daily lives, tools like ChatGPT have emerged as powerful resources for information, creativity, and problem-solving. However, many users are not leveraging this tool to its fullest potential, often due to a common mistake: a lack of specificity in their queries.
The Importance of Specificity
The #1 mistake that 99% of users make when using ChatGPT is asking vague or overly general questions. This lack of clarity can lead to responses that are equally ambiguous, failing to address the user’s actual needs. AI models thrive on context, and the more information you provide, the better the results you will receive. For instance, asking “Tell me about history” will yield a broad, unfocused response, while asking “Can you summarize the causes of World War II?” directs the model to provide a concise and relevant answer.
How Specific Queries Enhance Responses
When users articulate their questions with specific details, they set the stage for more tailored and useful answers. This specificity acts as a guide, enabling the AI to understand the user’s intent and the context of their inquiry. For example, if a user wants to write an essay on climate change, specifying the aspects they want to focus on—such as its effects on agriculture or policy responses—can lead to a far more engaging and informative interaction.
Moreover, specific queries can help users achieve their goals more effectively. Whether seeking assistance with creative writing, troubleshooting technical issues, or gathering research for a project, providing detailed background information or context can significantly enhance the quality of the output.
Advertisements
Examples of Effective Questions
To illustrate the impact of specificity, let’s compare a few examples:
Vague Query: “What can you tell me about technology?”
Specific Query: “What are the key technological advancements in renewable energy over the past decade?”
Vague Query: “Give me tips on writing.”
Specific Query: “What are some effective strategies for writing a compelling personal statement for college applications?”
Vague Query: “Explain artificial intelligence.”
Specific Query: “Can you explain the difference between supervised and unsupervised learning in artificial intelligence?”
In each specific query, the user provides clear context, allowing ChatGPT to generate focused and informative responses that directly address the inquiry.
Conclusion
As we continue to explore the capabilities of AI tools like ChatGPT, it is crucial for users to recognize and avoid the common pitfall of vagueness. By asking specific, detailed questions, users can unlock the full potential of this technology, ensuring that they receive the most relevant and useful information possible. The next time you interact with ChatGPT, remember that specificity is key—by refining your questions, you’ll enhance your experience and make the most of this powerful tool.
Advertisements
بطريقة خاطئةChatGPT تسع وتسعون بالمئة من مستخدمي
ما هو الخطأ الأكثر شيوعاً الذي يجب أن تعرفه
Advertisements
في عصر يتطور فيه الذكاء الاصطناعي بسرعة ويصبح أكثر تكاملاً مع حياتنا اليومية
ChatGPT ظهرت أدوات مثل
كموارد قوية للمعلومات والإبداع وحل المشكلات، ومع ذلك لا يستفيد العديد من المستخدمين من هذه الأداة إلى أقصى إمكاناتها وغالباً ما يكون ذلك بسبب خطأ شائع مفاده الافتقار إلى التحديد في استفساراتهم
أهمية الدقة في الإدخالات
الخطأ الأكثر شيوعاً الذي يرتكبه 99% من المستخدمين
هو طرح أسئلة غامضة أو عامة للغاية ChatGPT عند استخدام
يمكن أن يؤدي هذا الافتقار إلى الوضوح إلى استجابات غامضة بنفس القدر تفشل في معالجة الاحتياجات الفعلية للمستخدم، وبالمقابل تزداد كفاءة نماذج الذكاء الاصطناعي بحسب الإدخالات الدقيقة، فكلما زادت المعلومات التي تقدمها كانت النتائج التي ستحصل عليها أفضل، على سبيل المثال سيؤدي طرح سؤال “أخبرني عن التاريخ” إلى استجابة واسعة وغير محددة بينما يوجه طرح سؤال “هل يمكنك تلخيص أسباب الحرب العالمية الثانية؟” النموذج لتقديم إجابة موجزة وذات صلة
كيف تعزز الاستعلامات المحددة الاستجابات
عندما يصوغ المستخدمون أسئلتهم بتفاصيل محددة فإنهم يمهدون الطريق لإجابات أكثر تفصيلاً وفائدة، فتعمل هذه الخصوصية كدليل مما يتيح للذكاء الاصطناعي فهم نية المستخدم وسياق استفساره، على سبيل المثال إذا أراد المستخدم كتابة مقال عن تغير المناخ فإن تحديد الجوانب التي يريد التركيز عليها – مثل تأثيراته على الزراعة أو استجابات السياسة – يمكن أن يؤدي إلى تفاعل أكثر جاذبية وإعلاماً
وعلاوة على ذلك يمكن أن تساعد الاستعلامات المحددة المستخدمين على تحقيق أهدافهم بشكل أكثر فعالية سواء كان الأمر يتعلق بطلب المساعدة في الكتابة الإبداعية أو استكشاف المشكلات الفنية أو جمع الأبحاث لمشروع ما فإن تقديم معلومات خلفية مفصلة أو سياق يمكن أن يعزز بشكل كبير من جودة الناتج
Advertisements
أمثلة على الأسئلة الفعّالة
:لتوضيح تأثير الخصوصية دعونا نقارن بعض الأمثلة
الاستعلام الغامض: “ماذا يمكنك أن تخبرني عن التكنولوجيا؟” *
الاستعلام المحدد: “ما هي التطورات التكنولوجية الرئيسية في مجال الطاقة المتجددة على مدى العقد الماضي؟”
الاستعلام الغامض: “أعطني نصائح حول الكتابة” *
الاستعلام المحدد: “ما هي بعض الاستراتيجيات الفعّالة لكتابة بيان شخصي مقنع للتقديم إلى الكلية؟”
الاستعلام الغامض: “اشرح الذكاء الاصطناعي” *
استعلام محدد: “هل يمكنك شرح الفرق بين التعلم الخاضع للإشراف والتعلم غير الخاضع للإشراف في الذكاء الاصطناعي؟”
في كل استعلام محدد يقدم المستخدم سياقاً واضحاً
بإنشاء استجابات مركزة وغنية ChatGPT مما يسمح لـ
بالمعلومات تعالج الاستفسار بشكل مباشر
الخلاصة
مع استمرارنا في استكشاف قدرات أدوات
ChatGPT الذكاء الاصطناعي مثل
من الأهمية بمكان أن يتعرف المستخدمون على الفخ الشائع المتمثل في الغموض وتجنبه من خلال طرح أسئلة محددة ومفصلة إذ يمكن للمستخدمين إطلاق العنان للإمكانات الكاملة لهذه التكنولوجيا مما يضمن حصولهم على المعلومات الأكثر صلة وفائدة ممكنة
ChatGPT في المرة القادمة التي تتفاعل فيها مع
تذكر أن دقة الإدخال هي المفتاح فمن خلال تحسين أسئلتك ستعزز تجربتك وتستفيد إلى أقصى حد من هذه الأداة القوية
In today’s data-driven world, the demand for data scientists has surged. Companies across industries seek professionals who can analyze vast amounts of data to extract meaningful insights, drive decision-making, and foster innovation. With the advent of advanced tools like ChatGPT, aspiring data scientists can harness artificial intelligence to accelerate their learning journey. This comprehensive guide explores how to become a data scientist using ChatGPT, outlining essential skills, resources, and practical steps to achieve success in this field.
1. Understanding the Role of a Data Scientist
Before embarking on the path to becoming a data scientist, it’s crucial to understand the role’s core responsibilities. Data scientists combine statistical analysis, programming, and domain expertise to interpret complex data sets. Their work involves data collection, cleaning, visualization, and applying machine learning algorithms to develop predictive models. Strong communication skills are also essential, as data scientists must convey their findings to non-technical stakeholders.
2. Essential Skills for Data Scientists
To thrive as a data scientist, one must develop a blend of technical and soft skills:
Programming Languages: Proficiency in programming languages such as Python and R is fundamental for data manipulation and analysis. ChatGPT can assist by providing coding examples, explaining syntax, and troubleshooting common programming issues.
Statistical Analysis: Understanding statistical concepts and methodologies is crucial for interpreting data accurately. Using ChatGPT, learners can explore statistical theories, ask for clarifications, and practice problem-solving.
Data Visualization: Data scientists must be adept at visualizing data to communicate insights effectively. Tools like Matplotlib, Seaborn, or Tableau are essential. ChatGPT can recommend visualization techniques and help users understand how to implement them.
Machine Learning: Familiarity with machine learning algorithms, their applications, and limitations is vital. ChatGPT can explain various algorithms, guide users through the implementation process, and suggest resources for deeper learning.
Domain Knowledge: Having domain-specific knowledge allows data scientists to contextualize their findings. ChatGPT can assist users in researching specific industries, trends, and challenges.
Advertisements
3. Learning Resources
To become a proficient data scientist, leveraging online resources is essential. Here’s how ChatGPT can enhance the learning experience:
Online Courses: Platforms like Coursera, edX, and Udacity offer specialized courses in data science. ChatGPT can help users choose courses based on their current skill levels and learning goals.
Books and Articles: Reading foundational texts such as “An Introduction to Statistical Learning” or “Python for Data Analysis” provides in-depth knowledge. ChatGPT can summarize concepts or discuss key points from these resources.
Interactive Learning: Websites like Kaggle offer hands-on data science projects. Users can ask ChatGPT for project ideas, guidance on data sets, and tips for competition participation.
Communities and Forums: Engaging with online communities, such as Stack Overflow or Reddit’s data science threads, is invaluable for networking and problem-solving. ChatGPT can help users navigate these platforms and formulate questions for discussions.
4. Practical Steps to Build Experience
Gaining practical experience is crucial in the journey to becoming a data scientist. Here’s how to leverage ChatGPT for this purpose:
Personal Projects: Starting personal projects allows users to apply their skills and create a portfolio. ChatGPT can suggest project ideas based on interests and help users outline project plans.
Collaborative Work: Collaborating with peers on data science projects fosters teamwork and broadens perspectives. ChatGPT can assist in forming project groups and facilitating communication.
Internships and Job Opportunities: Seeking internships or entry-level positions provides real-world experience. ChatGPT can guide users on how to craft impactful resumes, prepare for interviews, and network effectively.
5. Continuous Learning and Adaptation
Data science is an ever-evolving field. Continuous learning is vital to stay current with the latest trends and technologies. ChatGPT can support users in various ways:
Stay Updated: Following industry news and advancements is essential. ChatGPT can summarize articles, suggest relevant blogs, and recommend thought leaders to follow.
Advanced Topics: Exploring advanced topics like deep learning, natural language processing, and big data analytics can set users apart. ChatGPT can recommend advanced courses and resources to dive deeper into these subjects.
Feedback and Improvement: Seeking feedback on projects and analyses is crucial for growth. ChatGPT can provide constructive feedback on data visualizations and models based on user inputs.
Conclusion
Becoming a data scientist is a rewarding journey filled with opportunities for growth and innovation. By harnessing the power of ChatGPT, aspiring data scientists can streamline their learning process, gain practical experience, and develop the skills necessary to excel in this dynamic field. With dedication, continuous learning, and the right resources, anyone can embark on a successful career in data science and contribute to the ever-expanding world of data-driven decision-making.
Advertisements
ChatGPTدليلك الشامل لتصبح عالِم بيانات باستخدام
Advertisements
في عالم اليوم الذي تحركه البيانات ارتفع الطلب على علماء البيانات بشكل كبير، إذ تبحث الشركات في مختلف الصناعات عن محترفين يمكنهم تحليل كميات هائلة من البيانات لاستخراج رؤى ذات مغزى ودفع عملية اتخاذ القرار وتعزيز الابتكار
ChatGPT مع ظهور أدوات متقدمة مثل
يمكن لعلماء البيانات الطموحين الاستفادة من الذكاء الاصطناعي لتسريع رحلة التعلم الخاصة بهم
ChatGPT يستكشف هذا الدليل الشامل كيفية أن تصبح عالم بيانات باستخدام
ويحدد المهارات الأساسية والموارد والخطوات العملية لتحقيق النجاح في هذا المجال
1. فهم دور عالم البيانات
قبل الشروع في مسار التحول إلى عالم بيانات من الضروري فهم المسؤوليات الأساسية للدور يجمع علماء البيانات بين التحليل الإحصائي والبرمجة والخبرة في المجال لتفسير مجموعات البيانات المعقدة يتضمن عملهم جمع البيانات وتنظيفها وتصورها وتطبيق خوارزميات التعلم الآلي لتطوير نماذج تنبؤية، وتعد مهارات الاتصال القوية ضرورية أيضاً حيث يجب على علماء البيانات نقل نتائجهم إلى أصحاب المصلحة غير الفنيين
2. المهارات الأساسية لعلماء البيانات
:لكي تنجح كعالم بيانات يجب عليك تطوير مزيج من المهارات التقنية والمرنة
Rلغات البرمجة: إتقان لغات البرمجة مثل بايثون و
أمر أساسي لمعالجة البيانات وتحليلها
من خلال توفير أمثلة الترميز ChatGPT إذ يمكن أن يساعد
وشرح بناء الجملة واستكشاف مشكلات البرمجة الشائعة وإصلاحها
التحليل الإحصائي: يعد فهم المفاهيم والمنهجيات الإحصائية أمراً بالغ الأهمية
ChatGPT لتفسير البيانات بدقة باستخدام
فيمكن للمتعلمين استكشاف النظريات الإحصائية وطلب التوضيحات وممارسة حل المشكلات
تصور البيانات: يجب أن يكون علماء البيانات بارعين في تصور البيانات للتواصل بشكل فعال
ضرورية Matplotlib أو Seaborn أو Tableau :وتعد الأدوات مثل
التوصية بتقنيات التصور ومساعدة المستخدمين على فهم كيفية تنفيذها ChatGPT ويمكن لـ
شرح خوارزميات مختلفة وتوجيه المستخدمين ChatGPT يمكن لـ
خلال عملية التنفيذ واقتراح موارد للتعلم العميق
معرفة المجال: إن امتلاك معرفة محددة بالمجال يسمح لعلماء البيانات بوضع نتائجهم في سياقها الصحيح
مساعدة المستخدمين في البحث ChatGPT فيمكن لـ
عن صناعات واتجاهات وتحديات محددة
Advertisements
3. موارد التعلم
لكي تصبح عالم بيانات ماهر فإن الاستفادة من الموارد عبر الإنترنت أمر ضروري
:تعزيز تجربة التعلم ChatGPT وإليك كيف يمكن لـ
:الدورات التدريبية عبر الإنترنت
دورات متخصصة في علم البيانات Coursera و edX و Udacity :تقدم منصات مثل
مساعدة المستخدمين في اختيار الدورات التدريبية ChatGPT ويمكن لـ
بناءً على مستويات مهاراتهم الحالية وأهداف التعلم
الكتب والمقالات: توفر قراءة النصوص الأساسية مثل “مقدمة إلى التعلم الإحصائي” أو “بايثون لتحليل البيانات” معرفة متعمقة
تلخيص المفاهيم أو مناقشة النقاط الرئيسية من هذه الموارد ChatGPT فيمكن لـ
مشاريع علمية عملية للبيانات Kaggle التعلم التفاعلي: تقدم مواقع الويب مثل
ChatGPT يمكن للمستخدمين أن يطلبوا من
أفكاراً للمشروعات وإرشادات حول مجموعات البيانات ونصائح للمشاركة في المنافسة
المجتمعات والمنتديات: يعد التفاعل مع المجتمعات عبر الإنترنت
Stack Overflow أو Reddit’s data science threads مثل
أمراً لا يقدر بثمن للتواصل وحل المشكلات
المستخدمين ChatGPT ويمكن أن يساعد
في التنقل عبر هذه المنصات وصياغة الأسئلة للمناقشات
4. خطوات عملية لبناء الخبرة
يعد اكتساب الخبرة العملية أمراً بالغ الأهمية في الرحلة إلى أن تصبح عالم بيانات
لهذا الغرض ChatGPT إليك كيفية الاستفادة من
المشاريع الشخصية: يتيح بدء المشاريع الشخصية للمستخدمين تطبيق مهاراتهم
اقتراح أفكار المشاريع ChatGPT وإنشاء محفظة يمكن لـ
بناءً على الاهتمامات ومساعدة المستخدمين في تحديد خطط المشروع
العمل التعاوني: يعزز التعاون مع الأقران في مشاريع علوم البيانات العمل الجماعي ويوسع آفاق العمل
المساعدة في تشكيل مجموعات المشاريع وتسهيل التواصل ChatGPT ويمكن لـ
التدريب وفرص العمل: يوفر البحث عن التدريب أو الوظائف المبتدئة خبرة في العالم الحقيقي
توجيه المستخدمين حول كيفية صياغة السيرة الذاتية ChatGPT يمكن لـ
المؤثرة والاستعداد للمقابلات والتواصل بشكل فعال
5. التعلم المستمر والتكيف
يعد علم البيانات مجالاً متطوراً باستمرار ويعد التعلم المستمر أمراً حيوياً لمواكبة أحدث الاتجاهات والتقنيات
: دعم المستخدمين بطرق مختلفة ChatGPT يمكن لـ
البقاء على اطلاع: يعد متابعة أخبار الصناعة والتطورات أمراً ضرورياً
تلخيص المقالات ChatGPT يمكن لـ
واقتراح المدونات ذات الصلة والتوصية بقادة الفكر لمتابعتهم
الموضوعات المتقدمة: يمكن أن يميز استكشاف الموضوعات المتقدمة مثل التعلم العميق ومعالجة اللغة الطبيعية وتحليلات البيانات الضخمة المستخدمين
التوصية بدورات وموارد متقدمة للتعمق في هذه الموضوعات ChatGPT ويمكن لـ
الملاحظات والتحسينات: يعد البحث عن الملاحظات حول المشاريع والتحليلات أمراً بالغ الأهمية للنمو
توفير ردود الفعل الفعّالة على تصورات البيانات ChatGPT ويمكن لـ
والنماذج القائمة على مدخلات المستخدم
الخلاصة
إن التحول إلى عالم بيانات هو رحلة مجزية مليئة بفرص النمو والابتكار
يمكن لعلماء البيانات الطموحين ChatGPT فمن خلال الاستفادة من قوة
تبسيط عملية التعلم الخاصة بهم واكتساب الخبرة العملية وتطوير المهارات اللازمة للتفوق في هذا المجال الديناميكي، فمع التفاني والتعلم المستمر والموارد المناسبة يمكن لأي شخص الشروع في مهنة ناجحة في علم البيانات والمساهمة في عالم اتخاذ القرار القائم على البيانات المتوسع باستمرار
Spotify is among the world’s top streaming platforms, with data science playing a critical role in personalizing user experiences, optimizing recommendations, and driving business decisions. Spotify’s data scientists must analyze large datasets, recognize patterns, and draw meaningful insights. Here’s a five-step guide to the essential skills and processes involved in the role of a Spotify data scientist, including data gathering, data cleaning, exploratory analysis, model building, and visualization.
Step 1: Data Gathering – Collecting and Understanding the Data
The first and most crucial step in any data science process is gathering relevant data. At Spotify, data scientists work with various data types such as user listening history, song metadata, and platform interactions. The data is collected from multiple sources including user interaction logs, music track metadata, and external APIs. Spotify data scientists use platforms like Hadoop and Spark to handle and store data efficiently due to its large volume and need for scalability.
Key Techniques and Tools
Hadoop and Spark: To handle massive data streams.
SQL: For querying databases and performing data extraction.
Python: For managing datasets and preliminary analysis.
Step 2: Data Cleaning – Preparing the Data for Analysis
Raw data is rarely ready for analysis right off the bat. Data cleaning is a crucial phase that involves filtering out incomplete, incorrect, or irrelevant data to ensure accuracy. For example, Spotify data scientists may remove duplicate songs, clean incomplete user profiles, or format timestamps.
Key Techniques and Tools
Python libraries (e.g., Pandas): For cleaning, filtering, and organizing data.
Regular Expressions (Regex): For text data cleaning.
Handling Missing Values: By techniques like interpolation or mean imputation.
Advertisements
Step 3: Exploratory Data Analysis (EDA) – Identifying Patterns and Trends
EDA is essential for understanding the data’s structure and identifying any underlying trends. Spotify data scientists might analyze user behavior by examining listening habits, peak streaming times, or song genre preferences. This phase helps generate hypotheses and prepare the dataset for model building.
Key Techniques and Tools
Matplotlib and Seaborn: For creating visualizations like histograms and scatter plots.
Feature Engineering: Generating new variables that capture significant patterns in data.
Statistical Analysis: Using basic statistics to detect outliers and establish relationships.
Step 4: Model Building – Creating Algorithms to Make Predictions
The core of Spotify’s personalized recommendations lies in machine learning models that predict user preferences. Spotify data scientists utilize collaborative filtering, natural language processing (NLP), and neural networks to build recommendation systems. A/B testing is also often employed to evaluate different model configurations.
Key Techniques and Tools
Scikit-Learn and TensorFlow: For building machine learning models.
Collaborative Filtering: To find patterns in user preferences based on listening history.
NLP: For processing song lyrics and generating playlists that fit user tastes.
Step 5: Visualization and Reporting – Communicating Insights
After building and fine-tuning models, data scientists at Spotify present their findings to various stakeholders. Visualization tools are crucial in making the results understandable and actionable. Spotify data scientists use dashboards and visual reports to display trends, model accuracy, and recommendations.
Key Techniques and Tools
Tableau and PowerBI: For interactive dashboards and reports.
Presentation Skills: To communicate findings effectively to non-technical audiences.
Visualization Techniques: Like heatmaps, line charts, and bar charts.
Conclusion
A Spotify data scientist’s role is both challenging and rewarding, with each of the five steps being integral to the entire data science workflow. Mastering each step helps data scientists provide Spotify users with personalized recommendations and the best possible experience. By developing skills in data gathering, cleaning, EDA, model building, and visualization, aspiring data scientists can make an impactful contribution to music streaming innovation at Spotify.
Advertisements
Spotifyدليل كامل لعلماء البيانات في
خمس خطوات يجب القيام بها عند بدء رحلة علم البيانات
Advertisements
مقدمة
من بين أفضل منصات البث في العالم Spotify تعتبر
حيث يلعب علم البيانات دوراً حاسماً في تخصيص تجارب المستخدم وتحسين التوصيات ودفع قرارات العمل
تحليل مجموعات Spotify يجب على علماء البيانات في
البيانات الكبيرة والتعرف على الأنماط واستخلاص رؤى ذات مغزى
فيما يلي دليل من خمس خطوات للمهارات والعمليات الأساسية المشاركة
بما في ذلك جمع البيانات Spotify في دور عالم بيانات
وتنظيف البيانات والتحليل الاستكشافي وبناء النماذج والتصور
الخطوة 1: جمع البيانات – جمع البيانات وفهمها
الخطوة الأولى والأكثر أهمية في أي عملية علم بيانات
Spotify هي جمع البيانات ذات الصلة في
إذ يعمل علماء البيانات مع أنواع مختلفة من البيانات مثل سجل استماع المستخدم وبيانات تعريف الأغاني وتفاعلات المنصة، ويتم جمع البيانات من مصادر متعددة بما في ذلك سجلات تفاعل المستخدم وبيانات تعريف المقطوعات الموسيقية وواجهات برمجة التطبيقات الخارجية
Hadoop و Spark منصات مثل Spotify يستخدم علماء البيانات في
للتعامل مع البيانات وتخزينها بكفاءة نظراً لحجمها الكبير والحاجة إلى قابلية التوسع
التقنيات والأدوات الرئيسية
للتعامل مع تدفقات البيانات الضخمة : Hadoop و Spark *
للاستعلام عن قواعد البيانات وإجراء استخراج البيانات : SQL *
لإدارة مجموعات البيانات والتحليل الأولي : Python *
الخطوة 2: تنظيف البيانات – إعداد البيانات للتحليل
نادراً ما تكون البيانات الخام جاهزة للتحليل فوراً، لذا يعد تنظيف البيانات مرحلة حاسمة تتضمن تصفية البيانات غير المكتملة أو غير الصحيحة أو غير ذات الصلة لضمان الدقة
Spotify فعلى سبيل المثال قد يقوم علماء بيانات
بإزالة الأغاني المكررة أو تنظيف ملفات تعريف المستخدم غير المكتملة أو تنسيق الطوابع الزمنية
التقنيات والأدوات الرئيسية
لتنظيف البيانات وتصفيتها وتنظيمها Pandas :مكتبات بايثون على سبيل المثال *
لتنظيف بيانات النص :(Regex)التعبيرات العادية *
التعامل مع القيم المفقودة: من خلال تقنيات مثل الاستيفاء أو حساب المتوسط *
Advertisements
: تحديد الأنماط والاتجاهات – (EDA)الخطوة 3: تحليل البيانات الاستكشافي
يعد تحليل البيانات الاستكشافي ضرورياً لفهم بنية البيانات وتحديد أي اتجاهات أساسية
Spotify فقد يقوم علماء بيانات
بتحليل سلوك المستخدم من خلال فحص عادات الاستماع أو أوقات الذروة أو تفضيلات نوع الأغنية تساعد هذه المرحلة في توليد الفرضيات وإعداد مجموعة البيانات لبناء النموذج
التقنيات والأدوات الرئيسية
لإنشاء تصورات مثل الرسوم البيانية والمخططات التشتتية :Matplotlib و Seaborn *
هندسة الميزات: إنشاء متغيرات جديدة تلتقط أنماطاً مهمة في البيانات *
التحليل الإحصائي: استخدام الإحصائيات الأساسية للكشف عن القيم المتطرفة وإقامة العلاقات *
الخطوة 4: بناء النموذج – إنشاء خوارزميات للتنبؤات
Spotify يقع جوهر التوصيات الشخصية لـ
في نماذج التعلم الآلي التي تتنبأ بتفضيلات المستخدم
(NLP) التصفية التعاونية ومعالجة اللغة الطبيعية Spotify يستخدم علماء بيانات
والشبكات العصبية لبناء أنظمة التوصية
A/B فغالباً ما يتم استخدام اختبار
أيضاً لتقييم تكوينات النموذج المختلفة
التقنيات والأدوات الرئيسية
لبناء نماذج التعلم الآلي :Scikit-Learn و TensorFlow *
التصفية التعاونية: للعثور على أنماط في تفضيلات المستخدم بناءً على تاريخ الاستماع *
معالجة اللغة الطبيعية: لمعالجة كلمات الأغاني وإنشاء قوائم تشغيل تناسب أذواق المستخدم *
الخطوة 5: التصور وإعداد التقارير – توصيل الأفكار
Spotify بعد بناء النماذج وضبطها يعرض علماء البيانات في
نتائجهم على أصحاب المصلحة المختلفين، وتعتبر أدوات التصور أمراً بالغ الأهمية في جعل النتائج مفهومة وقابلة للتنفيذ
Spotify ويستخدم علماء البيانات في
لوحات المعلومات والتقارير المرئية لعرض الاتجاهات ودقة النموذج والتوصيات
التقنيات والأدوات الرئيسية
للوحات المعلومات والتقارير التفاعلية :Tableau و PowerBI *
مهارات العرض: لتوصيل النتائج بشكل فعال للجمهور غير الفني *
تقنيات التصور: مثل خرائط الحرارة والمخططات الخطية والمخططات الشريطية *
الخلاصة
صعب وفعال في نفس الوقت Spotify دور عالم البيانات في
حيث تعد كل خطوة من الخطوات الخمس جزءاً لا يتجزأ من سير عمل علم البيانات بالكامل، ويساعد إتقان كل خطوة علماء البيانات
Spotify على تزويد مستخدمي
بتوصيات مخصصة وأفضل تجربة ممكنة من خلال تطوير المهارات في جمع البيانات وتنظيفها وتحليلها إلكترونياً وبناء النماذج والتصور، ويمكن لعلماء البيانات الطموحين تقديم مساهمة مؤثرة
In today’s fast-paced world, AI tools like ChatGPT have become essential for streamlining daily tasks, solving problems, and enhancing creativity. One of the most valuable features of ChatGPT is its ability to iterate — meaning you can refine and adjust prompts to get the most useful response. This essay explores ten iterative ChatGPT prompts that I use every day, highlighting their flexibility and practicality in various contexts, from work productivity to personal growth.
1. Task Prioritization
A daily iterative prompt I use is: “Help me organize my to-do list for today.”
Initially, ChatGPT provides a simple task list. However, by iterating the prompt — for instance, asking it to prioritize based on deadlines, effort, or urgency — I can refine the list and have the most pressing tasks at the top. This iterative process ensures I’m focusing on what matters most throughout the day.
2. Content Brainstorming
When brainstorming for new ideas, I might begin with: “Give me 10 ideas for my next blog post on web design.”
After reviewing the suggestions, I iterate by adding constraints like: “Focus on trending web design techniques for 2024.” This refinement narrows the focus to relevant, timely topics, improving the quality of the suggestions as they evolve with each iteration.
3. Coding Assistance
One of the prompts I regularly use is: “How can I fix this Python error?”
When ChatGPT provides a general solution, I iterate by refining my request: “What if I’m using a different library, like pandas?” This iterative approach helps me get to a more precise solution tailored to my coding environment, saving me time on troubleshooting.
4. Writing Enhancement
For writing improvement, I start with: “Help me improve this paragraph.”
ChatGPT’s initial suggestions might be broad, so I iterate by asking: “Can you make it sound more formal or academic?” The step-by-step refinements ensure the text meets the tone, clarity, and style I need, especially for professional or creative writing.
Advertisements
5. Learning New Concepts
To learn new topics, I often begin with a general prompt: “Explain the basics of machine learning.”
Afterward, I refine it by asking: “Can you explain it in simpler terms, like I’m a beginner?” This iterative prompting adjusts the complexity of the explanation based on my understanding, making it easier to grasp difficult concepts.
6. Language Translation and Localization
When dealing with international clients, I might prompt: “Translate this sentence into French.”
If I need to localize it for a specific region, I’ll iterate: “Can you make it sound natural for a French audience from Paris?” This helps ensure the translation feels authentic and contextually appropriate.
7. Personal Growth and Reflection
A common daily prompt is: “What are three things I can do to improve my productivity?”
After seeing general suggestions, I iterate by adding context: “What can I do to improve productivity while working from home?” The personalization makes the advice more actionable and relevant to my current situation.
8. Social Media Strategy
For digital marketing, I often use: “Suggest content ideas for my Instagram business page.”
As I iterate by specifying target audience or industry: “Focus on content for a web design company targeting startups,” the responses become more tailored, helping me craft an effective content strategy.
Conclusion
Using iterative prompts with ChatGPT allows me to tap into its vast capabilities more effectively, making everyday tasks smoother and more efficient. From personal productivity to complex decision-making, these prompts become more refined with each iteration, ensuring the AI’s responses are not only relevant but also actionable. The key to maximizing ChatGPT’s potential lies in constant refinement — an iterative dialogue that leads to better outcomes over time.
Advertisements
:اليوميةChatGPT مطالبات
ثماني تقنيات أعتمد عليها بشكل متكرر
Advertisements
: مقدمة
في عالم اليوم سريع الخطى أصبحت أدوات الذكاء الاصطناعي
ضرورية لتبسيط المهام اليومية ChatGPT مثل
وحل المشكلات وتعزيز الإبداع
قيمة ChatGPT إحدى أكثر ميزات
هي قدرته على التكرار مما يعني أنه يمكنك تحسين وتعديل المطالبات للحصول على الاستجابة الأكثر فائدة
ChatGPT يستكشف هذا المقال عشرة مطالبات تكرارية لبرنامج
أستخدمها كل يوم مع تسليط الضوء على مرونتها وعمليتها في سياقات مختلفة من إنتاجية العمل إلى النمو الشخصي
1. تحديد أولويات المهام
:المطالبة التكرارية اليومية التي أستخدمها هي
“ساعدني في تنظيم قائمة المهام الخاصة بي لهذا اليوم”
قائمة مهام بسيطة ChatGPT في البداية يوفر
ومع ذلك من خلال تكرار المطالبة على سبيل المثال مطالبتها بتحديد الأولويات بناءً على المواعيد النهائية أو الجهد أو الإلحاح يمكنني تحسين القائمة ووضع المهام الأكثر إلحاحاً في الأعلى، تضمن هذه العملية التكرارية أنني أركز على ما هو أكثر أهمية طوال اليوم
2. العصف الذهني للمحتوى
:عند العصف الذهني للأفكار الجديدة، قد أبدأ بـ
“أعطني عشرة أفكار لمنشور المدونة التالي الخاص بي حول تصميم الويب”
: بعد مراجعة الاقتراحات أكرر بإضافة قيود مثل
“التركيز على تقنيات تصميم الويب الرائجة لعام 2024”
يضيق هذا التحسين التركيز على الموضوعات ذات الصلة والمناسبة مما يحسن جودة الاقتراحات مع تطورها مع كل تكرار
3. المساعدة في الترميز
: أحد المطالبات التي أستخدمها بانتظام هو
“كيف يمكنني إصلاح خطأ بايثون هذا؟”
حلاً عاماً، أكرر من خلال تحسين طلبي: ChatGPT عندما يوفر
“؟ pandasماذا لو كنت أستخدم مكتبة مختلفة، مثل
يساعدني هذا النهج التكراري في الوصول إلى حل أكثر دقة ومصمم خصيصاً لبيئة الترميز الخاصة بي مما يوفر لي الوقت في استكشاف الأخطاء وإصلاحها
4. تحسين الكتابة
:لتحسين الكتابة أبدأ بـ
“ساعدني في تحسين هذه الفقرة”
الأولية واسعة النطاق ChatGPT قد تكون اقتراحات
: لذا أكرر السؤال
“هل يمكنك جعلها تبدو أكثر رسمية أو أكاديمية؟”
تضمن التحسينات التدريجية أن يلبي النص النبرة والوضوح والأسلوب الذي أحتاجه وخاصة للكتابة المهنية أو الإبداعية
Advertisements
5. تعلم مفاهيم جديدة
:لتعلم مواضيع جديدة غالباً ما أبدأ بسؤال عام
“اشرح أساسيات التعلم الآلي”
:بعد ذلك أقوم بتحسينه بالسؤال
“هل يمكنك شرحه بعبارات أبسط مثل أنا مبتدئ؟”
يضبط هذا الطرح التكراري تعقيد الشرح بناءً على فهمي مما يجعل من السهل فهم المفاهيم الصعبة
6. ترجمة اللغة وتوطينها
:عند التعامل مع العملاء الدوليين قد أطلب
“ترجم هذه الجملة إلى الفرنسية”
:إذا كنت بحاجة إلى توطينها لمنطقة معينة فسأكرر
“هل يمكنك جعلها تبدو طبيعية لجمهور فرنسي من باريس؟”
يساعد هذا في ضمان أن الترجمة تبدو أصلية وملائمة للسياق
7. النمو الشخصي والتأمل
:من بين الأسئلة الشائعة التي يتم طرحها يومياً
“ما هي الأشياء الثلاثة التي يمكنني القيام بها لتحسين إنتاجيتي؟”
:بعد رؤية الاقتراحات العامة أكرر السؤال بإضافة السياق
“ما الذي يمكنني القيام به لتحسين الإنتاجية أثناء العمل من المنزل؟”
تجعل التخصيصات النصيحة أكثر قابلية للتنفيذ وذات صلة بوضعي الحالي
8. إستراتيجية وسائل التواصل الاجتماعي
:بالنسبة للتسويق الرقمي غالباً ما أستخدم
“اقتراح أفكار محتوى لصفحة أعمالي على انستغرام”
:مع تكرار السؤال بتحديد الجمهور المستهدف أو الصناعة
“التركيز على المحتوى لشركة تصميم ويب تستهدف الشركات الناشئة”
تصبح الاستجابات أكثر تخصيصاً مما يساعدني في صياغة إستراتيجية محتوى فعالة
الخلاصة
الاستفادة من قدراته الهائلة ChatGPT يتيح لي استخدام الأسئلة المتكررة مع
بشكل أكثر فعالية مما يجعل المهام اليومية أكثر سلاسة وكفاءة. من الإنتاجية الشخصية إلى اتخاذ القرارات المعقدة تصبح هذه الأسئلة أكثر دقة مع كل تكرار مما يضمن أن تكون استجابات الذكاء الاصطناعي ليست ذات صلة فحسب بل وقابلة للتنفيذ أيضاً،
يكمن في التطوير المستمر ChatGPT إن مفتاح تعظيم إمكانات
Data science has emerged as one of the most sought-after fields in recent years, and Python has become its most popular programming language. Python’s versatility, simplicity, and a vast library ecosystem have made it the go-to language for data analysis, machine learning, and automation. However, mastering Python is not just about knowing syntax or using basic libraries. To truly excel, data scientists must be adept in certain key Python functions. These functions enable efficient data handling, manipulation, and analysis, helping professionals extract meaningful insights from vast datasets. Without mastering these core functions, data scientists risk falling behind in a fast-paced, data-driven world.
1. The map(), filter(), and reduce() Trio
A strong understanding of Python’s functional programming functions—map(), filter(), and reduce()—is essential for any data scientist. These functions allow efficient manipulation of data in a clear and concise manner.
map() applies a function to every element in a sequence, making it extremely useful when transforming datasets. Instead of using loops, map() streamlines the code, improving readability and performance.
filter() selects elements from a dataset based on a specified condition, making it a powerful tool for cleaning data by removing unwanted entries without needing verbose loop structures.
reduce() applies a rolling computation to sequential pairs in a dataset, which is vital in scenarios like calculating cumulative statistics or combining results from multiple sources.
While some may think of these functions as “advanced,” mastering them is a mark of efficiency and proficiency in data manipulation—an everyday task for a data scientist.
2. pandas Core Functions: apply(), groupby(), and merge()
Data manipulation is one of the most critical aspects of a data scientist’s role, and Python’s pandas library is at the heart of this task. Among the various functions in pandas, three stand out as indispensable: apply(), groupby(), and merge().
apply() allows for custom function applications across DataFrame rows or columns, granting tremendous flexibility. It is an essential tool when data scientists need to implement more complex transformations that go beyond simple arithmetic operations.
groupby() enables data aggregation and summarization by grouping datasets based on certain criteria. This function is invaluable for statistical analysis, giving data scientists the power to uncover trends and patterns in datasets, such as sales grouped by region or average purchase value segmented by customer demographics.
merge() is vital for combining datasets, which is common when working with multiple data sources. It allows for seamless data integration, enabling large datasets to be merged, concatenated, or joined based on matching keys. Mastery of this function is crucial for building complex datasets necessary for thorough analysis.
3. numpy Functions: reshape(), arange(), and linspace()
The numpy library, central to scientific computing in Python, provides data scientists with powerful tools for numerical operations. Three functions—reshape(), arange(), and linspace()—are particularly crucial when dealing with arrays and matrices.
reshape() allows data scientists to change the shape of arrays without altering their data, a common requirement when working with multidimensional data structures. This function is essential for preparing data for machine learning models, where input formats must often conform to specific dimensions.
arange() generates arrays of evenly spaced values, providing a flexible way to create sequences of numbers without loops. It simplifies the process of generating datasets for testing algorithms, such as creating a series of timestamps or equally spaced intervals.
linspace() also generates evenly spaced numbers but allows for greater control over the number of intervals within a specified range. This function is frequently used in mathematical simulations and modeling, enabling data scientists to fine-tune their analyses or visualize results with precision.
Advertisements
4. matplotlib Functions: plot(), scatter(), and hist()
Data visualization is an integral part of a data scientist’s job, and matplotlib is one of the most commonly used libraries for this task. Three core functions that data scientists must master are plot(), scatter(), and hist().
plot() is the foundation for creating line graphs, which are often used to show trends or compare data over time. It’s a must-have tool for any data scientist looking to communicate insights effectively.
scatter() is essential for plotting relationships between two variables. Understanding how to use this function is vital for visualizing correlations, which can be the first step in building predictive models.
hist() generates histograms, which are key to understanding the distribution of a dataset. This function is particularly important in exploratory data analysis (EDA), where understanding the underlying structure of data can inform subsequent modeling approaches.
5. itertools Functions: product(), combinations(), and permutations()
The itertools library in Python is a lesser-known but highly powerful toolset for data scientists, especially in scenarios that require combinatorial calculations.
product() computes the Cartesian product of input iterables, making it useful for generating combinations of features, configurations, or hyperparameters in machine learning workflows.
combinations() and permutations() are fundamental for solving problems where the arrangement or selection of elements is important, such as in optimization tasks or feature selection during model development.
Mastering these functions significantly reduces the complexity of code needed to explore multiple possible configurations or selections of data, providing data scientists with deeper flexibility in problem-solving.
Conclusion
The field of data science requires not only an understanding of statistical principles and machine learning techniques but also mastery over the programming tools that make this analysis possible. Python’s built-in functions and libraries are essential for any data scientist’s toolbox, and learning to use them effectively is non-negotiable for success. From the efficiency of map() and filter() to the powerful data manipulation capabilities of pandas, these functions allow data scientists to perform their job faster and more effectively. By mastering these functions, data scientists can ensure they remain competitive and excel in their careers, ready to tackle increasingly complex data challenges.
Advertisements
ما هي الوظائف التي يجب على علماء البيانات إتقانها لكي يتمكنوا من التفوق في بايثون؟
Advertisements
لقد برز علم البيانات كواحد من أكثر المجالات المرغوبة في السنوات الأخيرة وأصبحت بايثون لغة البرمجة الأكثر شعبية، جعلت تنوع بايثون وبساطتها ونظامها البيئي الواسع للمكتبات منها اللغة المفضلة لتحليل البيانات والتعلم الآلي والأتمتة ومع ذلك فإن إتقان بايثون لا يقتصر فقط على معرفة قواعد اللغة أو استخدام المكتبات الأساسية وللتفوق الأمثل يجب أن يكون علماء البيانات بارعين في وظائف بايثون الرئيسية معينة بحيث تمكنهم هذه الوظائف من التعامل مع البيانات والتلاعب بها وتحليلها بكفاءة مما يساعد المحترفين على استخراج رؤى ذات مغزى من مجموعات البيانات الضخمة، فبدون إتقان هذه الوظائف الأساسية يخاطر علماء البيانات بالتخلف في عالم متسارع الخطى مدفوع وذاخر بالبيانات
1. map() و filter() و reduce()الثلاثي
إن الفهم القوي لوظائف البرمجة الوظيفية في بايثون
map() و filter() و reduce()
أمر ضروري لأي عالم بيانات إذ تسمح هذه الوظائف بالتلاعب الفعال بالبيانات بطريقة واضحة وموجزة
تطبق هذه دالة على كل عنصر في تسلسل : map()
مما يجعلها مفيدة للغاية عند تحويل مجموعات البيانات فبدلاً من استخدام الحلقات تعمل هذه الدالة على تبسيط التعليمات البرمجية وتحسين قابلية القراءة والأداء
تحدد هذه الدالة عناصر من مجموعة بيانات : filter()
بناءً على شرط محدد مما يجعلها أداة قوية لتنظيف البيانات عن طريق إزالة الإدخالات غير المرغوب فيها دون الحاجة إلى هياكل حلقة مطولة
تطبق هذه الدالة حساباً متدحرجاً : Reduce()
على أزواج متسلسلة في مجموعة بيانات وهو أمر حيوي في سيناريوهات مثل حساب الإحصائيات التراكمية أو الجمع بين النتائج من مصادر متعددة
في حين قد يعتقد البعض أن هذه الوظائف “متقدمة” فإن إتقانها هو علامة على الكفاءة والإتقان في معالجة البيانات وهي مهمة يومية لعالم البيانات
2. apply() و groupby() و merge()الأساسية Pandasوظائف
يعد معالجة البيانات أحد أهم جوانب دور عالم البيانات
في بايثون هي جوهر هذه المهمة pandas ومكتبة
pandas فمن بين الوظائف المختلفة في
:تبرز ثلاث وظائف باعتبارها لا غنى عنها
apply() و groupby() و merge()
تتيح تطبيقات الوظائف المخصصة : apply()
DataFrame عبر صفوف أو أعمدة
مما يمنح مرونة هائلة، إنها أداة أساسية عندما يحتاج علماء البيانات إلى تنفيذ تحويلات أكثر تعقيداً تتجاوز العمليات الحسابية البسيطة
تمكّن تجميع البيانات وتلخيصها : groupby()
من خلال تجميع مجموعات البيانات بناءً على معايير معينة، هذه الوظيفة لا تقدر بثمن للتحليل الإحصائي مما يمنح علماء البيانات القدرة على اكتشاف الاتجاهات والأنماط في مجموعات البيانات مثل المبيعات المجمعة حسب المنطقة أو متوسط قيمة الشراء المجزأة حسب التركيبة السكانية للعملاء
تعتبر حيوية لدمج مجموعات البيانات : merge()
وهو أمر شائع عند العمل مع مصادر بيانات متعددة فهي تسمح بالتكامل السلس للبيانات مما يتيح دمج مجموعات البيانات الكبيرة أو ربطها أو ضمها بناءً على مفاتيح مطابقة، يعد إتقان هذه الوظيفة أمراً بالغ الأهمية لبناء مجموعات بيانات معقدة ضرورية للتحليل الشامل
3.reshape() و arange() و linspace() : NumPy وظائف
التي تعد أساسية للحوسبة العلمية NumPy توفر مكتبة
في بايثون لعلماء البيانات أدوات قوية للعمليات العددية
reshape() و arange() و linspace() هناك ثلاث وظائف
بالغة الأهمية بشكل خاص عند التعامل مع المصفوفات
تتيح لعلماء البيانات تغيير شكل المصفوفات دون تغيير بياناتها : reshape()
وهو متطلب شائع عند العمل مع هياكل البيانات متعددة الأبعاد، تعد هذه الوظيفة ضرورية لإعداد البيانات لنماذج التعلم الآلي حيث يجب أن تتوافق تنسيقات الإدخال غالباً مع أبعاد معينة
تولد مصفوفات من القيم المتباعدة بالتساوي : arange()
مما يوفر طريقة مرنة لإنشاء تسلسلات من الأرقام بدون حلقات، إنها تبسط عملية إنشاء مجموعات البيانات لاختبار الخوارزميات مثل إنشاء سلسلة من الطوابع الزمنية أو الفواصل المتباعدة بالتساوي
تولد أيضاً أرقاماً متباعدة بالتساوي : linspace()
ولكنها تسمح بقدر أكبر من التحكم في عدد الفواصل ضمن نطاق محدد، تُستخدم هذه الوظيفة بشكل متكرر في عمليات المحاكاة والنمذجة الرياضية مما يتيح لعلماء البيانات ضبط تحليلاتهم أو تصور النتائج بدقة
Advertisements
4.plot()و scatter()و hist() :matplotlib وظائف
يُعد تصور البيانات جزءاً لا يتجزأ من عمل عالم البيانات
هي واحدة من المكتبات الأكثر استخداماً لهذه المهمة matplotlibو
هي الأساس لإنشاء الرسوم البيانية الخطية : plot()
والتي تُستخدم غالباً لإظهار الاتجاهات أو مقارنة البيانات بمرور الوقت، إنها أداة لا غنى عنها لأي عالم بيانات يتطلع إلى توصيل الأفكار بشكل فعال
ضرورية لرسم العلاقات بين متغيرين : scatter()
بحيث يعد فهم كيفية استخدام هذه الوظيفة أمراً حيوياً لتصور الارتباطات والتي يمكن أن تكون الخطوة الأولى في بناء النماذج التنبؤية
تولد هذه دالة مخططات بيانية : hist()
وهي مفتاح لفهم توزيع مجموعة البيانات
(EDA) هذه الدالة مهمة بشكل خاص في تحليل البيانات الاستكشافي
حيث يمكن لفهم البنية الأساسية للبيانات أن يفيد في مناهج النمذجة اللاحقة
5. permutations() و combinations() و product(): itertools دالة
في بايثون مجموعة أدوات أقل شهرة itertools تعتبر مكتبة
ولكنها قوية للغاية لعلماء البيانات وخاصة في السيناريوهات التي تتطلب حسابات تركيبية
تحسب حاصل الضرب الديكارتي للعناصر القابلة للتكرار في الإدخال : product()
مما يجعلها مفيدة لتوليد مجموعات من الميزات أو التكوينات أو المعلمات الفائقة في سير عمل التعلم الآلي
أساسية لحل المشكلات : combinations() و permutations()
حيث يكون ترتيب العناصر أو اختيارها مهماً كما هو الحال في مهام التحسين أو اختيار الميزات أثناء تطوير النموذج
يؤدي إتقان هذه الوظائف إلى تقليل تعقيد التعليمات البرمجية المطلوبة لاستكشاف تكوينات أو اختيارات متعددة محتملة للبيانات بشكل كبير مما يوفر لعلماء البيانات مرونة أعمق في حل المشكلات
الاستنتاج
لا يتطلب مجال علم البيانات فهم المبادئ الإحصائية وتقنيات التعلم الآلي فحسب بل يتطلب أيضاً إتقان أدوات البرمجة التي تجعل هذا التحليل ممكناً، تعد الوظائف والمكتبات المضمنة في بايثون ضرورية لمجموعة أدوات أي عالم بيانات وتعلم كيفية استخدامها بشكل فعال أمر لا يمكن المساومة عليه لتحقيق النجاح
map() و filter() من كفاءة
pandas إلى قدرات معالجة البيانات القوية في
بحيث تسمح هذه الوظائف لعلماء البيانات بأداء وظائفهم بشكل أسرع وأكثر فعالية، من خلال إتقان هذه الوظائف يمكن لعلماء البيانات ضمان بقائهم قادرين على المنافسة والتفوق في حياتهم المهنية وجاهزين لمواجهة تحديات البيانات المعقدة بشكل متزايد
In the world of large-scale data infrastructure, Netflix has consistently pioneered innovations to meet its vast global audience’s demands. One of its most recent undertakings involves the introduction of a key-value data abstraction layer, a significant milestone in how the company handles the staggering amount of data its platform processes daily. This layer is not merely an optimization—it represents a fundamental rethinking of how Netflix organizes, accesses, and scales its data.
At its core, Netflix’s key-value data abstraction layer is designed to address the complexities of storing and retrieving data across a distributed environment. The idea behind this abstraction is simple but powerful: it allows various applications and services within Netflix to interact with data in a uniform way, without worrying about the underlying infrastructure. Developers don’t need to concern themselves with which specific database or storage system their data is being written to or read from. Instead, they interact with a high-level API that abstracts these details away, allowing for greater flexibility and scalability.
To understand why Netflix needed to build this abstraction layer, it’s essential to grasp the challenges they face in managing data at scale. Netflix operates in over 190 countries and streams billions of hours of content to millions of users every day. This means that their databases must handle an extraordinary volume of requests and data updates in real time. Moreover, the company uses multiple storage technologies—everything from relational databases to NoSQL systems to object storage solutions—each suited to specific tasks. Coordinating data across these disparate systems, ensuring consistency, and scaling seamlessly as the number of users grows are formidable challenges.
Traditionally, different teams at Netflix would pick the database technology that best fit their use case. While this approach works well for ensuring performance for specific tasks, it leads to a fragmented system where each service or application must be tightly coupled with its data store. This fragmentation complicates the work of developers, who must become experts in the intricacies of multiple database systems, and of operations teams, who must maintain and optimize a diverse and sprawling infrastructure.
Advertisements
The key-value data abstraction layer was conceived as a solution to this fragmentation. By abstracting away the specifics of the underlying data stores, Netflix can centralize control over how data is stored and retrieved while still offering the flexibility that individual services require. Developers can request or store data by using simple key-value pairs, and the abstraction layer ensures that these requests are directed to the appropriate storage system. Whether the data resides in a high-speed in-memory cache, a traditional relational database, or a distributed NoSQL system, the abstraction layer seamlessly bridges the gap.
The abstraction layer also plays a critical role in enhancing the resilience of Netflix’s systems. By decoupling services from specific data stores, Netflix can shift data around in the background without affecting the user experience. For example, if a particular database is experiencing high traffic or failures, the abstraction layer can reroute requests to another storage system or a backup replica. This flexibility is vital in a service that demands near-perfect uptime—users expect to stream their favorite shows or movies without delay, regardless of what’s happening behind the scenes.
In addition to improving reliability and scalability, Netflix’s key-value data abstraction layer also optimizes data locality. With a global user base, Netflix needs to ensure that users can access data as quickly as possible, no matter where they are in the world. The abstraction layer supports dynamic routing of data requests, ensuring that data is served from geographically appropriate storage locations. This minimizes latency and improves the overall quality of the streaming experience.
A crucial part of the development process for this system involved extensive collaboration across teams. Engineers needed to ensure that the abstraction layer could work across Netflix’s vast array of services without introducing performance bottlenecks. Achieving this required close coordination between Netflix’s data infrastructure teams, who maintain the backend systems, and the developers working on consumer-facing features. Moreover, Netflix’s culture of innovation meant that the system had to be designed with flexibility in mind—it needed to accommodate future changes in technology and infrastructure without requiring a complete overhaul.
As Netflix continues to grow and innovate, the key-value data abstraction layer stands as a testament to the company’s forward-thinking approach to data management. It allows Netflix to keep pace with increasing demand while maintaining a seamless, high-performance experience for users. It simplifies the work of developers, who can now build applications without worrying about the complexities of database management. And it enhances the overall reliability of Netflix’s service by providing the flexibility to adapt to any challenges that arise in the future.
Conclusion
This key-value data abstraction layer may not be visible to the average Netflix user, but it is a critical piece of the platform’s ability to scale and innovate. By decoupling services from specific databases and abstracting the complexity of data storage, Netflix has built a robust, flexible system that will serve it well as it continues to push the boundaries of online streaming technology.
Advertisements
الكشف عن إطار عمل تجريد البيانات ذات القيمة الأساسية من نتفليكس
Advertisements
في عالم البنية الأساسية للبيانات واسعة النطاق كانت نتفليكس رائدة باستمرار في الابتكارات لتلبية متطلبات جمهورها العالمي الواسع، ويتضمن أحد أحدث مشاريعها تقديم طبقة تجريد البيانات ذات القيمة الأساسية وهو إنجاز مهم في كيفية تعامل الشركة مع الكمية المذهلة من البيانات التي تعالجها منصتها يومياً، هذه الطبقة ليست مجرد تحسين إنها تمثل إعادة تفكير أساسية في كيفية تنظيم نتفليكس والوصول إلى بياناتها وتوسيع نطاقها
في جوهرها تم تصميم طبقة تجريد البيانات ذات القيمة الأساسية لنتفليكس لمعالجة تعقيدات تخزين واسترجاع البيانات عبر بيئة موزعة، الفكرة وراء هذا التجريد بسيطة ولكنها قوية فهي تسمح للتطبيقات والخدمات المختلفة داخل نتفليكس بالتفاعل مع البيانات بطريقة موحدة دون القلق بشأن البنية الأساسية فلا يحتاج المطورون إلى الاهتمام بقاعدة البيانات أو نظام التخزين المحدد الذي تتم كتابة بياناتهم إليه أو قراءتها منه بدلاً من ذلك يتفاعلون مع واجهة برمجة تطبيقات عالية المستوى تجرد هذه التفاصيل مما يسمح بمرونة وقابلية للتطوير بشكل أكبر
ولكي نفهم لماذا احتاجت نتفليكس إلى بناء طبقة التجريد هذه فمن الضروري أن ندرك التحديات التي تواجهها في إدارة البيانات على نطاق واسع، تعمل نتفليكس في أكثر من 190 دولة وتبث مليارات الساعات من المحتوى إلى ملايين المستخدمين كل يوم وهذا يعني أن قواعد بياناتها يجب أن تتعامل مع حجم غير عادي من الطلبات وتحديثات البيانات في الوقت الفعلي وعلاوة على ذلك تستخدم الشركة تقنيات تخزين متعددة – كل شيء
NoSQL من قواعد البيانات العلائقية إلى أنظمة
إلى حلول تخزين الكائنات – كل منها مناسب لمهام محددة، إن تنسيق البيانات عبر هذه الأنظمة المتباينة وضمان الاتساق والتوسع بسلاسة مع نمو عدد المستخدمين هي تحديات هائلة
تقليدياً تختار الفرق المختلفة في نتفليكس تقنية قاعدة البيانات التي تناسب حالة الاستخدام الخاصة بها على أفضل وجه وفي حين يعمل هذا النهج بشكل جيد لضمان الأداء لمهام محددة فإنه يؤدي إلى نظام مجزأ حيث يجب ربط كل خدمة أو تطبيق بإحكام بمخزن البيانات الخاص به ويؤدي هذا التفتت إلى تعقيد عمل المطورين الذين يجب أن يصبحوا خبراء في تعقيدات أنظمة قواعد البيانات المتعددة وفرق العمليات التي يجب أن تحافظ على البنية التحتية المتنوعة والمترامية الأطراف وتحسنها
تم تصميم طبقة تجريد البيانات ذات القيمة الأساسية كحل لهذه التجزئة من خلال تجريد تفاصيل مخازن البيانات الأساسية، يمكن لـ نتفليكس أن تركز السيطرة على كيفية تخزين البيانات واسترجاعها مع الاستمرار في تقديم المرونة التي تتطلبها الخدمات الفردية، يمكن للمطورين طلب البيانات أو تخزينها باستخدام أزواج بسيطة من القيمة الأساسية وتضمن طبقة التجريد توجيه هذه الطلبات إلى نظام التخزين المناسب سواء كانت البيانات موجودة في ذاكرة تخزين مؤقتة عالية السرعة في الذاكرة
NoSQL أو قاعدة بيانات علائقية تقليدية أو نظام
موزع فإن طبقة التجريد تسد الفجوة بسلاسة
Advertisements
تلعب طبقة التجريد أيضاً دوراً حاسماً في تعزيز مرونة أنظمة نتفليكس من خلال فصل الخدمات عن مخازن بيانات محددة، يمكن لنتفليكس تحويل البيانات في الخلفية دون التأثير على تجربة المستخدم على سبيل المثال إذا كانت قاعدة بيانات معينة تعاني من حركة مرور عالية أو أعطال يمكن لطبقة التجريد إعادة توجيه الطلبات إلى نظام تخزين آخر أو نسخة احتياطية، إن هذه المرونة ضرورية في الخدمة التي تتطلب وقت تشغيل شبه مثالي – يتوقع المستخدمون بث برامجهم أو أفلامهم المفضلة دون تأخير بغض النظر عما يحدث خلف الكواليس
بالإضافة إلى تحسين الموثوقية وقابلية التوسع تعمل طبقة تجريد البيانات ذات القيمة الرئيسية في نتفليكس أيضاً على تحسين موقع البيانات مع وجود قاعدة مستخدمين عالمية، تحتاج نتفليكس إلى ضمان قدرة المستخدمين على الوصول إلى البيانات بأسرع ما يمكن بغض النظر عن مكان وجودهم في العالم تدعم طبقة التجريد التوجيه الديناميكي لطلبات البيانات مما يضمن تقديم البيانات من مواقع تخزين مناسبة جغرافياً يقلل هذا من زمن الوصول ويحسن الجودة الإجمالية لتجربة البث
كان جزء مهم من عملية تطوير هذا النظام يتضمن تعاوناً مكثفاً بين الفرق كان المهندسون بحاجة إلى التأكد من أن طبقة التجريد يمكن أن تعمل عبر مجموعة واسعة من خدمات نتفليكس دون إدخال اختناقات في الأداء ويتطلب تحقيق ذلك تنسيقاً وثيقاً بين فرق البنية التحتية للبيانات في نتفليكس الذين يقومون بصيانة أنظمة الواجهة الخلفية والمطورين الذين يعملون على الميزات التي تواجه المستهلك وعلاوة على ذلك فإن ثقافة الابتكار لدى نتفليكس تعني أن النظام يجب أن يكون مصمماً مع مراعاة المرونة فهو بحاجة إلى استيعاب التغييرات المستقبلية في التكنولوجيا والبنية الأساسية دون الحاجة إلى إصلاح شامل
ومع استمرار نمو نتفليكس وابتكارها فإن طبقة تجريد البيانات ذات القيمة الأساسية تقف كشهادة على نهج الشركة التقدمي في إدارة البيانات فهي تسمح لنتفليكس بمواكبة الطلب المتزايد مع الحفاظ على تجربة سلسة وعالية الأداء بالنسبة للمستخدمين فهو يبسط عمل المطورين الذين يمكنهم الآن إنشاء التطبيقات دون القلق بشأن تعقيدات إدارة قواعد البيانات كما أنه يعزز الموثوقية الشاملة لخدمة نتفليكس من خلال توفير المرونة للتكيف مع أي تحديات قد تنشأ في المستقبل
قد لا تكون طبقة تجريد البيانات ذات القيمة الأساسية مرئية لمستخدم نتفليكس العادي لكنها جزء أساسي من قدرة المنصة على التوسع والابتكار من خلال فصل الخدمات عن قواعد البيانات المحددة وتجريد تعقيد تخزين البيانات قامت نتفليكس ببناء نظام قوي ومرن من شأنه أن يخدمها جيداً مع استمرارها في دفع حدود تقنية البث عبر الإنترنت
Data dashboards are indispensable tools in today’s data-driven world. They allow users to visualize, interact with, and make sense of large volumes of information quickly. However, creating a great dashboard is more than just compiling graphs and charts. A well-crafted dashboard tells a compelling story through clear, concise, and insightful data representations.
In this article, we will explore how to elevate your dashboard design from good to unmissable, with practical tips and essential principles.
1. Understanding the Purpose
Before designing a dashboard, it’s crucial to ask yourself two important questions:
Who is the audience?
What is the primary purpose of the dashboard?
A dashboard meant for executives, for instance, should focus on high-level KPIs (Key Performance Indicators) that provide a quick overview of business performance, while a dashboard for data analysts might need more granular and interactive data.
2. Data Prioritization and Structure
To avoid overwhelming users with too much information, the data should be organized into a hierarchy of importance. Start with the most crucial insights at the top of the dashboard and include more detailed data further down or as interactive elements. This structure not only keeps the dashboard clean but also ensures users can quickly find what they need.
Best practices:
Top-left positioning: Place critical data in the top-left area, as it’s typically the first place the eye goes.
Progressive disclosure: Show high-level data first, and allow users to drill down into the details if necessary.
3. Choose the Right Visualizations
Choosing the right type of chart or graph is essential to conveying your data accurately and efficiently. Each type of visualization has its strengths and weaknesses, and selecting the wrong one can lead to confusion or misinterpretation of the data.
Visualization Options:
Line charts: Ideal for showing trends over time.
Bar charts: Great for comparing quantities.
Pie charts: Best used for showing proportions (but avoid overuse).
Heat maps: Excellent for showing intensity and variations in large datasets.
Gauges and KPIs: Suitable for tracking performance against targets.
Advertisements
4. Keep It Simple and Minimalist
Simplicity is the key to great design. A cluttered dashboard can overwhelm the user and obscure key insights. Stick to minimalist principles and ensure every element on the dashboard serves a purpose. Use whitespace effectively to create balance and focus attention on the most important data.
Design tips:
Limit the number of colors: Stick to a consistent color palette, using colors only to highlight important data or categories.
Avoid excessive text: Use concise labels and tooltips for added clarity without overwhelming the visual space.
Interactive elements: Allow users to interact with the dashboard to reveal more details rather than showing everything at once.
5. Interactivity Enhances User Engagement
Interactivity allows users to explore data dynamically rather than passively consuming static visuals. Adding filters, drill-downs, and hover-over effects helps users engage with the data at a deeper level, enabling them to find the insights most relevant to their specific needs.
Interactive elements to consider:
Drill-downs: Clicking on a metric or graph should reveal more detailed data.
Filters: Allow users to filter data by date, category, or other variables.
Hover-over tooltips: Provide additional information without cluttering the dashboard.
6. Maintain Consistency and Brand Identity
A dashboard that aligns with the company’s branding and design language not only looks professional but also enhances the user experience. Use consistent fonts, colors, and style elements across all charts, graphs, and labels. This reduces cognitive load, making it easier for users to navigate and understand the data.
Branding tips:
Use company colors for graphs and visual elements.
Custom fonts: Use fonts that are in line with the brand guidelines.
Logos and Icons: Incorporate company logos or icons subtly in the header or footer of the dashboard.
7. Test and Iterate
Even the best-designed dashboards may require tweaking once they are in the hands of users. Collect feedback, observe how users interact with your dashboard, and iterate based on their experiences. Usability testing is essential to identify any pain points or areas where the design can be improved for clarity and efficiency.
Testing methods:
User feedback: Conduct interviews or surveys with your users.
Usage analytics: Track how users interact with the dashboard, identifying popular sections and drop-off points.
A/B testing: Compare different versions of a dashboard to see which performs better in terms of user engagement.
Conclusion
Mastering dashboard design requires a blend of understanding user needs, prioritizing key data, choosing appropriate visualizations, and adhering to design principles like simplicity, consistency, and interactivity. By following these best practices, you can elevate your dashboards from functional to unmissable, delivering not only data but actionable insights that drive decision-making.
Advertisements
إتقان تصميم لوحة المعلومات: من تصاميم جيدة إلى تصورات بيانية لا يمكن الاستغناء عنها
Advertisements
تُعد لوحات معلومات البيانات أدوات لا غنى عنها في عالم اليوم الذي تحركه البيانات فهي تسمح للمستخدمين بتصور كميات كبيرة من المعلومات والتفاعل معها وفهمها بسرعة ومع ذلك فإن إنشاء لوحة معلومات رائعة لا يقتصر على تجميع الرسوم البيانية والمخططات، فتروي لوحة المعلومات المصممة جيداً قصة مقنعة من خلال تمثيلات بيانات واضحة وموجزة وعميقة
في هذه المقالة سنستكشف كيفية الارتقاء بتصميم لوحة المعلومات من الجيد إلى التصور المرئي الذي لا يمكن تفويته مع نصائح عملية ومبادئ أساسية
1. فهم الغرض
قبل تصميم لوحة معلومات من الضروري أن تسأل نفسك سؤالين مهمين
من هو الجمهور المستهدف؟
ما هو الغرض الأساسي من لوحة المعلومات؟
على سبيل المثال يجب أن تركز لوحة المعلومات المخصصة للمديرين التنفيذيين على مؤشرات الأداء الرئيسية عالية المستوى التي توفر نظرة عامة سريعة على أداء الأعمال في حين قد تحتاج لوحة المعلومات المخصصة لمحللي البيانات إلى بيانات أكثر تفصيلاً وتفاعلية
2. تحديد أولويات البيانات وبنيتها
لتجنب إرهاق المستخدمين بالكثير من المعلومات، يجب تنظيم البيانات في تسلسل هرمي من الأهمية ابدأ بالمعلومات الأكثر أهمية في الجزء العلوي من لوحة المعلومات وقم بتضمين بيانات أكثر تفصيلاً في الأسفل أو كعناصر تفاعلية، لا تحافظ هذه البنية على لوحة المعلومات نظيفة فحسب بل تضمن أيضاً أن يتمكن المستخدمون من العثور بسرعة على ما يحتاجون إليه
:أفضل الممارسات
وضع أعلى اليسار: ضع البيانات المهمة في المنطقة العلوية اليسرى حيث إنها عادةً أول مكان تذهب إليه العين
الإفصاح التدريجي: اعرض البيانات عالية المستوى أولاً واسمح للمستخدمين بالتعمق في التفاصيل إذا لزم الأمر
3. اختر التصورات الصحيحة
يعد اختيار النوع المناسب من المخططات أو الرسوم البيانية أمراً ضرورياً لنقل بياناتك بدقة وكفاءة كل نوع من أنواع التصور له نقاط قوته وضعفه واختيار النوع الخاطئ يمكن أن يؤدي إلى ارتباك أو سوء تفسير البيانات
:خيارات التصور
المخططات الخطية: مثالية لإظهار الاتجاهات بمرور الوقت
المخططات الشريطية: رائعة لمقارنة الكميات
المخططات الدائرية: من الأفضل استخدامها لإظهار النسب (ولكن تجنب الإفراط في الاستخدام)
خرائط الحرارة: ممتازة لإظهار الكثافة والاختلافات في مجموعات البيانات الكبيرة
المقاييس ومؤشرات الأداء الرئيسية: مناسبة لتتبع الأداء مقابل الأهداف
Advertisements
4. حافظ على البساطة والحد الأدنى
البساطة هي المفتاح إلى تصميم رائع يمكن للوحة المعلومات المزدحمة أن تطغى على المستخدم وتحجب الأفكار الرئيسية التزم بمبادئ الحد الأدنى وتأكد من أن كل عنصر على لوحة المعلومات يخدم غرضاً استخدم المسافات البيضاء بشكل فعال لخلق التوازن وتركيز الانتباه على البيانات الأكثر أهمية
:نصائح التصميم
حدد عدد الألوان: التزم بلوحة ألوان متسقة، واستخدم الألوان فقط لتسليط الضوء على البيانات أو الفئات المهمة
تجنب النص المفرط: استخدم تسميات موجزة وإرشادات الأدوات لمزيد من الوضوح دون إغراق المساحة المرئية
العناصر التفاعلية: اسمح للمستخدمين بالتفاعل مع لوحة المعلومات للكشف عن مزيد من التفاصيل بدلاً من عرض كل شيء مرة واحدة
5. التفاعل يعزز من تفاعل المستخدم
يتيح التفاعل للمستخدمين استكشاف البيانات بشكل ديناميكي بدلاً من استهلاك الصور الثابتة بشكل سلبي تساعد إضافة المرشحات والتفاصيل والتأثيرات التي يتم تمرير الماوس فوقها المستخدمين على التفاعل مع البيانات على مستوى أعمق مما يمكنهم من العثور على الأفكار الأكثر صلة باحتياجاتهم المحددة
:العناصر التفاعلية التي يجب مراعاتها
التفاصيل: يجب أن يؤدي النقر فوق مقياس أو رسم بياني إلى الكشف عن بيانات أكثر تفصيلاً
المرشحات: تسمح للمستخدمين بتصفية البيانات حسب التاريخ أو الفئة أو المتغيرات الأخرى
نصائح الأدوات التي يتم تمرير الماوس فوقها: توفر معلومات إضافية دون إرباك لوحة المعلومات
6. الحفاظ على الاتساق وهوية العلامة التجارية
لوحة المعلومات التي تتوافق مع لغة العلامة التجارية والتصميم الخاصة بالشركة لا تبدو احترافية فحسب بل إنها تعزز أيضاً تجربة المستخدم استخدم خطوطاً وألواناً وعناصر نمطية متسقة في جميع المخططات والرسوم البيانية والعلامات، يقلل هذا من الحمل المعرفي مما يسهل على المستخدمين التنقل وفهم البيانات
:نصائح حول العلامة التجارية
استخدم ألوان الشركة للرسوم البيانية والعناصر المرئية
الخطوط المخصصة: استخدم الخطوط التي تتوافق مع إرشادات العلامة التجارية
الشعارات والأيقونات: أدرج شعارات الشركة أو الأيقونات بشكل خفي في رأس أو تذييل لوحة المعلومات
7. الاختبار والتكرار
حتى أفضل لوحات المعلومات المصممة قد تتطلب تعديلاً بمجرد وصولها إلى أيدي المستخدمين اجمع الملاحظات ولاحظ كيفية تفاعل المستخدمين مع لوحة المعلومات الخاصة بك وكرر ذلك بناءً على تجاربهم يعد اختبار قابلية الاستخدام أمراً ضرورياً لتحديد أي نقاط ضعف أو مجالات يمكن تحسين التصميم فيها من أجل الوضوح والكفاءة
:طرق الاختبار
ملاحظات المستخدم: قم بإجراء مقابلات أو استطلاعات مع المستخدمين
تحليلات الاستخدام: تتبع كيفية تفاعل المستخدمين مع لوحة المعلومات وتحديد الأقسام الشائعة ونقاط التوقف
:A/B اختبار
قارن بين الإصدارات المختلفة للوحة المعلومات لمعرفة أيها يعمل بشكل أفضل من حيث تفاعل المستخدم
الخلاصة
يتطلب إتقان تصميم لوحة المعلومات مزيجاً من فهم احتياجات المستخدم وإعطاء الأولوية للبيانات الرئيسية واختيار التصورات المناسبة والالتزام بمبادئ التصميم مثل البساطة والاتساق والتفاعلية باتباع أفضل الممارسات هذه، يمكنك رفع لوحات المعلومات الخاصة بك من وظيفية إلى لا يمكن تفويتها، وتقديم ليس فقط البيانات ولكن أيضاً رؤى قابلة للتنفيذ تدفع عملية اتخاذ القرار
As data science continues to be a critical driver of innovation and decision-making in organizations, the need for structured, scalable, and effective management of data science talent is more important than ever. One tool that organizations can use to ensure that data science teams are aligned with business goals and equipped with the right skills is a competency framework.
A competency framework outlines the knowledge, skills, behaviors, and proficiencies required for individuals to succeed in their roles within an organization. In the context of a data science team, it serves as a roadmap for talent development, performance evaluation, and hiring practices. Here’s a step-by-step guide to building an effective competency framework for your data science teams.
1. Understand the Business Needs
Before diving into the technical competencies, it’s essential to start with a clear understanding of the business objectives that your data science team supports. Consider the following questions:
What are the strategic priorities of your organization?
How does the data science team contribute to these priorities?
What future projects or initiatives will the team be expected to tackle?
Understanding these elements will help you align the competencies with organizational goals and ensure that your data science team is capable of driving meaningful outcomes.
2. Define Core Competencies
Data science is a multidisciplinary field, so your competency framework must capture various skill sets. The competencies can be divided into technical skills, business acumen, and soft skills.
Technical Skills
These are the foundational skills that every data scientist must have.
Common technical competencies include:
ProgrammingLanguages: Proficiency in languages like Python, R, and SQL is essential.
Statistical Analysis: Understanding of probability, distributions, and hypothesis testing.
Machine Learning: Knowledge of algorithms such as regression, clustering, classification, and deep learning.
Data Wrangling: Skills in cleaning, transforming, and organizing data for analysis.
Data Visualization: Ability to create impactful visualizations using tools like Tableau, Power BI, or Matplotlib.
Business Acumen
The ability to understand how data insights align with business goals is crucial.
Key competencies include:
Domain Knowledge: Understanding the industry and specific business processes the organization operates within.
Problem-Solving: Framing data problems in a way that is relevant to business objectives.
Communication: Translating technical insights into clear and actionable business recommendations.
Soft Skills
While technical and business skills are key, soft skills ensure team collaboration and leadership. Key areas include:
Collaboration: Working effectively with cross-functional teams.
Leadership: Leading projects, mentoring junior data scientists, and setting the technical direction.
Adaptability: Ability to work in a fast-paced, constantly evolving data landscape.
3. Establish Proficiency Levels
Once the core competencies are defined, the next step is to establish proficiency levels for each competency. Proficiency levels help assess team members’ growth and provide a framework for career progression. Typical levels may include:
Beginner: Has a basic understanding of the skill but requires supervision and mentorship.
Intermediate: Can apply the skill independently in a variety of contexts.
Advanced: Demonstrates expertise in the skill and can mentor others.
Expert: Recognized authority in the field; can drive innovation and create best practices.
These levels should be clearly defined so that each team member knows what is expected at each stage of their career.
Advertisements
4. Conduct Skills Assessment
After defining competencies and proficiency levels, it’s important to assess your team’s current capabilities. This can be done through self-assessments, manager evaluations, or more formal performance assessments.
The key is to identify skill gaps both at the individual and team level. This will provide valuable insights into the areas where further development is required, helping to tailor professional development plans and optimize hiring strategies.
5. Create Development Plans
A competency framework should serve as more than just a tool for performance evaluation; it should also be a basis for career development. Based on the skills assessment, create individualized development plans that:
Identify key areas for improvement.
Offer relevant training or learning opportunities (e.g., online courses, certifications, mentorship).
Establish clear career paths that align individual ambitions with team goals.
In addition to focusing on the technical side, development plans should also encourage the cultivation of leadership, communication, and other critical soft skills.
6. Integrate the Framework into Hiring and Performance Management
Once the competency framework is developed, it can be integrated into hiring and performance management processes. Use the defined competencies and proficiency levels to:
Guide Hiring: Develop interview questions and assessments that are aligned with your competency framework. This ensures that new hires possess the necessary skills to be successful in their roles.
Set Performance Metrics: Define clear performance metrics that are based on the competencies and proficiency levels. This will help ensure that performance reviews are objective and aligned with both individual and team goals.
Career Advancement: Use the framework to outline clear career paths and promotions based on proficiency levels in key competencies.
7. Review and Iterate the Framework
Finally, a competency framework is not a static tool. The field of data science evolves rapidly, and so too should your framework. Regularly review and update the competencies, incorporating new technologies, methodologies, and business needs.
AnnualReviews: Conduct an annual review of the framework to ensure it still aligns with organizational goals.
StakeholderFeedback: Gather feedback from team members, managers, and business leaders to continually refine the framework.
Stay Current: Keep pace with industry trends, such as advancements in AI, machine learning, and data engineering, to ensure your team remains competitive.
Conclusion
Building a competency framework for data science teams provides clarity around expectations, drives professional development, and ensures alignment with business goals. By identifying the right mix of technical skills, business knowledge, and soft skills, and continuously updating the framework, you can cultivate a high-performing data science team that is equipped to meet the challenges of today’s data-driven world.
Advertisements
دليل شامل لبناء إطار عمل فعال للكفاءات ضمن فرق علم البيانات الخاصة بك
Advertisements
مع استمرار علم البيانات في كونه محركاً أساسياً للابتكار واتخاذ القرار في المؤسسات أصبحت الحاجة إلى إدارة منظمة وقابلة للتطوير وفعالة لمواهب علم البيانات أكثر أهمية من أي وقت مضى إحدى الأدوات التي يمكن للمؤسسات استخدامها لضمان توافق فرق علم البيانات مع أهداف العمل وتزويدها بالمهارات المناسبة هي إطار العمل للكفاءات
يحدد إطار العمل للكفاءات المعرفة والمهارات والسلوكيات والكفاءات المطلوبة للأفراد للنجاح في أدوارهم داخل المؤسسة في سياق فريق علم البيانات، يعمل كخريطة طريق لتطوير المواهب وتقييم الأداء وممارسات التوظيف فيما يلي دليل خطوة بخطوة لبناء إطار عمل فعال للكفاءات لفرق علم البيانات الخاصة بك
1. فهم احتياجات العمل
قبل الخوض في الكفاءات الفنية من الضروري أن تبدأ بفهم واضح للأهداف التجارية التي يدعمها فريق علم البيانات الخاص بك ضع في اعتبارك الأسئلة التالية:
ما هي الأولويات الاستراتيجية لمنظمتك؟
كيف يساهم فريق علم البيانات في هذه الأولويات؟
ما هي المشاريع أو المبادرات المستقبلية التي من المتوقع أن يتعامل معها الفريق؟
إن فهم هذه العناصر سيساعدك على مواءمة الكفاءات مع الأهداف التنظيمية وضمان قدرة فريق علم البيانات الخاص بك على تحقيق نتائج ذات مغزى
2. تحديد الكفاءات الأساسية
علم البيانات هو مجال متعدد التخصصات لذلك يجب أن يلتقط إطار الكفاءات الخاص بك مجموعات مهارات مختلفة يمكن تقسيم الكفاءات إلى مهارات تقنية وذكاء تجاري ومهارات مرنة
المهارات التقنية
:هذه هي المهارات الأساسية التي يجب أن يتمتع بها كل عالم بيانات تشمل الكفاءات التقنية الشائعة
أمر ضروري SQL و R و Python لغات البرمجة: إتقان لغات مثل
التحليل الإحصائي: فهم الاحتمالات والتوزيعات واختبار الفرضيات
التعلم الآلي: معرفة الخوارزميات مثل الانحدار والتجميع والتصنيف والتعلم العميق
تنظيم البيانات: مهارات في تنظيف البيانات وتحويلها وتنظيمها للتحليل
التصور المرئي للبيانات: القدرة على إنشاء تصورات مرئية مؤثرة
Matplotlib أو Power BI أو Tableau باستخدام أدوات مثل
الفطنة التجارية
:إن القدرة على فهم كيفية توافق رؤى البيانات مع أهداف العمل أمر بالغ الأهمية وتشمل الكفاءات الرئيسية
المعرفة بالمجال: فهم الصناعة وعمليات الأعمال المحددة التي تعمل المنظمة ضمنها
حل المشكلات: صياغة مشاكل البيانات بطريقة ذات صلة بأهداف العمل
التواصل: ترجمة الرؤى الفنية إلى توصيات عمل واضحة وقابلة للتنفيذ
المهارات الشخصية
في حين أن المهارات الفنية والتجارية هي المفتاح، فإن المهارات الشخصية تضمن التعاون والقيادة بين الفريق وتشمل المجالات الرئيسية
التعاون: العمل بشكل فعال مع فرق متعددة الوظائف
القيادة: قيادة المشاريع، وتوجيه علماء البيانات المبتدئين، وتحديد الاتجاه الفني
القدرة على التكيف: القدرة على العمل في بيئة بيانات سريعة الخطى ومتطورة باستمرار
3. تحديد مستويات الكفاءة
بمجرد تحديد الكفاءات الأساسية، فإن الخطوة التالية هي تحديد مستويات الكفاءة لكل كفاءة تساعد مستويات الكفاءة في تقييم نمو أعضاء الفريق وتوفير إطار للتقدم الوظيفي قد تتضمن المستويات النموذجية ما يلي
المبتدئ: لديه فهم أساسي للمهارة ولكنه يتطلب الإشراف والتوجيه
المتوسط: يمكنه تطبيق المهارة بشكل مستقل في مجموعة متنوعة من السياقات
المتقدم: يُظهر خبرة في المهارة ويمكنه توجيه الآخرين
الخبير: سلطة معترف بها في هذا المجال ويمكنه قيادة الابتكار وخلق أفضل الممارسات
يجب تحديد هذه المستويات بوضوح حتى يعرف كل عضو في الفريق ما هو متوقع في كل مرحلة من مراحل حياته المهنية
4. إجراء تقييم المهارات
بعد تحديد الكفاءات ومستويات الكفاءة من المهم تقييم قدرات فريقك الحالية يمكن القيام بذلك من خلال التقييمات الذاتية أو تقييمات المدير أو تقييمات الأداء الأكثر رسمية
المفتاح هو تحديد فجوات المهارات على مستوى الفرد والفريق سيوفر هذا رؤى قيمة في المجالات التي تتطلب المزيد من التطوير مما يساعد في تصميم خطط التطوير المهني وتحسين استراتيجيات التوظيف
Advertisements
5. إنشاء خطط التطوير
يجب أن يعمل إطار الكفاءة كأكثر من مجرد أداة لتقييم الأداء يجب أن يكون أيضاً أساساً للتطوير الوظيفي بناءً على تقييم المهارات، قم بإنشاء خطط تطوير فردية:
تحديد المجالات الرئيسية للتحسين
تقديم التدريب أو فرص التعلم ذات الصلة (على سبيل المثال، الدورات التدريبية عبر الإنترنت، والشهادات، والإرشاد)
إنشاء مسارات وظيفية واضحة تتماشى مع طموحات الأفراد وأهداف الفريق
بالإضافة إلى التركيز على الجانب الفني، يجب أن تشجع خطط التطوير أيضاً على تنمية مهارات القيادة والتواصل وغيرها من المهارات الشخصية الحاسمة
6. دمج الإطار في التوظيف وإدارة الأداء
بمجرد تطوير إطار الكفاءة يمكن دمجه في عمليات التوظيف وإدارة الأداء استخدم الكفاءات ومستويات الكفاءة المحددة من أجل
توجيه التوظيف: تطوير أسئلة المقابلة والتقييمات التي تتوافق مع إطار الكفاءة الخاص بك وهذا يضمن أن الموظفين الجدد يمتلكون المهارات اللازمة للنجاح في أدوارهم
تحديد مقاييس الأداء: تحديد مقاييس أداء واضحة تستند إلى الكفاءات ومستويات الكفاءة وهذا سيساعد في ضمان أن تكون مراجعات الأداء موضوعية ومتوافقة مع أهداف الفرد والفريق
التقدم الوظيفي: استخدم الإطار لتحديد مسارات وظيفية واضحة وترقيات بناءً على مستويات الكفاءة في الكفاءات الرئيسية
7. مراجعة الإطار وتكراره
أخيراً، إطار الكفاءة ليس أداة ثابتة يتطور مجال علم البيانات بسرعة، وينبغي أن يتطور إطارك أيضاً قم بمراجعة الكفاءات وتحديثها بانتظام، مع دمج التقنيات والمنهجيات واحتياجات العمل الجديدة
المراجعة السنوية: إجراء مراجعة سنوية للإطار للتأكد من أنه لا يزال يتماشى مع الأهداف التنظيمية
ملاحظات أصحاب المصلحة: جمع الملاحظات من أعضاء الفريق والمديرين وقادة الأعمال لتحسين الإطار بشكل مستمر
مواكبة الاتجاهات الحالية: مواكبة اتجاهات الصناعة، مثل التطورات في الذكاء الاصطناعي والتعلم الآلي وهندسة البيانات، لضمان بقاء فريقك قادراً على المنافسة
الخلاصة
يوفر بناء إطار عمل للكفاءات لفرق علوم البيانات الوضوح حول التوقعات، ويدفع التطوير المهني، ويضمن التوافق مع أهداف العمل من خلال تحديد المزيج الصحيح من المهارات الفنية والمعرفة التجارية والمهارات الشخصية، وتحديث الإطار باستمرار، يمكنك تنمية فريق علوم البيانات عالي الأداء والمجهز لمواجهة تحديات عالم اليوم القائم على البيانات
In the fields of data science and machine learning, understanding and working with data is crucial. Data structures are the foundation of how we store, organize, and manipulate data. Whether you’re working on a simple machine learning model or a large-scale data pipeline, choosing the right data structure can impact the performance, efficiency, and scalability of your solution. Below are the key data structures that every data scientist and machine learning engineer should know.
1. Arrays
Arrays are one of the most basic and commonly used data structures. They store elements of the same data type in contiguous memory locations. In machine learning, arrays are often used to store data points, feature vectors, or image pixel values. NumPy arrays (ndarrays) are particularly important for scientific computing in Python due to their efficiency and ease of use.
Key features:
Fixed size
Direct access via index
Efficient memory usage
Support for mathematical operations with libraries like NumPy
Use cases in ML/DS:
Storing input data for machine learning models
Efficient numerical computations
Operations on multi-dimensional data like images and matrices
2. Lists
Python’s built-in list data structure is dynamic and can store elements of different types. Lists are versatile and support various operations like insertion, deletion, and concatenation.
Key features:
Dynamic size (can grow or shrink)
Can store elements of different types
Efficient for sequential access
Use cases in ML/DS:
Storing sequences of variable-length data (e.g., sentences in NLP)
Maintaining collections of data points during exploratory data analysis
Buffering batches of data for training
3. Stacks and Queues
Stacks and queues are linear data structures that organize elements based on specific order principles. Stacks follow the LIFO (Last In, First Out) principle, while queues follow FIFO (First In, First Out).
Stacks are used in algorithms like depth-first search (DFS) and backtracking. Queues are important for tasks requiring first-come-first-serve processing, like breadth-first search (BFS) or implementing pipelines for data streaming.
Key features:
Stack: LIFO, useful for recursion and undo functionality
Queue: FIFO, useful for sequential task execution
Use cases in ML/DS:
DFS/BFS in graph traversal algorithms
Managing tasks in processing pipelines (e.g., loading data in batches)
Backtracking algorithms used in optimization problems
4. Hash Tables (Dictionaries)
Hash tables store key-value pairs and offer constant-time average complexity for lookups, insertions, and deletions. In Python, dictionaries are the most common implementation of hash tables.
Key features:
Fast access via keys
No fixed size, grows dynamically
Allows for quick lookups, making it ideal for caching
Use cases in ML/DS:
Storing feature-to-index mappings in NLP tasks (word embeddings, one-hot encoding)
Caching intermediate results in dynamic programming solutions
Counting occurrences of data points (e.g., word frequencies in text analysis)
5. Sets
A set is an unordered collection of unique elements, which allows for fast membership checking, insertions, and deletions. Sets are useful when you need to enforce uniqueness or compare different groups of data.
Key features:
Only stores unique elements
Fast membership checking
Unordered, with no duplicate entries
Use cases in ML/DS:
Removing duplicates from datasets
Identifying unique values in a column
Performing set operations like unions and intersections (useful in recommender systems)
Advertisements
6. Graphs
Graphs represent relationships between entities (nodes/vertices) and are especially useful in scenarios where data points are interconnected, like social networks, web pages, or transportation systems. Graphs can be directed or undirected and weighted or unweighted, depending on the relationships they model.
Key features:
Consists of nodes (vertices) and edges (connections)
Can represent complex relationships
Efficient traversal using algorithms like DFS and BFS
Use cases in ML/DS:
Modeling relationships in social network analysis
Representing decision-making processes in algorithms
Graph neural networks (GNNs) for deep learning on graph-structured data
Route optimization and recommendation systems
7. Heaps (Priority Queues)
Heaps are specialized tree-based data structures that efficiently support priority-based element retrieval. A heap maintains the smallest (min-heap) or largest (max-heap) element at the top of the tree, making it easy to extract the highest or lowest priority item.
Key features:
Allows quick retrieval of the maximum or minimum element
Efficient insertions and deletions while maintaining order
Use cases in ML/DS:
Implementing priority-based algorithms (e.g., Dijkstra’s algorithm for shortest paths)
Managing queues in real-time systems and simulations
Extracting the top-k elements from a dataset
8. Trees
Trees are hierarchical data structures made up of nodes connected by edges. Binary trees, binary search trees (BSTs), and decision trees are some of the commonly used variations in machine learning.
Key features:
Nodes with parent-child relationships
Supports efficient searching, insertion, and deletion
Binary search trees allow for ordered data access
Use cases in ML/DS:
Decision trees and random forests for classification and regression
Storing hierarchical data (e.g., folder structures, taxonomies)
Optimizing search tasks using BSTs
9. Matrices
Matrices are a specific type of 2D array that is crucial for handling mathematical operations in machine learning and data science. Matrix operations, such as multiplication, addition, and inversion, are central to many algorithms, including linear regression, neural networks, and PCA.
Key features:
Efficient for representing and manipulating multi-dimensional data
Supports algebraic operations like matrix multiplication and inversion
Use cases in ML/DS:
Storing and manipulating input data for machine learning models
Representing and transforming data in linear algebra-based algorithms
Performing operations like dot products and vector transformations
10. Tensors
Tensors are multi-dimensional arrays, and they are generalizations of matrices to higher dimensions. In deep learning, tensors are essential as they represent inputs, weights, and intermediate calculations in neural networks.
Key features:
Generalization of matrices to n-dimensions
Highly efficient in storing and manipulating multi-dimensional data
Supported by libraries like TensorFlow and PyTorch
Use cases in ML/DS:
Representing data in deep learning models
Storing and updating neural network weights
Performing backpropagation in gradient-based optimization methods
Conclusion
Understanding these data structures and their use cases can greatly enhance a data scientist’s or machine learning engineer’s ability to develop efficient, scalable solutions. Selecting the appropriate data structure for a given task ensures that algorithms perform optimally, both in terms of time complexity and memory usage. For anyone serious about working in data science and machine learning, building a strong foundation in these data structures is essential.
Advertisements
ما هي هياكل البيانات التي يجب أن يعرفها علماء البيانات ومهندسو التعلم الآلي؟
Advertisements
في مجالات علم البيانات والتعلم الآلي يعد فهم البيانات والعمل بها أمراً بالغ الأهمية تشكل هياكل البيانات الأساس لكيفية تخزين البيانات وتنظيمها ومعالجتها سواء كنت تعمل على نموذج تعلم آلي بسيط أو خط أنابيب بيانات واسع النطاق فإن اختيار هيكل البيانات الصحيح يمكن أن يؤثر على أداء وكفاءة وقابلية توسيع الحل الخاص بك
:فيما يلي هياكل البيانات الرئيسية التي يجب أن يعرفها كل عالم بيانات ومهندس تعلم آلي
1. Arrays
تعتبر المصفوفات واحدة من أكثر هياكل البيانات الأساسية شيوعاً فهي تخزن عناصر من نفس نوع البيانات في مواقع ذاكرة متجاورة في التعلم الآلي، فغالباً ما تُستخدم المصفوفات لتخزين نقاط البيانات أو متجهات الميزات أو قيم بكسل الصورة
NumPy (ndarrays) تعد مصفوفات
مهمة بشكل خاص للحوسبة العلمية في بايثون نظراً لكفاءتها وسهولة استخدامها
:الميزات الرئيسية
حجم ثابت *
الوصول المباشر عبر الفهرس *
استخدام فعال للذاكرة *
NumPy دعم العمليات الحسابية باستخدام مكتبات مثل *
: ML/DSحالات الاستخدام في
تخزين بيانات الإدخال لنماذج التعلم الآلي *
الحسابات الرقمية الفعّالة *
العمليات على البيانات متعددة الأبعاد مثل الصور والمصفوفات *
2. القوائم
بنية بيانات القائمة المضمنة في بايثون ديناميكية ويمكنها تخزين عناصر من أنواع مختلفة القوائم متعددة الاستخدامات وتدعم عمليات مختلفة مثل الإدراج والحذف والتسلسل
:الميزات الرئيسية
الحجم الديناميكي (يمكن أن ينمو أو يتقلص) *
يمكن تخزين عناصر من أنواع مختلفة *
فعال للوصول المتسلسل *
: ML/DSحالات الاستخدام في
تخزين تسلسلات من البيانات ذات الطول المتغير (على سبيل المثال، الجمل في معالجة اللغة الطبيعية) *
الحفاظ على مجموعات من نقاط البيانات أثناء تحليل البيانات الاستكشافي *
تخزين دفعات البيانات مؤقتاً للتدريب *
3. Stacks and Queues
هي هياكل بيانات خطية تنظم العناصر بناءً على مبادئ ترتيب محددة
(آخر ما دخل، أول ما خرج) LIFO مبدأ Stacksتتبع
(أول ما دخل، أول ما خرج) FIFO مبدأ Queues بينما تتبع
(DFS) في خوارزميات مثل البحث بالعمق أولاً Stacks تُستخدم
Queues والتتبع العكسي بينما تعد
مهمة للمهام التي تتطلب معالجة على أساس أسبقية الحضور
أو تنفيذ خطوط الأنابيب لبث البيانات (BFS) مثل البحث بالعرض أولاً
:الميزات الرئيسية
مفيد لوظائف التكرار والتراجع LIFO :Stack
مفيد لتنفيذ المهام المتسلسلة FIFO :Queue
: ML/DSحالات الاستخدام في
في خوارزميات عبور الرسم البياني DFS/BFS
إدارة المهام في خطوط الأنابيب المعالجة (على سبيل المثال، تحميل البيانات في دفعات)
خوارزميات التتبع العكسي المستخدمة في مشاكل التحسين
4. جداول التجزئة (القواميس)
تخزن جداول التجزئة أزواج القيمة الرئيسية وتوفر تعقيداً متوسطاً ثابت الوقت لعمليات البحث والإدراج والحذف في بايثون، تعد القواميس التنفيذ الأكثر شيوعاً لجداول التجزئة
:الميزات الرئيسية
الوصول السريع عبر المفاتيح *
لا يوجد حجم ثابت ينمو بشكل ديناميكي *
يسمح بالبحث السريع مما يجعله مثالياً للتخزين المؤقت *
: ML/DSحالات الاستخدام في
تخزين تعيينات الميزة إلى الفهرس في مهام معالجة اللغة الطبيعية (تضمين الكلمات والترميز الساخن) *
تخزين النتائج الوسيطة في حلول البرمجة الديناميكية *
حساب تكرارات نقاط البيانات (على سبيل المثال: ترددات الكلمات في تحليل النص) *
5. المجموعات
المجموعة عبارة عن مجموعة غير مرتبة من العناصر الفريدة مما يسمح بالتحقق السريع من العضوية والإدراجات والحذف، المجموعات مفيدة عندما تحتاج إلى فرض التفرد أو مقارنة مجموعات مختلفة من البيانات
:الميزات الرئيسية
تخزين العناصر الفريدة فقط *
فحص سريع للعضوية *
غير مرتب، بدون إدخالات مكررة *
: ML/DSحالات الاستخدام في
إزالة العناصر المكررة من مجموعات البيانات *
تحديد القيم الفريدة في عمود *
إجراء عمليات المجموعة مثل الاتحادات والتقاطعات (مفيدة في أنظمة التوصية) *
Advertisements
6. الرسوم البيانية
تمثل الرسوم البيانية العلاقات بين الكيانات (العقد/الرؤوس) وهي مفيدة بشكل خاص في السيناريوهات حيث تكون نقاط البيانات مترابطة مثل الشبكات الاجتماعية أو صفحات الويب أو أنظمة النقل، يمكن توجيه الرسوم البيانية أو عدم توجيهها وترجيحها أو عدم ترجيحها اعتماداً على العلاقات التي تحاكيها
:الميزات الرئيسية
تتكون من عقد (رؤوس) وحواف (اتصالات) *
يمكن أن تمثل علاقات معقدة *
DFS و BFS عبور فعال باستخدام خوارزميات مثل *
: ML/DSحالات الاستخدام في
نمذجة العلاقات في تحليل الشبكات الاجتماعية *
تمثيل عمليات اتخاذ القرار في الخوارزميات *
للتعلم العميق على البيانات المهيكلة بيانياً (GNNs) شبكات عصبية بيانية *
أنظمة تحسين المسار والتوصية *
7. Heaps (Priority Queues)
هي هياكل بيانات متخصصة قائمة على الشجرة تدعم بكفاءة استرداد العناصر القائمة على الأولوية
(max-heap) أو أكبر عنصر (min-heap) على أصغر عنصر Heap تحافظ
في أعلى الشجرة، مما يسهل استخراج العنصر ذي الأولوية الأعلى أو الأدنى
:الميزات الرئيسية
يتيح الاسترجاع السريع للعنصر الأقصى أو الأدنى *
الإدراج والحذف بكفاءة مع الحفاظ على الترتيب *
: ML/DS حالات الاستخدام في
تنفيذ خوارزميات تعتمد على الأولوية (على سبيل المثال، خوارزمية ديكسترا لأقصر المسارات) *
إدارة قوائم الانتظار في أنظمة المحاكاة في الوقت الفعلي *
استخراج العناصر الأعلى من مجموعة البيانات *
8. الأشجار
الأشجار هي هياكل البيانات الهرمية المكونة من عقد متصلة بواسطة حواف الأشجار الثنائية
(BSTs) وأشجار البحث الثنائية
وأشجار القرار هي بعض الاختلافات المستخدمة بشكل شائع في التعلم الآلي
:الميزات الرئيسية
العقد ذات علاقات الوالد والطفل *
تدعم البحث والإدراج والحذف بكفاءة *
تسمح أشجار البحث الثنائية بالوصول المنظم للبيانات *
: ML/DS حالات الاستخدام في
أشجار القرار والغابات العشوائية للتصنيف والانحدار *
تخزين البيانات الهرمية (على سبيل المثال، هياكل المجلدات، التصنيفات) *
تحسين مهام البحث باستخدام أشجار البحث الثنائية *
9. Matrices
هي نوع معين من المصفوفات ثنائية الأبعاد التي تعد بالغة الأهمية للتعامل مع العمليات الرياضية في التعلم الآلي وعلوم البيانات، عمليات المصفوفات مثل الضرب والجمع والعكس هي مركزية للعديد من الخوارزميات بما في ذلك الانحدار الخطي والشبكات العصبية وتحليل المكونات الرئيسية
:الميزات الرئيسية
فعال لتمثيل ومعالجة البيانات متعددة الأبعاد *
يدعم العمليات الجبرية مثل ضرب المصفوفات وعكسها *
: ML/DS حالات الاستخدام في
تخزين ومعالجة بيانات الإدخال لنماذج التعلم الآلي *
تمثيل البيانات وتحويلها في الخوارزميات القائمة على الجبر الخطي *
إجراء عمليات مثل حاصل ضرب النقاط وتحويلات المتجهات *
10. Tensors
هي عبارة عن مصفوفات متعددة الأبعاد، وهي تعميمات للمصفوفات إلى أبعاد أعلى في التعلم العميق
ضرورية Tensors تعد
لأنها تمثل المدخلات والأوزان والحسابات الوسيطة في الشبكات العصبية
:الميزات الرئيسية
n تعميم المصفوفات إلى أبعاد *
كفاءة عالية في تخزين ومعالجة البيانات متعددة الأبعاد *
TensorFlow و PyTorch مدعومة من مكتبات مثل *
: ML/DS حالات الاستخدام في
تمثيل البيانات في نماذج التعلم العميق *
تخزين وتحديث أوزان الشبكة العصبية *
إجراء الانتشار العكسي في طرق التحسين القائمة على التدرج *
الخلاصة
إن فهم هياكل البيانات هذه وحالات استخدامها يمكن أن يعزز بشكل كبير قدرة عالم البيانات أو مهندس التعلم الآلي على تطوير حلول فعالة وقابلة للتطوير، يضمن اختيار هيكل البيانات المناسب لمهمة معينة أن تعمل الخوارزميات بشكل مثالي سواء من حيث تعقيد الوقت أو استخدام الذاكرة بالنسبة لأي شخص جاد في العمل في علم البيانات والتعلم الآلي فإن بناء أساس قوي في هياكل البيانات هذه أمر ضروري
In today’s data-driven world, businesses are constantly generating vast amounts of data. However, much of this data is disorderly—unstructured, noisy, and difficult to analyze. Traditional data analysis techniques often struggle with such messy data. Enter Generative AI, an innovative approach capable of transforming disorderly data into actionable insights. This article delves into how generative AI is revolutionizing the field of data analytics, making sense of complex datasets that were previously challenging to work with.
1. Understanding Disorderly Data
Disorderly data, also known as unstructured data, includes information that doesn’t fit neatly into databases. Examples include text documents, images, social media posts, and even audio or video files. Unlike structured data (such as spreadsheets), disorderly data lacks a predefined format, making it harder to process using traditional algorithms.
2. Challenges in Extracting Insights from Disorderly Data
Disorderly data poses several challenges:
Volume and Variety: The sheer volume and variety of disorderly data make it overwhelming for traditional analysis tools.
Ambiguity and Redundancy: Disorderly data often includes irrelevant or redundant information that complicates analysis.
Contextual Understanding: Extracting meaningful insights from disorderly data requires understanding context, a task that can be challenging for conventional algorithms.
This is where Generative AI comes into play, offering an efficient way to process and make sense of such data.
3. How Generative AI Handles Disorderly Data
Generative AI, powered by advanced algorithms like transformers and neural networks, excels in processing and understanding unstructured data. Here’s how it works:
Pattern Recognition: Generative AI models identify patterns in noisy data that might not be immediately apparent to human analysts.
Data Synthesis: It can generate new data based on learned patterns, filling in gaps, and offering deeper insights into hidden relationships.
Contextual Understanding: With natural language processing (NLP) and other capabilities, Generative AI can understand context in a more human-like manner.
Example Use Case: A retail company wants to analyze customer reviews (text data) to improve its product. Traditional analytics may struggle with the unstructured nature of reviews, but Generative AI can extract common sentiments, identify trends, and even predict future customer preferences.
Advertisements
4. Key Techniques in Generative AI for Disorderly Data
Natural Language Processing (NLP): Used for extracting meaning from text-based disorderly data, NLP enables AI to process human language and extract key themes.
Image and Video Analysis: Generative models can analyze disorderly visual data, such as images and videos, to find hidden patterns and insights.
Reinforcement Learning: This technique allows generative AI to learn and adapt, refining its analysis of disorderly data over time.
5. Benefits of Using Generative AI for Disorderly Data
Faster Insights: Generative AI can process vast amounts of data quickly, turning disorderly datasets into usable insights within minutes or hours.
Scalability: Whether the dataset is small or massive, generative AI scales effortlessly, handling complex data scenarios that would overwhelm traditional systems.
Reduced Human Effort: By automating data analysis, businesses can reduce the need for extensive human intervention, freeing up resources for other critical tasks.
6. Future Implications of Generative AI in Data Analytics
As generative AI continues to evolve, its application in data analytics will become even more transformative. We can expect advances in the following areas:
Improved Data Augmentation: AI models will be able to generate synthetic data that complements existing disorderly datasets, enriching analysis.
Real-Time Insights: Generative AI will enable real-time insights from streaming data, such as live social media feeds or sensor data.
Greater Predictive Capabilities: By learning from disorderly data, generative AI will enhance its ability to predict trends and behaviors across industries.
Conclusion
Disorderly data, once seen as a challenge, is now a rich resource for actionable insights thanks to Generative AI. By leveraging advanced techniques such as NLP, pattern recognition, and data synthesis, businesses can now harness the power of unstructured data to gain a competitive edge. The future of data analytics lies in generative models that continue to evolve and adapt to the complexities of real-world data.
Generative AI not only makes sense of disorderly data but also unlocks its full potential, offering unprecedented opportunities for innovation and growth.
Advertisements
استخراج رؤى من البيانات غير المنظمة باستخدام الذكاء الاصطناعي التوليدي
Advertisements
في عالم اليوم الذي تحركه البيانات تولد الشركات باستمرار كميات هائلة من البيانات ومع ذلك فإن الكثير من هذه البيانات غير المنظمة تعتبر عشوائية ومشتتة يصعب تحليلها، فغالباً ما تكافح تقنيات تحليل البيانات التقليدية مع مثل هذه البيانات الفوضوية أدخل الذكاء الاصطناعي التوليدي وهو نهج مبتكر قادر على تحويل البيانات غير المنظمة إلى رؤى قابلة للتنفيذ تتعمق هذه المقالة في كيفية إحداث الذكاء الاصطناعي التوليدي ثورة في مجال تحليلات البيانات وإضفاء معنى على مجموعات البيانات المعقدة التي كانت صعبة في السابق للعمل معها
1. فهم البيانات غير المنظمة
تتضمن البيانات غير المنظمة معلومات لا تتناسب بشكل أنيق مع قواعد البيانات تشمل الأمثلة المستندات النصية والصور ومنشورات وسائل التواصل الاجتماعي وحتى ملفات الصوت أو الفيديو على عكس البيانات المنظمة (مثل جداول البيانات)، تفتقر البيانات غير المنظمة إلى تنسيق محدد مسبقاً مما يجعل معالجتها باستخدام الخوارزميات التقليدية أكثر صعوبة
2. التحديات في استخراج الأفكار من البيانات غير المنظمة
:تفرض البيانات غير المنظمة العديد من التحديات
الحجم والتنوع: إن الحجم والتنوع الهائل للبيانات غير المنظمة يجعلانها مرهقة لأدوات التحليل التقليدية
الغموض والتكرار: غالباً ما تتضمن البيانات غير المنظمة معلومات غير ذات صلة أو مكررة مما يعقد التحليل
الفهم السياقي: يتطلب استخراج الأفكار ذات المغزى من البيانات غير المنظمة فهم السياق وهي مهمة قد تكون صعبة بالنسبة للخوارزميات التقليدية
وهنا يأتي دور الذكاء الاصطناعي التوليدي الذي يوفر طريقة فعالة لمعالجة مثل هذه البيانات وفهمها
3. كيف يتعامل الذكاء الاصطناعي التوليدي مع البيانات غير المنظمة
يتفوق الذكاء الاصطناعي التوليدي المدعوم بخوارزميات متقدمة مثل المحولات والشبكات العصبية في معالجة وفهم البيانات غير المنظمة، إليك كيفية عملها
التعرف على الأنماط: تحدد نماذج الذكاء الاصطناعي التوليدي الأنماط في البيانات المشوشة التي قد لا تكون واضحة على الفور للمحللين البشريين
تركيب البيانات: يمكنها توليد بيانات جديدة بناءً على الأنماط المكتسبة وملء الفجوات وتقديم رؤى أعمق للعلاقات المخفية
(NLP) الفهم السياقي: باستخدام معالجة اللغة الطبيعية
والقدرات الأخرى يمكن للذكاء الاصطناعي التوليدي فهم السياق بطريقة أكثر شبهاً بالإنسان
مثال على حالة الاستخدام: تريد شركة بيع بالتجزئة تحليل مراجعات العملاء (بيانات نصية) لتحسين منتجها قد تواجه التحليلات التقليدية صعوبة في التعامل مع الطبيعة غير المنظمة للمراجعات ولكن الذكاء الاصطناعي التوليدي يمكنه استخراج المشاعر المشتركة وتحديد الاتجاهات وحتى التنبؤ بتفضيلات العملاء في المستقبل
Advertisements
4. التقنيات الرئيسية في الذكاء الاصطناعي التوليدي للبيانات غير المنظمة
:(NLP)معالجة اللغة الطبيعية
تُستخدم لاستخراج المعنى من البيانات غير المنظمة المستندة إلى النص وتمكّن معالجة اللغة الطبيعية الذكاء الاصطناعي من معالجة اللغة البشرية واستخراج الموضوعات الرئيسية
تحليل الصور والفيديو: يمكن للنماذج التوليدية تحليل البيانات المرئية غير المنظمة مثل الصور ومقاطع الفيديو للعثور على الأنماط والرؤى المخفية
التعلم التعزيزي: تسمح هذه التقنية للذكاء الاصطناعي التوليدي بالتعلم والتكيف وتحسين تحليله للبيانات غير المنظمة بمرور الوقت
5. فوائد استخدام الذكاء الاصطناعي التوليدي للبيانات غير المنظمة
رؤى أسرع: يمكن للذكاء الاصطناعي التوليدي معالجة كميات هائلة من البيانات بسرعة وتحويل مجموعات البيانات غير المنظمة إلى رؤى قابلة للاستخدام في غضون دقائق أو ساعات
قابلية التوسع: سواء كانت مجموعة البيانات صغيرة أو ضخمة فإن الذكاء الاصطناعي التوليدي يتوسع بسهولة ويتعامل مع سيناريوهات البيانات المعقدة التي من شأنها أن تطغى على الأنظمة التقليدية
الجهد البشري المنخفض: من خلال أتمتة تحليل البيانات يمكن للشركات تقليل الحاجة إلى التدخل البشري المكثف وتحرير الموارد لمهام حاسمة أخرى
6. التأثيرات المستقبلية للذكاء الاصطناعي التوليدي في تحليلات البيانات
مع استمرار تطور الذكاء الاصطناعي التوليدي سيصبح تطبيقه في تحليلات البيانات أكثر تحولاً يمكننا أن نتوقع تقدماً في المجالات التالية
تحسين زيادة البيانات: ستكون نماذج الذكاء الاصطناعي قادرة على توليد بيانات اصطناعية تكمل مجموعات البيانات غير المنظمة الموجودة مما يثري التحليل
رؤى في الوقت الفعلي: سيمكن الذكاء الاصطناعي التوليدي من الحصول على رؤى في الوقت الفعلي من البيانات المتدفقة مثل موجزات الوسائط الاجتماعية المباشرة أو بيانات المستشعر
قدرات تنبؤية أكبر: من خلال التعلم من البيانات غير المنظمة سيعزز الذكاء الاصطناعي التوليدي قدرته على التنبؤ بالاتجاهات والسلوكيات عبر الصناعات
الخلاصة
البيانات غير المنظمة التي كانت تُعتبر تحدياً في السابق أصبحت الآن مصدراً غنياً للرؤى القابلة للتنفيذ بفضل الذكاء الاصطناعي التوليدي، فمن خلال الاستفادة من التقنيات المتقدمة مثل معالجة اللغة الطبيعية والتعرف على الأنماط وتوليف البيانات يمكن للشركات الآن الاستفادة من قوة البيانات غير المنظمة للحصول على ميزة تنافسية، يكمن مستقبل تحليلات البيانات في النماذج التوليدية التي تستمر في التطور والتكيف مع تعقيدات البيانات في العالم الحقيقي
لا يعمل الذكاء الاصطناعي التوليدي على فهم البيانات غير المنظمة فحسب بل إنه يفتح أيضاً إمكاناتها الكاملة مما يوفر فرصاً غير مسبوقة للإبداع والنمو
Creating content is only part of the challenge when it comes to writing articles. If no one reads your work, all the effort feels wasted. Many writers make simple but crucial mistakes that prevent their articles from reaching the audience they deserve. Here are the eight most common mistakes that might be keeping your articles unnoticed:
1. Weak Headlines
The headline is the first thing readers see, and if it’s weak, they won’t bother clicking. Your headline needs to be compelling, clear, and intriguing. Avoid vague or generic titles like “Some Thoughts on Productivity” and opt for something more engaging like “10 Powerful Hacks to Boost Your Productivity in One Day.”
2. Ignoring SEO (Search Engine Optimization)
Even if your content is excellent, failing to optimize it for search engines means that it won’t appear when people search for related topics. Without proper keywords, meta descriptions, and appropriate use of headers (H1, H2, etc.), search engines might overlook your article, keeping it from potential readers. Doing keyword research and strategically placing them throughout your article is essential.
3. Poor Structure and Formatting
Readers on the web skim articles before diving in. If your content is a large, unbroken block of text, it will intimidate and overwhelm them. Break your content into digestible sections with subheadings, bullet points, and short paragraphs. Adding visuals or relevant images can also make your article more inviting.
4. Not Writing for Your Audience
Understanding your target audience is crucial. If you don’t write in a way that addresses their specific interests, needs, or problems, they won’t feel connected to your article. Tailor your language, tone, and examples to suit the preferences of your readers. What might work for a tech-savvy audience may not appeal to a more casual reader base.
Advertisements
5. No Value or Originality
If your article doesn’t offer new insights or actionable advice, it’s likely to get lost among the countless similar pieces online. Readers are always looking for value—whether it’s practical tips, a fresh perspective, or in-depth knowledge. Avoid regurgitating common information, and strive to provide something unique or better than what’s already out there.
6. Failing to Promote Your Content
Publishing an article is just the first step. Many writers assume people will automatically find their work, but that’s rarely the case. Without proper promotion on social media, newsletters, and other platforms, your article will likely stay unnoticed. Make a habit of sharing your content multiple times and across different channels to increase visibility.
7. Overlooking Readability and Engagement
Complex or technical language can turn off readers, especially if the topic doesn’t demand it. Likewise, long, meandering sentences can make your article a chore to read. Keep your writing clear, concise, and conversational. Use engaging language that invites the reader to keep going. Asking questions or using storytelling techniques can also help.
8. Not Updating Old Content
Once an article is published, it’s easy to forget about it. But evergreen content—articles that remain relevant—can drive traffic long after they’re first published. If you neglect updating your content with the latest information, stats, or trends, readers might overlook it in favor of fresher resources. Regularly reviewing and updating your articles can help them stay visible and valuable.
Conclusion
Avoiding these common mistakes can significantly boost the visibility of your articles. Focus on strong headlines, SEO optimization, audience targeting, and promotion. Don’t forget to structure your articles for readability and keep offering value with unique insights. With a bit of strategy, your content can stand out in the crowded digital space!
Advertisements
أخطاء بسيطة وحاسمة تمنع مقالاتك من الوصول إلى الجمهور
Advertisements
إن إنشاء المحتوى ليس سوى جزء من التحدي عندما يتعلق الأمر بكتابة المقالات فإذا لم يقرأ أحد عملك فإن كل الجهد المبذول يبدو ضائعاً
يرتكب العديد من الكتاب أخطاء بسيطة ولكنها حاسمة تمنع مقالاتهم من الوصول إلى الجمهور الذي يستحقونه، وفيما يلي الأخطاء الأكثر شيوعاً والتي قد تجعل مقالاتك غير ملحوظة
1. العناوين الضعيفة
العنوان هو أول ما يراه القراء وإذا كان ضعيفاً فلن يكلفوا أنفسهم عناء النقر عليه لذا يجب أن يكون عنوانك مقنعاً وواضحاً ومثيراً للاهتمام، تجنب العناوين الغامضة أو العامة مثل “بعض الأفكار حول الإنتاجية” واختر شيئاً أكثر جاذبية مثل “10 طرق فعالة لتعزيز إنتاجيتك في يوم واحد”
2. (SEO) تجاهل تحسين محركات البحث
حتى إذا كان المحتوى الخاص بك ممتازاً فإن الفشل في تحسينه لمحركات البحث يعني أنه لن يظهر عندما يبحث الأشخاص عن مواضيع ذات صلة بدون كلمات رئيسية مناسبة وأوصاف تعريفية
إلخ ، H2، H1 واستخدام مناسب للعناوين
قد تتجاهل محركات البحث مقالتك مما يحجبها عن القراء المحتملين يعد إجراء بحث عن الكلمات الرئيسية ووضعها بشكل استراتيجي في جميع أنحاء مقالتك أمراً ضرورياً
3. هيكل وتنسيق رديئان
يقوم القراء على الويب بتصفح المقالات قبل التعمق فيها إذا كان المحتوى الخاص بك عبارة عن كتلة نصية كبيرة وغير متقطعة فسوف يخيفهم ويرهقهم لذا قم بتقسيم المحتوى الخاص بك إلى أقسام قابلة للهضم بعناوين فرعية ونقاط موجزة وفقرات قصيرة يمكن أن يؤدي إضافة الصور المرئية أو ذات الصلة أيضاً إلى جعل مقالتك أكثر جاذبية
4. عدم الكتابة لجمهورك
إن فهم جمهورك المستهدف أمر بالغ الأهمية إذا لم تكتب بطريقة تتناول اهتماماتهم أو احتياجاتهم أو مشاكلهم المحددة فلن يشعروا بالارتباط بمقالك، قم بتخصيص لغتك ونبرتك وأمثلتك لتناسب تفضيلات قرائك ما قد ينجح مع جمهور متمرس في مجال التكنولوجيا وضع في الحسبان أنه قد لا يجذب قاعدة قراء غير رسمية
Advertisements
5. انعدام القيمة أو الفائدة
إذا لم تقدم مقالتك رؤى جديدة أو نصائح عملية فمن المرجح أن تضيع بين المقالات المماثلة التي لا تعد ولا تحصى على الإنترنت يبحث القراء دائماً عن القيمة سواء كانت نصائح عملية أو منظوراً جديداً أو معرفة متعمقة تجنب تكرار المعلومات الشائعة واجتهد في تقديم شيء فريد أو أفضل مما هو موجود بالفعل
6. الفشل في الترويج لمحتواك
نشر مقال ما هو مجرد الخطوة الأولى إذ يفترض العديد من الكتاب أن الناس سيجدون أعمالهم تلقائياً لكن هذا نادراً ما يحدث بدون الترويج المناسب على وسائل التواصل الاجتماعي والنشرات الإخبارية والمنصات الأخرى ومن المرجح أن تظل مقالتك دون أن يلاحظها أحد لذا اجعل من عادتك مشاركة المحتوى الخاص بك عدة مرات وعبر قنوات مختلفة لزيادة الرؤية
7. تجاهل قابلية القراءة والتفاعل
يمكن للغة المعقدة أو الفنية أن تنفر القراء خاصة إذا لم يتطلب الموضوع ذلك وبالمثل يمكن للجمل الطويلة والمتعرجة أن تجعل مقالتك مهمة شاقة للقراءة حافظ على كتابتك واضحة وموجزة وحوارية استخدم لغة جذابة تدعو القارئ إلى الاستمرار كما أن طرح الأسئلة أو استخدام تقنيات سرد القصص يمكن أن يساعد أيضاً
8. عدم تحديث المحتوى القديم
بمجرد نشر مقال من السهل نسيانه لكن المحتوى الدائم يمكن أن يحرك حركة المرور لفترة طويلة بعد نشرها لأول مرة إذا أهملت تحديث المحتوى الخاص بك بأحدث المعلومات أو الإحصائيات أو الاتجاهات فقد يتجاهلها القراء لصالح الموارد الأحدث يمكن أن تساعد مراجعة مقالاتك وتحديثها بانتظام في بقائها مرئية وقيمة
الخلاصة
يمكن أن يؤدي تجنب هذه الأخطاء الشائعة إلى تعزيز ظهور مقالاتك بشكل كبير ركز على العناوين القوية وتحسين محرك البحث واستهداف الجمهور والترويج ولا تنسى هيكلة مقالاتك لسهولة القراءة والاستمرار في تقديم القيمة مع رؤى فريدة، فمع القليل من الاستراتيجية يمكن أن يبرز محتواك في الفضاء الرقمي المزدحم!
Imagine getting paid to do something you love: reading books! While it may sound like a dream, there are legitimate websites and platforms offering substantial rewards for reading and reviewing books, sometimes paying over $500 per read. Here’s a closer look at how you can monetize your passion for books and turn it into a profitable side hustle or even a full-time gig.
1. Kirkus Media
Kirkus Reviews is well-known for its book reviews, especially for indie and self-published authors. They frequently seek talented readers to review unpublished manuscripts, and experienced reviewers can earn around $50-$500 per review depending on the length and complexity. Their demand for unbiased, critical reviews means they expect high-quality feedback.
How to Apply: Submit a resume, writing samples, and a cover letter to Kirkus Media.
Pay: $50-$500 depending on the book and review length.
2. The U.S. Review of Books
The U.S. Review of Books pays freelancers to write detailed book reviews. They accept applications from experienced writers and literary enthusiasts alike. Reviews are typically 250-300 words, and while not every book will yield $500, multiple reviews per month can add up to a significant side income.
How to Apply: Submit a sample review and resume.
Pay: Varies based on assignment; high-demand books can net you substantial pay.
3. Reedsy Discovery
Reedsy Discovery is a platform where reviewers can read and review upcoming books before they’re released. While the pay structure depends on tips from readers, popular reviewers on the platform can receive over $500 monthly, especially if they build a strong following and review frequently. Reviewers are given free access to advance copies of books.
How to Apply: Create a profile on Reedsy and submit sample reviews.
Pay: Based on tips and reputation, can exceed $500 per month.
4. Online Book Club
Online Book Club offers book lovers the chance to earn while reading and reviewing books. While the first few reviews may be unpaid, experienced members who provide high-quality feedback can earn significantly, with the potential for $60-$100 per review. Over time, consistent work can allow you to make more than $500.
How to Apply: Sign up on their platform, and begin reviewing books.
Pay: Up to $100 per review, depending on your experience and engagement.
Advertisements
5. BookBrowse
BookBrowse looks for in-depth reviews of fiction and non-fiction books. They are selective with their reviewers, focusing on quality. Though their rates may start lower, experienced reviewers can earn over $500 if they establish a solid reputation and regularly contribute high-quality reviews.
How to Apply: Join their team by submitting a resume and a sample of your writing.
Pay: Varies with potential for significant earnings over time.
6. NetGalley
NetGalley connects reviewers with publishers, giving them access to books before their release. Although NetGalley itself doesn’t pay for reviews, many freelance reviewers utilize the books they receive to review on platforms like Medium, personal blogs, or even self-publish their reviews. Combining these strategies can lead to substantial earnings, well over $500 if you publish consistently.
How to Apply: Sign up as a reviewer.
Pay: Indirect, depends on where you publish reviews.
7. WordsRated
WordsRated offers a unique way to get paid for reading. They are a research data organization that pays people to read books and track various details, such as character development and theme progression. While it’s more data collection than book reviewing, it’s a fascinating option for people who love reading and analyzing books.
How to Apply: Submit an application on their website.
Pay: Can range from $200 to over $500 depending on the project.
8. Booklist Online
Booklist, the review publication of the American Library Association, is constantly on the lookout for freelance book reviewers. Writers who produce detailed, thoughtful, and concise reviews can earn a decent amount for their efforts, with seasoned reviewers capable of making over $500 a month through consistent work.
How to Apply: Contact the editor and submit a sample of your work.
Pay: Varies with potential for steady earnings over time.
9. Women’s Review of Books
A publication focusing on books by and about women, this outlet pays freelance reviewers to read and critique books. Writers with experience in literary criticism, academia, or the publishing industry are especially in demand.
How to Apply: Submit your application along with samples of previous reviews.
Pay: Can reach up to $500 for high-demand assignments.
Tips to Maximize Your Earnings:
Consistency is Key: The more books you review, the more you can earn. Focus on building a portfolio of quality reviews.
Diversify Platforms: Write for multiple websites and platforms to increase your income streams.
Promote Your Reviews: Platforms like Reedsy and Online Book Club allow reviewers to earn tips. Engage with your audience to maximize your earnings.
Conclusion
If you’re passionate about reading and want to turn that passion into a profitable endeavor, these platforms offer exciting opportunities to get paid for reading books. While it might take some time to build up to earning $500 per book, with dedication and the right strategy, you can definitely turn reading into a lucrative side hustle.
Advertisements
كيف يمكنك كسب أكثر من 500 دولار مقابل قراءة الكتب؟
Advertisements
تخيل أنك تحصل على أجر مقابل القيام بشيء تحبه: قراءة الكتب! في حين قد يبدو الأمر وكأنه حلم إلا أن هناك مواقع ومنصات شرعية تقدم مكافآت كبيرة لقراءة الكتب ومراجعتها وأحياناً تدفع أكثر من 500 دولار مقابل كل قراءة إليك نظرة عن قرب على كيفية تحقيق الدخل من شغفك بالكتب وتحويله إلى عمل جانبي مربح أو حتى وظيفة بدوام كامل
1.Kirkus Media
تشتهر هذه المنصة بمراجعات الكتب وخاصة للمؤلفين المستقلين والمنشورين ذاتياً غالباً ما يبحثون عن قراء موهوبين لمراجعة المخطوطات غير المنشورة ويمكن للمراجعين ذوي الخبرة كسب ما بين 50 إلى 500 دولار لكل مراجعة اعتماداً على الطول والتعقيد، إن طلبهم للمراجعات غير المتحيزة والنقدية يعني أنهم يتوقعون ردود فعل عالية الجودة
كيفية التقديم: أرسل سيرتك الذاتية وعينات الكتابة وخطاب التقديم إلى هذه المنصة
الراتب: 50 إلى 500 دولار اعتماداً على الكتاب وطول المراجعة
2.The US Review of Books
يدفع هذا الموقع للمستقلين مقابل كتابة مراجعات تفصيلية للكتب وتقبل المجلة الطلبات من الكتاب ذوي الخبرة وعشاق الأدب على حد سواء وعادة ما تكون المراجعات من 250 إلى 300 كلمة وفي حين أن كل كتاب لن يدر 500 دولار فإن المراجعات المتعددة شهرياً قد تؤدي إلى دخل جانبي كبير
كيفية التقديم: أرسل مراجعة نموذجية وسيرة ذاتية
الراتب: يختلف بناءً على المهمة؛ يمكن أن تدر الكتب ذات الطلب المرتفع عليك أجراً كبيراً
3. Reedsy Discovery
وهو عبارة عن منصة حيث يمكن للمراجعين قراءة ومراجعة الكتب القادمة قبل إصدارها وبينما يعتمد هيكل الأجر على النصائح من القراء، يمكن للمراجعين المشهورين على المنصة تلقي أكثر من 500 دولار شهرياً خاصةً إذا بنوا قاعدة جماهيرية قوية وراجعوا الكتب بشكل متكرر يُمنح المراجعون إمكانية الوصول المجاني إلى نسخ مسبقة من الكتب
كيفية التقديم: أنشئ ملفاً شخصياً على هذا الموقع وأرسل مراجعات نموذجية
الراتب: بناءً على النصائح والسمعة يمكن أن يتجاوز 500 دولار شهرياً
Online Book Club4.
يقدم نادي الكتاب عبر الإنترنت لمحبي الكتب فرصة الكسب أثناء قراءة الكتب ومراجعتها وبينما قد تكون المراجعات القليلة الأولى غير مدفوعة الأجر، يمكن للأعضاء ذوي الخبرة الذين يقدمون تعليقات عالية الجودة أن يكسبوا بشكل كبير مع إمكانية الحصول على 60 إلى 100 دولار لكل مراجعة بمرور الوقت، يمكن أن يسمح لك العمل المستمر بكسب أكثر من 500 دولار
كيفية التقديم: سجل على منصتهم وابدأ في مراجعة الكتب
الراتب: يصل إلى 100 دولار لكل مراجعة حسب خبرتك ومشاركتك
Advertisements
5. BookBrowse
تبحث هذه المنصة عن مراجعات متعمقة للكتب الخيالية وغير الخيالية وهم انتقائيون مع مراجعيهم ويركزون على الجودة على الرغم من أن أسعارهم قد تبدأ أقل إلا أن المراجعين ذوي الخبرة يمكنهم كسب أكثر من 500 دولار إذا أسسوا سمعة طيبة وساهموا بانتظام بمراجعات عالية الجودة
كيفية التقديم: انضم إلى فريقهم من خلال إرسال سيرة ذاتية وعينة من كتاباتك
الراتب: يختلف مع إمكانية تحقيق مكاسب كبيرة بمرور الوقت
6. NetGalley
تربط هذه المنصة المراجعين بالناشرين مما يتيح لهم الوصول إلى الكتب قبل إصدارها على الرغم من أن هذه المنصة نفسها لا تدفع مقابل المراجعات إلا أن العديد من المراجعين المستقلين يستخدمون الكتب التي يتلقونها
أو المدونات الشخصية Medium للمراجعة على منصات مثل
أو حتى نشر مراجعاتهم بأنفسهم يمكن أن يؤدي الجمع بين هذه الاستراتيجيات إلى أرباح كبيرة قد تصل إلى أكثر من 500 دولار إذا نشرت باستمرار
كيفية التقديم: سجل كمراجع
الراتب: غير مباشر يعتمد على المكان الذي تنشر فيه المراجعات
7. WordsRated
يقدم هذا الموقع طريقة فريدة للحصول على أجر مقابل القراءة إنها منظمة بيانات بحثية تدفع للأشخاص لقراءة الكتب وتتبع تفاصيل مختلفة مثل تطوير الشخصية وتقدم الموضوع في حين أنها عبارة عن جمع بيانات أكثر من مراجعة الكتب، إلا أنها خيار رائع للأشخاص الذين يحبون قراءة الكتب وتحليلها
كيفية التقديم: قدم طلباً على موقع الويب الخاص بهم
الراتب: يمكن أن يتراوح من 200 دولار إلى أكثر من 500 دولار حسب المشروع
8. Booklist Online
تبحث هذه المنصة وهي مجلة المراجعة التابعة لجمعية المكتبات الأمريكية باستمرار عن مراجعين مستقلين للكتب، ويمكن للكتاب الذين ينتجون مراجعات مفصلة ومدروسة وموجزة أن يكسبوا مبلغاً لائقاً مقابل جهودهم، حيث يمكن للمراجعين المخضرمين كسب أكثر من 500 دولار شهرياً من خلال العمل المستمر
كيفية التقديم: اتصل بالمحرر وقدم عينة من عملك
الراتب: يختلف مع إمكانية تحقيق أرباح ثابتة بمرور الوقت
9. Women’s Review of Books
تركز هذه المجلة على الكتب التي كتبتها النساء وحولها وتدفع هذه المجلة للمراجعين المستقلين لقراءة الكتب وانتقادها الكتاب الذين لديهم خبرة في النقد الأدبي أو الأوساط الأكاديمية أو صناعة النشر مطلوبون بشكل خاص
كيفية التقديم: قدم طلبك مع عينات من المراجعات السابقة
الراتب: يمكن أن يصل إلى 500 دولار للمهام ذات الطلب المرتفع
:نصائح لزيادة أرباحك إلى أقصى حد
الاتساق هو المفتاح: كلما زاد عدد الكتب التي تراجعها زادت أرباحك، ركز على بناء محفظة من المراجعات الجيدة
تنويع المنصات: اكتب لمواقع ومنصات متعددة لزيادة مصادر دخلك
Reedsy و Online Book Club ترويج لمراجعاتك: تسمح منصات مثل
للمراجعين بكسب الإكراميات تواصل مع جمهورك لزيادة أرباحك إلى أقصى حد
الخلاصة
إذا كنت شغوفاً بالقراءة وترغب في تحويل هذا الشغف إلى مسعى مربح فإن هذه المنصات تقدم فرصاً مثيرة للحصول على أجر مقابل قراءة الكتب وبينما قد يستغرق الأمر بعض الوقت للوصول إلى ربح 500 دولار لكل كتاب فمن خلال التفاني والاستراتيجية الصحيحة يمكنك بالتأكيد تحويل القراءة إلى عمل جانبي مربح
In today’s data-driven world, networking is essential for data scientists looking to grow their careers. Whether you’re just starting out or already an experienced professional, building a strong network can open doors to new opportunities, collaborations, and insights. Here are some strategies to effectively network as a data scientist.
1. Join Data Science Communities and Forums
Becoming an active member of data science communities is one of the best ways to meet like-minded professionals. Online platforms such as Kaggle, Reddit’s data science community, or Stack Overflow allow you to share your work, ask for advice, and participate in discussions. These forums can also serve as a platform to showcase your expertise.
Suggestions:
Participate in Kaggle competitions.
Answer questions on Stack Overflow.
Engage in Reddit threads focused on data science topics.
2. Attend Data Science Meetups and Conferences
Attending meetups, webinars, and conferences can put you face-to-face with industry experts, recruiters, and other professionals. These events provide opportunities to exchange ideas, learn about new trends, and gain insights into how others are tackling challenges in the field. Major conferences like Strata Data Conference, KDD, or PyData are great places to start.
Tips:
Prepare a short introduction about yourself, highlighting your skills and interests.
Have a few questions ready for speakers and attendees to facilitate meaningful conversations.
Follow up with people you meet through LinkedIn or email.
3. Leverage LinkedIn
LinkedIn remains one of the most powerful platforms for professional networking. As a data scientist, keeping your profile updated with your latest projects, publications, and skills can attract recruiters, potential collaborators, or mentors. Joining data science groups and actively participating in discussions also helps build visibility.
Actionable Steps:
Post regularly about your projects, industry trends, or data science news.
Connect with other professionals, and personalize your connection requests with a short note.
Engage with content shared by others in the industry by liking, commenting, or sharing.
4. Contribute to Open-Source Projects
One of the most effective ways to build a network is through contributions to open-source projects. Contributing to libraries like TensorFlow, PyTorch, or pandas showcases your expertise while providing the chance to collaborate with experienced developers and data scientists.
How to Start:
Explore repositories on GitHub that interest you.
Start by fixing bugs, writing documentation, or adding new features.
Engage with the community of contributors and ask questions.
Advertisements
5. Collaborate on Projects
Collaborating with others on data science projects not only helps you build your portfolio but also expands your professional network. You can team up with other data scientists from online communities, boot camps, or meetups to work on real-world problems or open-source projects.
Where to Find Collaborators:
Join hackathons or data science competitions (e.g., Kaggle).
Reach out to peers in online forums, such as LinkedIn or GitHub, for project collaboration.
Participate in collaborative events like Datathons or sprints.
6. Engage with Thought Leaders
Following and engaging with thought leaders in the data science community is a great way to stay informed about the latest trends and advancements. Many influential data scientists share valuable content through blogs, podcasts, YouTube channels, and social media platforms. Commenting on their content or asking insightful questions can initiate meaningful exchanges.
Key Thought Leaders to Follow:
Andrew Ng (Coursera, AI pioneer)
Hilary Mason (Cloudera Fast Forward Labs)
Hadley Wickham (RStudio, tidyverse)
Ben Lorica (O’Reilly Media)
Engage with them on platforms like Twitter or by attending their webinars and talks.
7. Offer to Help or Mentor Others
Networking is a two-way street, and helping others is a great way to build long-lasting relationships. As you gain more experience, consider offering mentorship to newcomers or providing assistance in areas where others might struggle. Not only does this strengthen your network, but it also builds goodwill within the community.
Ways to Contribute:
Offer to review someone’s code or provide feedback on their portfolio.
Share resources that helped you learn or overcome challenges.
Provide mentorship through programs or boot camps.
Conclusion
Networking as a data scientist involves more than just attending events and collecting contacts. It’s about building meaningful, mutually beneficial relationships that can help you stay informed, find collaborators, and advance your career. By engaging with communities, contributing to open-source projects, and consistently interacting with professionals in the field, you can develop a strong network that will support your growth in the rapidly evolving world of data science.
Advertisements
كيفية التواصل مع الآخرين كعالِم بيانات – بناء علاقات مفيدة
Advertisements
في عالم اليوم الذي تحركه البيانات يعد التواصل أمراً ضرورياً لعلماء البيانات الذين يتطلعون إلى تنمية حياتهم المهنية سواء كنت قد بدأت للتو أو كنت محترفاً متمرساً بالفعل فإن بناء شبكة قوية يمكن أن يفتح الأبواب أمام فرص جديدة وتعاونات ورؤى فيما يلي بعض الاستراتيجيات للتواصل بشكل فعال كعالم بيانات
1. الانضمام إلى مجتمعات ومنتديات علوم البيانات
يعد أن تصبح عضواً نشطاً في مجتمعات علوم البيانات أحد أفضل الطرق لمقابلة محترفين متشابهين في التفكير
Kaggle تتيح لك المنصات عبر الإنترنت مثل
Stack Overflow أو Reddit أو مجتمع علوم البيانات في
مشاركة عملك وطلب النصيحة والمشاركة في المناقشات يمكن أن تعمل هذه المنتديات أيضاً كمنصة لعرض خبرتك
:الاقتراحات
Kaggle المشاركة في مسابقات *
Stack Overflow الإجابة على الأسئلة على *
التي تركز على مواضيع علوم البيانات Reddit المشاركة في مواضيع *
2. حضور اجتماعات ومؤتمرات علوم البيانات
إن حضور الاجتماعات والندوات عبر الإنترنت والمؤتمرات يمكن أن يضعك وجهاً لوجه مع خبراء الصناعة وموظفي التوظيف وغيرهم من المهنيين، توفر هذه الأحداث فرصاً لتبادل الأفكار والتعرف على الاتجاهات الجديدة واكتساب رؤى حول كيفية معالجة الآخرين للتحديات في هذا المجال المؤتمرات الكبرى
PyData أو KDD أو Strata Data مثل مؤتمر
هي أماكن رائعة للبدء
:نصائح
قم بإعداد مقدمة قصيرة عن نفسك مع تسليط الضوء على مهاراتك واهتماماتك *
قم بإعداد بعض الأسئلة للمتحدثين والحاضرين لتسهيل المحادثات الهادفة *
أو البريد الإلكتروني LinkedIn تابع الأشخاص الذين تقابلهم عبر *
3. LinkedIn استفد من
أحد أقوى المنصات للتواصل المهني LinkedIn يظل
بصفتك عالم بيانات فإن تحديث ملفك الشخصي بأحدث مشاريعك ومنشوراتك ومهاراتك يمكن أن يجذب موظفي التوظيف أو المتعاونين المحتملين أو المرشدين كما يساعد الانضمام إلى مجموعات علوم البيانات والمشاركة بنشاط في المناقشات في بناء الرؤية
:خطوات قابلة للتنفيذ
انشر بانتظام عن مشاريعك أو اتجاهات الصناعة أو أخبار علوم البيانات *
تواصل مع محترفين آخرين وقم بتخصيص طلبات الاتصال الخاصة بك بملاحظة قصيرة *
تفاعل مع المحتوى الذي شاركه آخرون في الصناعة من خلال الإعجاب أو التعليق أو المشاركة *
4. ساهم في مشاريع مفتوحة المصدر
تُعد المساهمات في مشاريع مفتوحة المصدر واحدة من أكثر الطرق فعالية لبناء شبكة
pandas أو PyTorch أو TensorFlow تُبرز المساهمة في المكتبات مثل
خبرتك مع توفير فرصة للتعاون مع المطورين وعلماء البيانات ذوي الخبرة
:كيفية البدء
التي تهمك GitHub استكشف المستودعات على *
ابدأ بإصلاح الأخطاء أو كتابة الوثائق أو إضافة ميزات جديدة *
تفاعل مع مجتمع المساهمين واطرح الأسئلة *
Advertisements
5. تعاون في المشاريع
لا يساعدك التعاون مع الآخرين في مشاريع علوم البيانات في بناء محفظتك فحسب بل يوسع أيضاً شبكتك المهنية يمكنك التعاون مع علماء بيانات آخرين من المجتمعات عبر الإنترنت أو المعسكرات التدريبية أو اللقاءات للعمل على مشاكل العالم الحقيقي أو مشاريع مفتوحة المصدر
:أين تجد المتعاونين
Kaggle انضم إلى مسابقات علوم البيانات مثل منصة *
تواصل مع الزملاء في المنتديات عبر الإنترنت *
للتعاون في المشروع GitHub أو LinkedIn مثل
شارك في الأحداث التعاونية مثل المسابقات أو السباقات *
6. تواصل مع قادة الفكر
إن متابعة قادة الفكر في مجتمع علوم البيانات والتواصل معهم هي طريقة رائعة للبقاء على اطلاع بأحدث الاتجاهات والتطورات يشارك العديد من علماء البيانات المؤثرين محتوى قيماً من خلال المدونات والبودكاست وقنوات يوتيوب ومنصات التواصل الاجتماعي يمكن أن يؤدي التعليق على محتواهم أو طرح أسئلة ثاقبة إلى بدء تبادلات مفيدة
:قادة فكريون رئيسيون يجب متابعتهم
Andrew Ng (Coursera, AI pioneer)
Hilary Mason (Cloudera Fast Forward Labs)
Hadley Wickham (RStudio, tidyverse)
Ben Lorica (O’Reilly Media)
تواصل معهم على منصات مثل تويتر أو من خلال حضور ندواتهم عبر الإنترنت ومحاضراتهم
7. عرض المساعدة أو توجيه الآخرين
التواصل هو طريق ذو اتجاهين ومساعدة الآخرين هي وسيلة رائعة لبناء علاقات طويلة الأمد مع اكتساب المزيد من الخبرة، فكر في تقديم التوجيه والإرشاد للقادمين الجدد أو تقديم المساعدة في المجالات التي قد يواجه فيها الآخرون صعوبات هذا لا يعزز شبكتك فحسب بل إنه يبني أيضاً حسن النية داخل المجتمع
:طرق المساهمة
عرض مراجعة كود شخص ما أو تقديم ملاحظات حول محفظته *
مشاركة الموارد التي ساعدتك على التعلم أو التغلب على التحديات *
تقديم التوجيه والإرشاد من خلال البرامج أو المعسكرات التدريبية *
الاستنتاج
إن التواصل كعالم بيانات لا يقتصر على حضور الفعاليات وجمع جهات الاتصال بل يتعلق ببناء علاقات مفيدة ومتبادلة المنفعة يمكن أن تساعدك على البقاء على اطلاع والعثور على المتعاونين وتعزيز حياتك المهنية، من خلال التواصل مع المجتمعات والمساهمة في مشاريع مفتوحة المصدر والتفاعل باستمرار مع المحترفين في هذا المجال يمكنك تطوير شبكة قوية من شأنها دعم نموك في عالم علوم البيانات سريع التطور
In recent years, the path to a career in data science has become more flexible. Large tech companies, including Meta (formerly Facebook), increasingly recognize that skills, experience, and demonstrated expertise are just as important—if not more—than formal education. Here’s a guide on how you can land a data scientist position at Meta, even if you don’t have a traditional degree.
1. Develop Strong Foundations in Mathematics and Statistics
At the core of data science is mathematics, especially statistics and probability. These are essential for understanding data distributions, performing hypothesis testing, and building predictive models.
Self-study: Use free or affordable online resources, like Khan Academy or Coursera, to learn key mathematical concepts.
Practice problem-solving: Engage with platforms like Brilliant.org, which can help deepen your understanding of mathematical principles through interactive exercises.
2. Master Programming Skills
A data scientist’s primary tool is code, and Python and SQL are two languages you must master. Python is essential for data manipulation, analysis, and machine learning, while SQL is used for querying databases.
Python: Focus on libraries such as pandas (for data manipulation), NumPy (for numerical computing), and matplotlib or seaborn (for visualization). Scikit-learn is key for machine learning tasks.
SQL: Learn how to write complex queries and optimize them for performance.
R (Optional): While Meta primarily uses Python, R is another popular language in the data science community for statistical analysis.
Many resources are available, such as:
Codecademy and DataCamp offer interactive courses for both Python and SQL.
LeetCode and HackerRank provide coding challenges that will help you strengthen your problem-solving skills.
3. Gain Proficiency in Data Science Tools
In addition to programming, you’ll need hands-on experience with tools that data scientists use daily. These include:
Jupyter Notebooks: Essential for writing, testing, and sharing code in a readable format.
Tableau or Power BI: Visualization tools that allow you to turn raw data into easily digestible insights.
GitHub: For version control and collaborative coding. Create projects and contribute to open-source initiatives to showcase your work.
AWS, GCP, or Azure: Familiarity with cloud services is crucial, as many companies run large-scale data operations on cloud platforms.
Advertisements
4. Build a Strong Portfolio
Your portfolio will be your most powerful tool when applying for a data science job without a degree. Use it to showcase projects that demonstrate your skills, problem-solving abilities, and creativity. Key projects to consider include:
Predictive models: Create machine learning models that solve real-world problems. Examples include predictive analytics for financial markets, customer behavior, or recommendation systems.
Data visualizations: Use tools like Tableau or Plotly to turn complex datasets into easy-to-understand visual representations.
Kaggle Competitions: Participating in Kaggle data science competitions allows you to solve real-world data problems and gain recognition. Winning or ranking highly in these competitions can help you stand out.
Open-source contributions: Contribute to or build open-source projects related to data science.
5. Network and Build Connections
While skills and experience matter, networking plays an essential role in getting hired. Here’s how you can build connections:
Attend industry conferences and meetups: Events like PyData, Strata Data Conference, or Meetups focused on data science are great for networking.
LinkedIn: Follow Meta’s employees and recruiters on LinkedIn. Engage with their posts, share your projects, and reach out for informational interviews.
GitHub and Kaggle communities: Collaborating on open-source projects or Kaggle competitions can help you make connections in the industry.
Mentorship: Look for mentors in the data science field who can provide guidance, feedback on your portfolio, and career advice.
6. Learn Meta’s Specific Requirements
Meta’s data scientist role is unique because it emphasizes both technical and analytical skills. Meta typically looks for candidates who are:
Product-focused: You should understand how data science can impact products and user experience.
Curious and independent thinkers: Meta values individuals who can identify problems, propose solutions, and work independently.
Great communicators: You need to translate complex data insights into actionable business strategies that non-technical stakeholders can understand.
7. Prepare for Meta’s Interview Process
Once you land an interview, you’ll need to pass Meta’s rigorous technical and behavioral assessments. Here are the steps:
Technical interviews: Expect questions focused on SQL, Python, and statistical problem-solving. You may also face case studies that test your ability to analyze and interpret data.
Behavioral interviews: These focus on Meta’s core values and your ability to work in teams. Expect questions about challenges you’ve faced, how you approach problem-solving, and how you’ve used data to make product decisions in the past.
To prepare:
Use LeetCode for SQL and Python challenges.
Review statistics and probability concepts thoroughly.
Practice case study interviews through platforms like Interview Query.
8. Showcase Soft Skills
Finally, success at Meta isn’t just about technical know-how. They value soft skills like:
Problem-solving: Show that you can approach complex problems with a structured mindset and logical thinking.
Collaboration: Data scientists often work cross-functionally. Highlight your experience working with teams from different disciplines, such as engineers or product managers.
Communication: Be prepared to explain technical details to non-technical stakeholders. This is crucial in demonstrating your business acumen and value.
Final Thoughts
While a degree can open doors, it is by no means the only path to becoming a data scientist at Meta. By focusing on building practical skills, developing a strong portfolio, and networking effectively, you can stand out to hiring managers—even without formal academic credentials. Meta and other tech giants are increasingly focused on hiring the best talent, regardless of educational background, making this an exciting time to enter the field of data science.
Advertisements
بدون شهادة أكاديمية كيف يمكنك الحصول على وظيفة عالم بيانات في شركة ميتا
Advertisements
في السنوات الأخيرة أصبح الطريق إلى مهنة في علم البيانات أكثر مرونة إذ تدرك شركات التكنولوجيا الكبيرة بما في ذلك شركة ميتا بشكل متزايد أن المهارات والخبرة، والخبرة مهمة بنفس القدر – إن لم تكن أكثر – من التعليم الرسمي
إليك دليل حول كيفية الحصول على وظيفة عالم بيانات في شركة ميتا حتى لو لم يكن لديك شهادة تقليدية
1. تطوير أسس قوية في الرياضيات والإحصاء
في صميم علم البيانات توجد الرياضيات وخاصة الإحصاء والاحتمالات، هذه ضرورية لفهم توزيعات البيانات وإجراء اختبار الفرضيات وبناء النماذج التنبؤية
الدراسة الذاتية: استخدم الموارد المجانية أو بأسعار معقولة عبر الإنترنت
لتعلم المفاهيم الرياضية الأساسية Coursera أو Khan Academy مثل
:ممارسة حل المشكلات
Brilliant.org التفاعل مع منصات مثل
والتي يمكن أن تساعد في تعميق فهمك للمبادئ الرياضية من خلال التمارين التفاعلية
2. إتقان مهارات البرمجة
الأداة الأساسية لعالم البيانات هي الكود
هما لغتان يجب إتقانهما SQL و Python
ضروري لمعالجة البيانات وتحليلها والتعلم الآلي Python
لاستعلام قواعد البيانات SQL بينما يتم استخدام
يعتبر اختياري R
بينما تستخدم ميتا لغة بايثون بشكل أساسي
هي لغة شائعة أخرى في مجتمع علوم البيانات للتحليل الإحصائي R فإن
:يتوفر العديد من الموارد مثل
Python و SQL دورات تفاعلية لكل من DataCamp و Codecademy يقدم
تحديات برمجة ستساعدك على تعزيز مهارات حل المشكلات HackerRank و LeetCode يوفر
3. اكتساب الكفاءة في أدوات علوم البيانات
بالإضافة إلى البرمجة ستحتاج إلى خبرة عملية في الأدوات التي يستخدمها علماء البيانات يومياً وتشمل هذه
Jupyter Notebooks
ضروري لكتابة واختبار ومشاركة التعليمات البرمجية بتنسيق قابل للقراءة
Tableau أو Power BI
أدوات التصور التي تسمح لك بتحويل البيانات الخام إلى رؤى سهلة الفهم
GitHub
للتحكم في الإصدارات والترميز التعاوني، قم بإنشاء مشاريع والمساهمة في مبادرات مفتوحة المصدر لعرض عملك
AWS أو GCP أو Azure
تعد المعرفة بخدمات الحوسبة السحابية أمراً بالغ الأهمية حيث تدير العديد من الشركات عمليات بيانات واسعة النطاق على منصات الحوسبة السحابية
Advertisements
4. بناء محفظة قوية
ستكون محفظة أعمالك هي أداة قوية لديك عند التقدم لوظيفة في علم البيانات بدون شهادة، استخدمها لعرض المشاريع التي توضح مهاراتك وقدراتك على حل المشكلات وإبداعك، تشمل المشاريع الرئيسية التي يجب مراعاتها
النماذج التنبؤية: قم بإنشاء نماذج التعلم الآلي التي تحل مشاكل العالم الحقيقي، تشمل الأمثلة التحليلات التنبؤية للأسواق المالية أو سلوك العملاء أو أنظمة التوصية
Plotly أو Tableau تصورات البيانات: استخدم أدوات مثل
لتحويل مجموعات البيانات المعقدة إلى تمثيلات مرئية سهلة الفهم
:Kaggle مسابقات
Kaggle تتيح لك المشاركة في مسابقات علوم البيانات
حل مشاكل البيانات في العالم الحقيقي والحصول على التقدير، الفوز أو الحصول على مرتبة عالية في هذه المسابقات يمكن أن يساعدك على التميز
المساهمات مفتوحة المصدر: المساهمة في أو بناء مشاريع مفتوحة المصدر تتعلق بعلم البيانات
5. التواصل وبناء الاتصالات
في حين أن المهارات والخبرة مهمة فإن التواصل يلعب دوراً أساسياً في الحصول على وظيفة، إليك كيفية بناء الاتصالات
:حضور المؤتمرات والاجتماعات الصناعية
Strata Data أو مؤتمر PyData الأحداث مثل
أو الاجتماعات التي تركز على علم البيانات رائعة للتواصل
LinkedIn ومسؤولي التوظيف على Meta تابع موظفي :LinkedIn
تفاعل مع منشوراتهم وشارك مشاريعك وتواصل معهم لإجراء مقابلات إعلامية
:GitHub و Kaggleمجتمعات
يمكن أن يساعدك التعاون في مشاريع مفتوحة المصدر
في تكوين اتصالات في الصناعة Kaggle أو مسابقات
الإرشاد: ابحث عن مرشدين في مجال علم البيانات يمكنهم تقديم التوجيه وردود الفعل على محفظتك ونصائح مهنية
6. تعرف على المتطلبات المحددة لشركة ميتا
دور عالم البيانات في شركة ميتا فريد من نوعه لأنه يؤكد على المهارات الفنية والتحليلية، تبحث شركة ميتا عادةً عن مرشحين
يركزون على المنتج: يجب أن تفهم كيف يمكن لعلم البيانات أن يؤثر على المنتجات وتجربة المستخدم
مفكرون ومستقلون: تقدر ميتا الأفراد الذين يمكنهم تحديد المشكلات واقتراح الحلول والعمل بشكل مستقل
متواصلون رائعون: تحتاج إلى ترجمة رؤى البيانات المعقدة إلى استراتيجيات عمل قابلة للتنفيذ يمكن لأصحاب المصلحة غير الفنيين فهمها
7. الاستعداد لعملية المقابلة في شركة ميتا
:بمجرد حصولك على مقابلة ستحتاج إلى اجتياز التقييمات الفنية والسلوكية الصارمة في شركة ميتا، إليك الخطوات
SQL و Python المقابلات الفنية: توقع أسئلة تركز على
وحل المشكلات الإحصائية، قد تواجه أيضاً دراسات حالة تختبر قدرتك على تحليل البيانات وتفسيرها
المقابلات السلوكية: تركز هذه على القيم الأساسية في شركة ميتا وقدرتك على العمل في فرق، توقع أسئلة حول التحديات التي واجهتها وكيف تتعامل مع حل المشكلات وكيف استخدمت البيانات لاتخاذ قرارات المنتج في الماضي
:للتحضير
SQL و Python لتحديات LeetCode استخدم
راجع مفاهيم الإحصائيات والاحتمالات بدقة تدرب على مقابلات دراسة الحالة من خلال منصات
Interview Query مثل
8. عرض المهارات الشخصية
: أخيراً لا يقتصر النجاح في شركة ميتا على المعرفة الفنية فحسب فهم يقدرون المهارات الشخصية مثل
حل المشكلات: أظهر أنك قادر على التعامل مع المشكلات المعقدة بعقلية منظمة وتفكير منطقي
التعاون: غالباً ما يعمل علماء البيانات بشكل متقاطع، سلط الضوء على خبرتك في العمل مع فرق من تخصصات مختلفة مثل المهندسين أو مديري المنتجات
التواصل: كن مستعداً لشرح التفاصيل الفنية لأصحاب المصلحة غير الفنيين، هذا أمر بالغ الأهمية لإظهار براعتك التجارية وقيمتك
نستخلص مما سبق
أنه وعلى الرغم من أن الدرجة العلمية يمكن أن تفتح الأبواب إلا أنها ليست بأي حال من الأحوال المسار الوحيد لتصبح عالم بيانات في شركة ميتا، من خلال التركيز على بناء المهارات العملية وتطوير محفظة قوية والتواصل بشكل فعال يمكنك التميز أمام مديري التوظيف – حتى بدون مؤهلات أكاديمية رسمية
تركز شركة ميتا وشركات التكنولوجيا العملاقة الأخرى بشكل متزايد على توظيف أفضل المواهب بغض النظر عن الخلفية التعليمية مما يجعل هذا وقتاً مثيراً لدخول مجال علوم البيانات
The rise of artificial intelligence (AI) has opened up numerous opportunities for generating income. With just one AI tool, you can tap into various income streams depending on your skill set and goals. Here are several ways to generate income using an AI tool:
1. Content Creation and Writing
AI-powered writing assistants (like GPT-4 or Jasper AI) can help you create content quickly and efficiently. You can offer content writing services such as:
Blog writing: AI can assist in writing SEO-friendly blog posts that attract traffic and drive engagement.
Copywriting: Use AI to generate marketing copy, product descriptions, or landing page content for businesses.
Social media management: Create engaging posts, captions, and ads for clients using AI to save time and boost productivity.
Income Potential: Freelance writing or content creation can bring in anywhere from $500 to $5000 per month, depending on the client base and project size.
2. AI-Powered Design and Video Editing
AI tools like Canva AI and Runway ML allow users to create graphic designs, edit videos, or generate animations with minimal expertise. You can offer:
Logo and brand design: Leverage AI tools to create custom logos, banners, and visual assets for businesses.
Video creation and editing: AI-based video editors allow you to produce marketing videos, YouTube content, or social media clips with minimal effort.
Income Potential: Designers and video editors can earn anywhere from $1,000 to $10,000 per month depending on project scope and complexity.
3. AI-Driven SEO Services
SEO (Search Engine Optimization) tools like Surfer SEO or SEMrush offer AI-powered insights to improve website ranking. By providing AI-enhanced SEO services, you can:
Offer keyword research: Use AI tools to uncover high-volume, low-competition keywords to drive organic traffic for clients.
Optimize web pages: AI tools can suggest improvements to content, headings, and meta descriptions for better search performance.
Generate backlinks: Use AI to analyze competitors and identify backlink opportunities.
Income Potential: SEO specialists often charge between $500 to $5000 per client each month.
Advertisements
4. AI-Based Chatbots and Customer Support
AI tools like ChatGPT, ManyChat, and Tars allow you to create intelligent chatbots for businesses to automate their customer service and sales processes. You can:
Build chatbots for websites: Create bots that handle customer inquiries, bookings, or lead generation.
Automate social media responses: Set up bots to manage customer interactions on platforms like Facebook or Instagram.
Income Potential: Developing and maintaining chatbots can generate between $500 to $2,500 per bot per month, depending on complexity and functionality.
5. Online Tutoring and Course Creation
AI tools like ChatGPT can assist in creating comprehensive online courses and tutoring services. Whether you want to create educational materials or offer tutoring in specific subjects, AI can help you:
Develop course outlines and materials: Use AI to generate lesson plans, quizzes, and worksheets.
Offer personalized tutoring: Build personalized study plans for students based on their unique needs.
Income Potential: Online tutors and course creators can earn from $100 to $5,000 per month, depending on the number of students or course sales.
6. E-Commerce and Product Recommendations
AI tools like Shopify’s AI assistants or Amazon’s product recommendation algorithms can help streamline e-commerce businesses. You can:
Optimize product listings: Use AI to generate optimized descriptions and titles for better visibility.
Personalize customer experience: AI can recommend products based on customer behavior, increasing conversion rates.
Income Potential: Depending on the scale, e-commerce businesses utilizing AI tools can generate thousands to tens of thousands of dollars in monthly revenue.
Conclusion
With just one AI tool, you can access multiple streams of income. Whether it’s content creation, design, SEO, chatbot development, tutoring, or e-commerce, AI can amplify your productivity and revenue potential. The key is choosing the right AI tool for your skills and market needs. By mastering one tool, you can unlock opportunities that span across industries and client types.
Advertisements
مصادر الدخل باستخدام أداة واحدة للذكاء الاصطناعي
فتح صعود الذكاء الاصطناعي العديد من الفرص لتوليد الدخل، فباستخدام أداة واحدة للذكاء الاصطناعي يمكنك الاستفادة من مصادر دخل مختلفة اعتماداً على مجموعة مهاراتك وأهدافك
:فيما يلي عدة طرق لتوليد الدخل باستخدام أداة الذكاء الاصطناعي
1. إنشاء المحتوى وكتابته
يمكن أن تساعدك أدوات الكتابة المدعومة بالذكاء الاصطناعي
Jasper AI أو GPT-4 :مثل
:في إنشاء المحتوى بسرعة وكفاءة، يمكنك تقديم خدمات كتابة المحتوى مثل
كتابة المدونات: يمكن للذكاء الاصطناعي المساعدة في كتابة منشورات مدونة صديقة لمحركات البحث تجذب الزيارات وتزيد من المشاركة
كتابة المحتوى: استخدم الذكاء الاصطناعي لإنشاء محتوى تسويقي أو أوصاف منتجات أو صفحات مقصودة للشركات
إدارة وسائل التواصل الاجتماعي: أنشئ منشورات وتعليقات توضيحية وإعلانات جذابة للعملاء باستخدام الذكاء الاصطناعي لتوفير الوقت وتعزيز الإنتاجية
إمكانات الدخل: يمكن أن تدر الكتابة المستقلة أو إنشاء المحتوى ما بين 500 دولار إلى 5000 دولار شهرياً اعتماداً على قاعدة العملاء وحجم المشروع
2. التصميم وتحرير الفيديو المدعوم بالذكاء الاصطناعي
Runway ML و Canva AI تتيح أدوات الذكاء الاصطناعي مثل
للمستخدمين إنشاء تصميمات رسومية أو تحرير مقاطع فيديو أو إنشاء رسوم متحركة بأقل قدر من الخبرة، يمكنك تقديم الخدمات التالية
تصميم الشعار والعلامة التجارية: استفد من أدوات الذكاء الاصطناعي لإنشاء شعارات ولافتات وأصول مرئية مخصصة للشركات
إنشاء الفيديو وتحريره: تتيح لك برامج تحرير الفيديو المستندة إلى الذكاء الاصطناعي إنتاج مقاطع فيديو تسويقية أو محتوى يوتيوب أو مقاطع الوسائط الاجتماعية بأقل جهد
إمكانية الدخل: يمكن للمصممين ومحرري الفيديو كسب ما بين 1000 دولار إلى 10000 دولار شهرياً اعتماداً على نطاق المشروع وتعقيده
3. خدمات تحسين محركات البحث التي تعتمد على الذكاء الاصطناعي
SEMrush أو Surfer SEO تقدم أدوات تحسين محركات البحث مثل
رؤى مدعومة بالذكاء الاصطناعي لتحسين ترتيب موقع الويب من خلال تقديم خدمات تحسين محركات البحث المعززة بالذكاء الاصطناعي ويتم ذلك من خلال
تقديم بحث عن الكلمات الرئيسية: استخدم أدوات الذكاء الاصطناعي للكشف عن الكلمات الرئيسية عالية الحجم ومنخفضة المنافسة لقيادة حركة المرور العضوية للعملاء
تحسين صفحات الويب: يمكن لأدوات الذكاء الاصطناعي اقتراح تحسينات على المحتوى والعناوين والأوصاف التعريفية لتحسين أداء البحث
إنشاء روابط خلفية: استخدم الذكاء الاصطناعي لتحليل المنافسين وتحديد فرص إنشاء روابط خلفية
إمكانات الدخل: غالباً ما يتقاضى متخصصو تحسين محركات البحث ما بين 500 دولار إلى 5000 دولار لكل عميل شهرياً
Advertisements
4. برامج الدردشة الآلية القائمة على الذكاء الاصطناعي ودعم العملاء
Tars و ManyChatو ChatGPT تتيح لك أدوات الذكاء الاصطناعي مثل
إنشاء برامج دردشة آلية ذكية للشركات لأتمتة خدمة العملاء وعمليات المبيعات، يمكنك أن تقدم الخدمات التالية
إنشاء برامج دردشة آلية لمواقع الويب: إنشاء برامج روبوتية تتعامل مع استفسارات العملاء أو الحجوزات أو توليد العملاء المحتملين
أتمتة ردود وسائل التواصل الاجتماعي: قم بإعداد برامج روبوتية لإدارة تفاعلات العملاء على منصات مثل فيسبوك أو انستغرام
إمكانات الدخل: يمكن أن يدر تطوير برامج الدردشة الآلية وصيانتها ما بين 500 دولار إلى 2500 دولار لكل برنامج شهرياً، اعتماداً على التعقيد والوظائف
5. الدروس الخصوصية عبر الإنترنت وإنشاء الدورات التدريبية
ChatGPT يمكن لأدوات الذكاء الاصطناعي مثل
المساعدة في إنشاء دورات تدريبية شاملة عبر الإنترنت وخدمات تعليمية، سواء كنت ترغب في إنشاء مواد تعليمية أو تقديم دروس خصوصية في مواضيع محددة، يمكن للذكاء الاصطناعي مساعدتك في
تطوير مخططات الدورات والمواد: استخدم الذكاء الاصطناعي لإنشاء خطط الدروس والاختبارات وأوراق العمل
تقديم دروس خصوصية مخصصة: قم ببناء خطط دراسية مخصصة للطلاب بناءً على احتياجاتهم الفريدة
إمكانات الدخل: يمكن للمدرسين عبر الإنترنت ومنشئي الدورات التدريبية كسب ما بين 100 دولار إلى 5000 دولار شهرياً اعتماداً على عدد الطلاب أو مبيعات الدورة التدريبية
6. التجارة الإلكترونية وتوصيات المنتجات
يمكن لأدوات الذكاء الاصطناعي مثل
Shopify مساعدي الذكاء الاصطناعي في
Amazon أو خوارزميات توصية المنتجات في
أن تساعد في تبسيط أعمال التجارة الإلكترونية فيمكنك أن تقوم بالمهام التالية
تحسين قوائم المنتجات: استخدم الذكاء الاصطناعي لإنشاء أوصاف وعناوين محسنة لتحسين الرؤية
تخصيص تجربة العملاء: يمكن للذكاء الاصطناعي التوصية بالمنتجات بناءً على سلوك العملاء مما يزيد من معدلات التحويل
إمكانات الدخل: اعتماداً على الحجم يمكن لشركات التجارة الإلكترونية التي تستخدم أدوات الذكاء الاصطناعي أن تولد آلافاً إلى عشرات الآلاف من الدولارات في الإيرادات الشهرية
:نستخلص مما سبق
باستخدام أداة ذكاء اصطناعي واحدة فقط يمكنك الوصول إلى مصادر متعددة للدخل، سواء كان الأمر يتعلق بإنشاء المحتوى أو التصميم أو تحسين محركات البحث أو تطوير برامج الدردشة الآلية أو التدريس أو التجارة الإلكترونية يمكن للذكاء الاصطناعي أن يعزز إنتاجيتك وإمكانات الإيرادات والمفتاح هو اختيار أداة الذكاء الاصطناعي المناسبة لمهاراتك واحتياجات السوق، من خلال إتقان أداة واحدة يمكنك فتح الفرص التي تمتد عبر الصناعات وأنواع العملاء
In today’s data-driven world, organizations are increasingly recognizing the value of data as a strategic asset. However, the way data is delivered and consumed can greatly impact its value. The concept of delivering data as a product, rather than as an application, is gaining traction as it focuses on making data accessible, reusable, and meaningful to a broad range of users. This approach empowers stakeholders to derive insights and make decisions without being constrained by the limitations of traditional applications. Let’s explore the key principles and benefits of treating data as a product.
1. Understanding Data as a Product
When we talk about data as a product, we refer to treating data sets as standalone offerings that users can interact with independently of any specific application. This means the data is curated, well-documented, and easily accessible, much like a well-packaged consumer product. For example, a company might provide a dataset on customer purchasing behavior, along with tools for accessing, filtering, and analyzing that data. The dataset is the product, and it’s delivered in a way that allows users to derive value from it without needing to use a specific application.
Example: Imagine an e-commerce company that collects data on customer interactions. Instead of embedding this data into a specific sales application, the company offers it as a product via an API. Developers, marketers, and analysts can access this data, integrate it into their tools, and use it to gain insights. The data product could include documentation, sample queries, and best practices for use, making it valuable across different teams.
2. Why Not Deliver Data as an Application?
Applications are typically designed for specific tasks or workflows. While they can provide data, they often do so in a way that’s tightly coupled with the application’s functionality. This can limit how data is used. For instance, if customer data is only accessible through a customer relationship management (CRM) application, its use is confined to CRM-related tasks. Users can’t easily leverage the data for other purposes, such as market analysis or product development.
Delivering data as an application can also lead to silos, where different departments or teams only have access to the data through their specific applications, leading to fragmentation and inefficiencies.
Example: A healthcare provider may have patient data locked within an electronic health record (EHR) system. While the EHR is excellent for managing patient care, it might be challenging to extract data for research, population health management, or predictive analytics. If the data were delivered as a product, researchers could access it directly, apply their analytics tools, and derive new insights, unbound by the EHR’s interface or functionality.
3. Principles of Delivering Data as a Product
To successfully deliver data as a product, organizations should adhere to several key principles:
Data Accessibility: Ensure that data is easily accessible to all potential users, not just those using a specific application. This can be achieved through APIs, data warehouses, or cloud platforms that provide direct access to the data.
Documentation and Usability: Like any good product, data should come with comprehensive documentation. This includes details about the data’s structure, how it’s collected, what it represents, and how it can be used. Usability features like sample queries, data dictionaries, and visual interfaces can make the product more user-friendly.
Interoperability: Data products should be designed to work across different systems and applications. This often means adhering to standards and ensuring that data can be easily integrated with other tools and platforms.
Scalability and Security: As with any product, data must be scalable to handle varying loads and secure to protect sensitive information. This involves implementing robust access controls and ensuring data integrity.
Example: A financial services company might deliver market data as a product through a cloud-based data platform. This platform could allow users to access real-time and historical market data via APIs, with documentation on how to integrate the data into their analytics tools or trading systems. The data product could be designed to scale based on the number of users and the volume of queries while ensuring that sensitive financial information is protected.
Advertisements
4. Benefits of Data as a Product
Delivering data as a product offers numerous benefits:
Increased Data Utilization: By making data accessible and usable, organizations can increase the value derived from their data assets. Different teams can use the same data for various purposes, leading to more innovative uses.
Enhanced Collaboration: When data is treated as a product, it breaks down silos, allowing for greater collaboration across departments. Teams can access and use the same data, leading to more aligned and informed decision-making.
Flexibility and Innovation: Data products empower users to leverage data in ways that suit their specific needs. This flexibility can drive innovation, as users are not constrained by the limitations of a specific application.
Example: A retail chain could deliver its sales and inventory data as a product to its suppliers. By giving suppliers access to real-time sales data, they can better manage stock levels and anticipate demand, leading to a more efficient supply chain and reduced costs.
5. Challenges and Considerations
While the benefits are significant, there are challenges to delivering data as a product. These include ensuring data quality, managing data governance, and addressing privacy concerns. Organizations must also invest in the right infrastructure and tools to support data productization.
Example: A global corporation might face challenges in ensuring that data products are consistent across different regions with varying privacy laws and data standards. They would need to implement strict governance policies and invest in a scalable data infrastructure to manage this complexity.
Conclusion
Delivering data as a product rather than as an application represents a shift in how organizations think about and manage their data assets. By focusing on accessibility, usability, and flexibility, companies can unlock the full potential of their data, driving innovation, collaboration, and value creation across the organization. While challenges exist, the benefits of this approach make it a compelling strategy for organizations looking to stay competitive in a data-driven world.
Advertisements
قدّم معلوماتك كمنتج بدلاً من اعتبارها تطبيق
Advertisements
في عالم اليوم الذي تحركه البيانات تدرك المؤسسات بشكل متزايد قيمة البيانات كأصل استراتيجي، ومع ذلك فإن الطريقة التي يتم بها تسليم البيانات واستهلاكها يمكن أن تؤثر بشكل كبير على قيمتها يكتسب مفهوم تقديم البيانات كمنتج وليس كتطبيق زخماً لأنه يركز على جعل البيانات في متناول الجميع وقابلة لإعادة الاستخدام وذات مغزى لمجموعة واسعة من المستخدمين يعمل هذا النهج على تمكين أصحاب المصلحة من استخلاص الأفكار واتخاذ القرارات دون تقييدهم بقيود التطبيقات التقليدية دعنا نستكشف المبادئ والفوائد الرئيسية للتعامل مع البيانات كمنتج
1. فهم البيانات كمنتج
عندما نتحدث عن البيانات كمنتج فإننا نشير إلى التعامل مع مجموعات البيانات كعروض مستقلة يمكن للمستخدمين التفاعل معها بشكل مستقل عن أي تطبيق محدد وهذا يعني أن البيانات منظمة وموثقة جيداً ويمكن الوصول إليها بسهولة، تماماً مثل المنتج الاستهلاكي المعبأ جيداً، على سبيل المثال قد تقدم شركة مجموعة بيانات حول سلوك الشراء لدى العملاء جنباً إلى جنب مع أدوات للوصول إلى هذه البيانات وتصفيتها وتحليلها مجموعة البيانات هي المنتج ويتم تسليمها بطريقة تسمح للمستخدمين باستنباط القيمة منها دون الحاجة إلى استخدام تطبيق معين
مثال: تخيل شركة تجارة إلكترونية تجمع بيانات حول تفاعلات العملاء بدلاً من تضمين هذه البيانات في تطبيق مبيعات معين تعرضها الشركة كمنتج عبر واجهة برمجة التطبيقات يمكن للمطورين والمسوقين والمحللين الوصول إلى هذه البيانات ودمجها في أدواتهم واستخدامها لاكتساب رؤى يمكن أن يتضمن منتج البيانات الوثائق والاستعلامات النموذجية وأفضل الممارسات للاستخدام مما يجعله قيماً عبر فرق مختلفة
2. لماذا لا يتم تسليم البيانات كتطبيق؟
عادةً ما يتم تصميم التطبيقات لمهام أو سير عمل محددة في حين أنها يمكن أن توفر البيانات فإنها غالباً ما تفعل ذلك بطريقة مرتبطة ارتباطاً وثيقاً بوظائف التطبيق يمكن أن يحد هذا من كيفية استخدام البيانات، على سبيل المثال إذا كانت بيانات العملاء متاحة فقط
(CRM) من خلال تطبيق إدارة علاقات العملاء
فإن استخدامها يقتصر على المهام المتعلقة بإدارة علاقات العملاء لا يمكن للمستخدمين الاستفادة بسهولة من البيانات لأغراض أخرى مثل تحليل السوق أو تطوير المنتج
إن تقديم البيانات كتطبيق يمكن أن يؤدي أيضاً إلى صوامع حيث لا تتمكن الأقسام أو الفرق المختلفة من الوصول إلى البيانات إلا من خلال تطبيقاتها المحددة مما يؤدي إلى التفتت وانعدام الكفاءة
مثال: قد يكون لدى مقدم الرعاية الصحية بيانات مريض مقفلة
(EHR) داخل نظام السجلات الصحية الإلكترونية
ممتاز لإدارة رعاية المرضى EHR في حين أن
فقد يكون من الصعب استخراج البيانات للبحث أو إدارة صحة السكان أو التحليلات التنبؤية إذا تم تقديم البيانات كمنتج، يمكن للباحثين الوصول إليها مباشرة وتطبيق أدوات التحليل الخاصة بهم، واستخلاص رؤى جديدة
أو وظائفها EHR دون قيود واجهة
Advertisements
3. مبادئ تقديم البيانات كمنتج
:لتسليم البيانات بنجاح كمنتج يجب على المؤسسات الالتزام بعدة مبادئ رئيسية
إمكانية الوصول إلى البيانات: تأكد من إمكانية الوصول إلى البيانات بسهولة من قبل جميع المستخدمين المحتملين وليس فقط أولئك الذين يستخدمون تطبيقاً معيناً يمكن تحقيق ذلك من خلال واجهات برمجة التطبيقات أو مستودعات البيانات أو منصات السحابة التي توفر الوصول المباشر إلى البيانات
التوثيق وسهولة الاستخدام: مثل أي منتج جيد يجب أن تأتي البيانات مع توثيق شامل يتضمن ذلك تفاصيل حول بنية البيانات وكيفية جمعها وما تمثله وكيف يمكن استخدامها يمكن لميزات قابلية الاستخدام مثل استعلامات العينة وقواميس البيانات والواجهات المرئية أن تجعل المنتج أكثر سهولة في الاستخدام
التوافق: يجب تصميم منتجات البيانات للعمل عبر أنظمة وتطبيقات مختلفة وهذا يعني غالباً الالتزام بالمعايير وضمان إمكانية دمج البيانات بسهولة مع أدوات ومنصات أخرى
قابلية التوسع والأمان: كما هو الحال مع أي منتج يجب أن تكون البيانات قابلة للتوسع للتعامل مع الأحمال المتغيرة وآمنة لحماية المعلومات الحساسة يتضمن هذا تنفيذ ضوابط وصول قوية وضمان سلامة البيانات
مثال: قد تقدم شركة خدمات مالية بيانات السوق كمنتج من خلال منصة بيانات قائمة على السحابة يمكن أن تسمح هذه المنصة للمستخدمين بالوصول إلى بيانات السوق في الوقت الفعلي والتاريخية عبر واجهات برمجة التطبيقات مع توثيق كيفية دمج البيانات في أدوات التحليلات أو أنظمة التداول الخاصة بهم يمكن تصميم منتج البيانات للتوسع بناءً على عدد المستخدمين وحجم الاستعلامات مع ضمان حماية المعلومات المالية الحساسة
4. فوائد البيانات كمنتج
:يوفر تقديم البيانات كمنتج العديد من الفوائد
زيادة استخدام البيانات: من خلال جعل البيانات متاحة وقابلة للاستخدام، يمكن للمؤسسات زيادة القيمة المستمدة من أصول البيانات الخاصة بها يمكن للفرق المختلفة استخدام نفس البيانات لأغراض مختلفة مما يؤدي إلى استخدامات أكثر ابتكاراً
التعاون المعزز: عندما يتم التعامل مع البيانات كمنتج فإنها تكسر الصوامع مما يسمح بتعاون أكبر بين الإدارات يمكن للفرق الوصول إلى نفس البيانات واستخدامها مما يؤدي إلى اتخاذ قرارات أكثر اتساقاً واستنارة
المرونة والابتكار: تمكن منتجات البيانات المستخدمين من الاستفادة من البيانات بطرق تناسب احتياجاتهم المحددة يمكن لهذه المرونة أن تدفع الابتكار حيث لا يقيد المستخدمون بقيود تطبيق معين
مثال: يمكن لسلسلة البيع بالتجزئة تقديم بيانات المبيعات والمخزون كمنتج لمورديها من خلال منح الموردين إمكانية الوصول إلى بيانات المبيعات في الوقت الفعلي، يمكنهم إدارة مستويات المخزون بشكل أفضل وتوقع الطلب مما يؤدي إلى سلسلة توريد أكثر كفاءة وخفض التكاليف
5. التحديات والاعتبارات
في حين أن الفوائد كبيرة إلا أن هناك تحديات في تقديم البيانات كمنتج وتشمل هذه ضمان جودة البيانات وإدارة حوكمة البيانات ومعالجة مخاوف الخصوصية يجب على المنظمات أيضًا الاستثمار في البنية الأساسية والأدوات المناسبة لدعم إنتاج البيانات
مثال: قد تواجه شركة عالمية تحديات في ضمان اتساق منتجات البيانات عبر مناطق مختلفة مع قوانين خصوصية ومعايير بيانات متفاوتة ستحتاج إلى تنفيذ سياسات حوكمة صارمة والاستثمار في بنية أساسية قابلة للتطوير للبيانات لإدارة هذا التعقيد
الخلاصة
يمثل تقديم البيانات كمنتج وليس كتطبيق تحولاً في كيفية تفكير المنظمات في أصول البيانات وإدارتها من خلال التركيز على إمكانية الوصول والاستخدام والمرونة، يمكن للشركات إطلاق العنان للإمكانات الكاملة لبياناتها ودفع الابتكار والتعاون وخلق القيمة عبر المنظمة في حين أن التحديات موجودة فإن فوائد هذا النهج تجعله استراتيجية مقنعة للمنظمات التي تتطلع إلى البقاء قادرة على المنافسة في عالم مدفوع بالبيانات
YouTube has become a powerful platform for content creators to turn their passions into profitable ventures. When I first started, I never imagined that I could earn $150 per day just by sharing videos. But with time, strategy, and persistence, I made it happen. Here’s how I did it:
1. Finding My Niche
The first step was to identify a niche that I was passionate about and that had an audience. Instead of going broad, I focused on a specific topic, This helped me build a dedicated audience who were genuinely interested in my content.
2. Creating High-Quality Content
Quality is key on YouTube. I invested time in learning video editing, improving my on-camera presence, and creating scripts that kept viewers engaged. High-quality content attracts more viewers, increases watch time, and encourages subscribers, all of which are critical for monetization.
3. Consistent Upload Schedule
Consistency is one of the most important factors in growing a YouTube channel. I set a schedule and stuck to it, whether it was uploading videos once a week or twice a month. This helped in building anticipation among my audience, who knew when to expect new content.
4. Optimizing for Search (SEO)
To ensure my videos reached as many people as possible, I learned about YouTube’s search engine optimization (SEO). This involved using the right keywords in titles, descriptions, and tags. I also created custom thumbnails that stood out, which helped improve my click-through rate.
Advertisements
5. Engaging with My Audience
Building a community was essential. I made it a point to reply to comments, ask for feedback, and even create content based on my audience’s suggestions. This not only increased my viewer engagement but also encouraged loyalty and repeat viewership.
6. Monetization and Diversification
Once I hit the required threshold (1,000 subscribers and 4,000 watch hours), I applied for the YouTube Partner Program. This enabled me to earn money from ads. However, I didn’t stop there. I also explored affiliate marketing, brand deals, and even selling my own merchandise, which added multiple income streams.
7. Analyzing and Adapting
YouTube provides detailed analytics, which I used to understand what worked and what didn’t. I paid attention to metrics like watch time, audience retention, and traffic sources. This data guided my content strategy, helping me focus on what my audience loved the most.
8. Staying Patient and Persistent
Success on YouTube doesn’t happen overnight. It took months of hard work, learning, and adapting before I started seeing significant income. The key was to stay patient, keep creating content, and never give up, even when the views were low.
Conclusion
Earning $150 per day on YouTube is achievable, but it requires a combination of passion, strategy, and persistence. By focusing on quality content, optimizing for search, engaging with your audience, and exploring multiple revenue streams, you can turn your YouTube channel into a profitable venture. If I could do it, so can you!
Advertisements
كيف تمكنت من كسب 150 دولاراً يومياً على يوتيوب
Advertisements
لقد أصبح يوتيوب منصة قوية لمنشئي المحتوى لتحويل شغفهم إلى مشاريع مربحة، عندما بدأت لأول مرة لم أتخيل أبداً أنني قد أكسب 150 دولاراً يومياً بمجرد مشاركة مقاطع الفيديو ولكن مع الوقت والاستراتيجية والمثابرة تمكنت من تحقيق ذلك وإليك كيف فعلت ذلك
1. في مجال اختصاصي واهتماماتي
كانت الخطوة الأولى هي تحديد تخصص كنت شغوفاً به وكان له جمهور بدلاً من التوسع، ركزت على موضوع محدد وقد ساعدني هذا في بناء جمهور مخصص مهتم حقاً بمحتواي
2. إنشاء محتوى عالي الجودة
الجودة هي مفتاح النجاح على يوتيوب، استثمرت الوقت في تعلم تحرير الفيديو وتحسين وجودي أمام الكاميرا وإنشاء نصوص أبقت المشاهدين متفاعلين، المحتوى عالي الجودة يجذب المزيد من المشاهدين ويزيد من وقت المشاهدة ويشجع المشتركين وكل هذه الأمور مهمة لتحقيق الربح
3. جدول تحميل ثابت
التنسيق هو أحد أهم العوامل في نمو قناة يوتيوب لقد حددت جدولاً والتزمت به، سواء كان ذلك بتحميل مقاطع فيديو مرة واحدة في الأسبوع أو مرتين في الشهر ساعد هذا في بناء التوقعات بين جمهوري الذين أصبحوا يتوقعون موعد نشر محتوى جديد
4. (SEO) تحسين الظهور على محركات البحث
لضمان وصول مقاطع الفيديو الخاصة بي إلى أكبر عدد ممكن من الأشخاص
(SEO) تعلمت العمل على تحسين محرك البحث
في يوتيوب تضمَّن ذلك استخدام الكلمات الرئيسية الصحيحة في العناوين والأوصاف والعلامات كما قمت بإنشاء صور مصغرة مخصصة بارزة مما ساعد في تحسين معدل النقر إلى الظهور
Advertisements
5. التواصل مع جمهوري
كان بناء مجتمع أمراً ضرورياً لقد حرصت على الرد على التعليقات وطلب الملاحظات وحتى إنشاء محتوى بناءً على اقتراحات جمهوري، لم يؤدي هذا إلى زيادة مشاركة المشاهدين فحسب، بل شجع أيضاً الولاء والمشاهدة المتكررة
6. تحقيق الربح والتنويع
بمجرد أن بلغت الحد المطلوب (1000 مشترك و4000 ساعة مشاهدة) تقدمت بطلب إلى برنامج شركاء يوتيوب وقد مكنني هذا من كسب المال من الإعلانات، ومع ذلك لم أتوقف عند هذا الحد لقد استكشفت أيضاً التسويق بالعمولة وصفقات العلامات التجارية وحتى بيع بضاعتي الخاصة مما أضاف مصادر دخل متعددة
7. التحليل والتكيف
يوفر يوتيوب تحليلات مفصلة استخدمتها لفهم ما ينجح وما لا ينجح لقد انتبهت إلى مقاييس مثل وقت المشاهدة والاحتفاظ بالجمهور ومصادر الزيارات، وجهت هذه البيانات استراتيجية المحتوى الخاصة بي وساعدتني في التركيز على ما يحبه جمهوري أكثر
8. البقاء صبوراً ومثابراً
لا يحدث النجاح على يوتيوب بين عشية وضحاها فقد استغرق الأمر شهوراً من العمل الجاد والتعلم والتكيف قبل أن أبدأ في تحصيل دخل كبير كان المفتاح هو البقاء صبوراً والاستمرار في إنشاء المحتوى وعدم الاستسلام أبداً حتى عندما كانت المشاهدات منخفضة
الخلاصة
إن ربح 150 دولار يوميا على يوتيوب أمر ممكن لكنه يتطلب مزيجاً من الشغف والاستراتيجية والمثابرة من خلال التركيز على المحتوى عالي الجودة وتحسين البحث والتفاعل مع جمهورك واستكشاف مصادر دخل متعددة يمكنك تحويل قناتك على يوتيوب إلى مشروع مربح، فإذا كان بإمكاني القيام بذلك فيمكنك أنت أيضاً القيام بذلك!
Creating eye-catching thumbnails is crucial for the success of your YouTube channel. Thumbnails serve as the first impression for potential viewers and can significantly influence whether someone clicks on your video. Testing these thumbnails to ensure they effectively grab attention is just as important. While there are external tools available to assist with A/B testing and analytics, you can perform basic thumbnail testing directly within YouTube Studio without any third-party tools. Here’s how you can do it:
1. Use the ‘Custom Thumbnail’ Feature
YouTube allows you to upload custom thumbnails for your videos. To test different thumbnail options, follow these steps:
Go to YouTube Studio and click on “Content” in the sidebar.
Select the video you want to test.
Click on the current thumbnail to open the thumbnail selection menu.
Upload your new custom thumbnail and save the changes.
While this method doesn’t provide a direct A/B comparison, you can monitor the performance of each thumbnail over time.
2. Analyze Click-Through Rates (CTR)
The key metric to gauge thumbnail effectiveness is the Click-Through Rate (CTR). You can find this data within YouTube Studio:
Navigate to “Analytics” and select “Overview.”
Under “Reach,” you’ll see the CTR for your video.
Monitor the CTR after changing your thumbnail. A higher CTR indicates that your new thumbnail is more engaging.
Keep in mind that other factors, such as video title and metadata, also affect CTR. However, a noticeable change after updating the thumbnail can be a good indicator of its effectiveness.
Advertisements
3. Observe Viewer Engagement
Another way to test your thumbnails is by analyzing viewer behavior:
Go to the “Engagement” tab in YouTube Studio Analytics.
Look at metrics like average view duration and audience retention.
If your updated thumbnail attracts more clicks, but viewers quickly leave, it might be drawing in the wrong audience. Ensure that your thumbnail accurately represents the content of your video to maintain engagement.
4. Use Traffic Source Data
Understanding where your viewers are coming from can also provide insights into your thumbnail’s effectiveness:
In the “Reach” tab, check the “Traffic source types” section.
If you see an increase in traffic from “YouTube Search” or “Browse features” after changing the thumbnail, it’s likely more appealing to viewers browsing or searching on YouTube.
5. Compare to Similar Videos
You can compare the performance of your thumbnail with those of similar videos on your channel:
In YouTube Studio, go to “Analytics” and then “Overview.”
Scroll down to see the “Top videos” section.
Compare the CTR and engagement metrics of your video against others in the same niche.
This comparison can help you understand if the new thumbnail aligns with the overall performance trends of your content.
Conclusion
While YouTube doesn’t offer built-in A/B testing tools for thumbnails, you can still effectively test and refine your thumbnails directly within YouTube Studio. By regularly updating your thumbnails and closely monitoring metrics like CTR, engagement, and traffic sources, you can optimize your video’s first impression and boost its performance without needing any external tools. This process might require some manual effort, but the insights gained can be invaluable in growing your channel.
Advertisements
بتقييم الصور المصغرة الخاصة بك مباشرةً في ستوديو يوتيوبدون الحاجة إلى أدوات إضافية
Advertisements
يعد إنشاء صور مصغرة جذابة أمراً بالغ الأهمية لنجاح قناتك على يوتيوب، إذ تعمل الصور المصغرة بمثابة الانطباع الأول للمشاهدين المحتملين ويمكن أن تؤثر بشكل كبير على ما إذا كان شخص ما سينقر على الفيديو الخاص بك، يعد اختبار هذه الصور المصغرة للتأكد من أنها تجذب الانتباه بشكل فعال أمراً مهماً بنفس القدر في حين أن هناك أدوات خارجية
والتحليلات A/B متاحة للمساعدة في اختبار
يمكنك إجراء اختبار الصور المصغرة الأساسي مباشرةً داخل ستوديو يوتيوب بدون أي أدوات تابعة لجهات خارجية، إليك كيفية القيام بذلك
1. استخدم ميزة “الصورة المصغرة المخصصة”
يتيح لك يوتيوب تحميل صور مصغرة مخصصة لمقاطع الفيديو الخاصة بك، لاختبار خيارات الصور المصغرة المختلفة اتبع الخطوات التالية
انتقل إلى ستوديو يوتيوب وانقر على “المحتوى” في الشريط الجانبي *
حدد الفيديو الذي تريد اختباره *
انقر فوق الصورة المصغرة الحالية لفتح قائمة اختيار الصور المصغرة *
قم بتحميل الصورة المصغرة المخصصة الجديدة وحفظ التغييرات *
مباشرة A/B في حين أن هذه الطريقة لا توفر مقارنة
يمكنك مراقبة أداء كل صورة مصغرة بمرور الوقت
2. (CTR) تحليل معدلات النقر إلى الظهور
المقياس الرئيسي لقياس فعالية الصورة المصغرة
(CTR) معدل النقر إلى الظهور
:يمكنك العثور على هذه البيانات داخل ستوديو يوتيوب
انتقل إلى “التحليلات” وحدد “نظرة عامة”
ضمن “الوصول” سترى معدل النقر إلى الظهور لمقطع الفيديو الخاص بك
راقب معدل النقر إلى الظهور بعد تغيير الصورة المصغرة، يشير معدل النقر إلى الظهور الأعلى إلى أن الصورة المصغرة الجديدة أكثر جاذبية
ضع في اعتبارك أن عوامل أخرى مثل عنوان الفيديو والبيانات الوصفية تؤثر أيضاً على معدل النقر إلى الظهور ومع ذلك فإن التغيير الملحوظ بعد تحديث الصورة المصغرة يمكن أن يكون مؤشراً جيداً لفعاليتها
Advertisements
3. مراقبة تفاعل المشاهدين
: هناك طريقة أخرى لاختبار الصور المصغرة الخاصة بك وهي تحليل سلوك المشاهدين
انتقل إلى علامة التبويب “التفاعل” في تحليلات ستوديو يوتيوب
انظر إلى مقاييس مثل متوسط مدة المشاهدة والاحتفاظ بالجمهور
إذا كانت الصورة المصغرة المحدثة تجتذب المزيد من النقرات ولكن المشاهدين يغادرون بسرعة فقد تجتذب الجمهور الخطأ، تأكد من أن الصورة المصغرة تمثل محتوى الفيديو الخاص بك بدقة للحفاظ على التفاعل
4. استخدم بيانات مصدر الزيارات
إن فهم المكان الذي يأتي منه المشاهدون يمكن أن يوفر لك أيضاً رؤى حول فعالية الصورة المصغرة
في علامة التبويب “الوصول” تحقق من قسم “أنواع مصادر الزيارات”
إذا لاحظت زيادة في الزيارات من “بحث يوتيوب” أو “ميزات التصفح” بعد تغيير الصورة المصغرة، فمن المحتمل أن تكون أكثر جاذبية للمشاهدين الذين يتصفحون أو يبحثون على يوتيوب
5. قارنها بمقاطع فيديو مماثلة
يمكنك مقارنة أداء الصورة المصغرة بأداء مقاطع فيديو مماثلة على قناتك:
في ستوديو يوتيوب، انتقل إلى “التحليلات” ثم “نظرة عامة”
مرر لأسفل لرؤية قسم “أفضل مقاطع الفيديو”
قارن بين مقاييس النقر إلى الظهور والتفاعل لمقطع الفيديو الخاص بك مع مقاطع فيديو أخرى في نفس المجال
يمكن أن تساعدك هذه المقارنة في فهم ما إذا كانت الصورة المصغرة الجديدة تتوافق مع اتجاهات الأداء العامة لمحتواك
:نستخلص مما سبق
A/B على الرغم من أن يوتيوب لا يوفر أدوات اختبار
مدمجة للصور المصغرة إلا أنه لا يزال بإمكانك اختبار الصور المصغرة وتحسينها بشكل فعال مباشرةً داخل ستوديو يوتيوب، فمن خلال تحديث الصور المصغرة بانتظام ومراقبة المقاييس عن كثب مثل معدل النقر إلى الظهور والمشاركة ومصادر الزيارات يمكنك تحسين الانطباع الأول عن الفيديو الخاص بك وتعزيز أدائه دون الحاجة إلى أي أدوات خارجية، قد تتطلب هذه العملية بعض الجهد اليدوي ولكن الرؤى المكتسبة يمكن أن تكون لا تقدر بثمن في تنمية قناتك
Data engineering is a rapidly growing field, and as demand for skilled professionals rises, finding the right job opportunities is crucial. Whether you’re an experienced data engineer or just starting your career, knowing where to search for job openings can make all the difference. Here’s a roundup of the top 10 career websites for data engineers.
1. LinkedIn
LinkedIn is more than just a social network for professionals—it’s a powerful job search tool, particularly for those in tech. The platform offers tailored job recommendations based on your profile, connections, and industry trends. LinkedIn also allows you to connect directly with recruiters and other professionals in your field, making it easier to tap into hidden job markets.
Key Features:
Extensive job listings tailored to your experience.
Networking opportunities with professionals and recruiters.
Company reviews and salary insights.
2. Indeed
Indeed is one of the largest job search engines globally, aggregating job postings from various sources, including company career pages and job boards. Its simple interface allows you to filter jobs by location, salary, experience level, and more, making it easy to find relevant positions in data engineering.
Key Features:
Wide range of job listings from multiple sources.
Advanced search filters for more precise job searches.
Company reviews and ratings to help you evaluate potential employers.
3. Glassdoor
Glassdoor is known for its comprehensive company reviews and salary information, making it a valuable resource for job seekers who want to research potential employers before applying. In addition to job listings, Glassdoor provides insights into company culture, interview processes, and employee satisfaction, helping you make informed decisions.
Key Features:
Job listings with company ratings and reviews.
Detailed salary reports specific to data engineering roles.
Insights into company culture and interview processes.
4. Hired
Hired is a unique platform that allows tech professionals, including data engineers, to be approached by companies rather than applying for jobs themselves. By creating a profile showcasing your skills and experience, you can receive interview requests from employers who are actively seeking candidates with your qualifications.
Key Features:
Employers reach out to you directly with interview requests.
Transparent salary offers before the interview stage.
Curated job matches based on your profile and preferences.
5. AngelList
AngelList is a go-to platform for those interested in working with startups, many of which are in the tech industry. The site allows you to apply directly to startup job postings and provides information on company funding, team size, and culture, making it easier to assess whether a startup is the right fit for you.
Key Features:
Focus on startup job opportunities, including remote roles.
Direct application process with hiring managers.
Insights into company size, funding, and culture.
Advertisements
6. Stack Overflow Jobs
Stack Overflow, known for its Q&A community for developers, also offers a job board specifically tailored to tech professionals. The platform allows you to showcase your developer skills and participate in the community, which can lead to job offers from companies that value your expertise.
Key Features:
Job listings focused on tech roles, including data engineering.
Opportunities to demonstrate your skills through community participation.
Filtered search based on technology stack, location, and more.
7. GitHub Jobs
GitHub Jobs is a job board for developers and tech professionals hosted by GitHub, the popular platform for code hosting and version control. While the job board is smaller than some others, it offers high-quality listings from companies looking for skilled engineers, especially those familiar with GitHub’s ecosystem.
Key Features:
Job listings focused on tech and developer roles.
Direct connection with companies that value open-source contributions.
Opportunity to showcase your GitHub profile and projects.
8. Dice
Dice is a specialized job board for tech professionals, offering a wide range of listings in data engineering, software development, and IT. The platform also provides career advice, salary insights, and tech news to keep you informed about industry trends and job market conditions.
Key Features:
Tech-focused job listings, including many data engineering roles.
Industry news and career resources to stay updated on trends.
Salary information and job market insights.
9. SimplyHired
SimplyHired aggregates job listings from various sources, similar to Indeed, but with a simpler interface and a focus on filtering jobs to match your exact criteria. It’s a great resource for finding data engineering jobs across different locations and experience levels.
Key Features:
Aggregated job listings from multiple sources.
Easy-to-use interface with advanced search filters.
Salary estimates and job trend data.
10. Kaggle Jobs
Kaggle, known for its data science competitions, also offers a job board where companies post openings for data engineering and data science roles. If you’ve participated in Kaggle competitions, your profile can serve as a portfolio, showcasing your skills to potential employers.
Key Features:
Job listings focused on data roles, including engineering.
Ability to showcase your competition results as part of your profile.
Opportunities to connect with companies that value data-driven skills.
Conclusion
Finding the right job as a data engineer requires not just technical skills, but also knowing where to look. These top career websites offer a range of opportunities, from startups to established tech giants, and provide the tools you need to connect with the right employers. Whether you’re looking to make your next career move or just exploring the market, these platforms can help you land the job that aligns with your skills and aspirations.
Advertisements
أفضل 10 مواقع ويب لتوظيف مهندسي البيانات
Advertisements
تعد هندسة البيانات مجالاً سريع النمو ومع ارتفاع الطلب على المهنيين المهرة فإن العثور على فرص العمل المناسبة أمر بالغ الأهمية، سواء كنت مهندس بيانات متمرساً أو بدأت للتو حياتك المهنية فإن معرفة مكان البحث عن فرص العمل يمكن أن يحدث فرقاً كبيراً
إليك ملخص لأفضل 10 مواقع ويب لتوظيف مهندسي البيانات
1. LinkedIn
وهو أكثر من مجرد شبكة اجتماعية للمحترفين إنه أداة بحث قوية عن الوظائف وخاصة لأولئك في مجال التكنولوجيا، تقدم المنصة توصيات وظيفية مخصصة بناءً على ملفك الشخصي واتصالاتك واتجاهات الصناعة، تتيح لك هذه المنصة أيضاً الاتصال مباشرة بموظفي التوظيف وغيرهم من المهنيين في مجالك مما يسهل الاستفادة من أسواق العمل المخفية
:الميزات الرئيسية
قوائم وظائف واسعة النطاق مصممة لتلائم خبرتك *
فرص التواصل مع المهنيين وموظفي التوظيف *
مراجعات الشركات ورؤى الرواتب *
2. Indeed
وهو أحد أكبر محركات البحث عن الوظائف على مستوى العالم حيث يجمع الوظائف المعلن عنها من مصادر مختلفة بما في ذلك صفحات وظائف الشركات ولوحات الوظائف، تتيح لك واجهته البسيطة تصفية الوظائف حسب الموقع والراتب ومستوى الخبرة والمزيد مما يسهل العثور على الوظائف ذات الصلة في هندسة البيانات
: الميزات الرئيسية
مجموعة واسعة من قوائم الوظائف من مصادر متعددة *
فلاتر بحث متقدمة لعمليات بحث أكثر دقة عن الوظائف *
مراجعات وتقييمات الشركات لمساعدتك في تقييم أصحاب العمل المحتملين *
3. Glassdoor
يشتهر بمراجعاته الشاملة للشركات ومعلومات الرواتب مما يجعله مورداً قيماً لطالبي الوظائف الذين يرغبون في البحث عن أصحاب العمل المحتملين قبل التقديم، بالإضافة إلى قوائم الوظائف كما ويوفر رؤى حول ثقافة الشركة وعمليات المقابلة ورضا الموظفين مما يساعدك على اتخاذ قرارات مستنيرة
:الميزات الرئيسية
قوائم الوظائف مع تقييمات ومراجعات الشركة *
تقارير رواتب مفصلة خاصة بأدوار هندسة البيانات *
رؤى حول ثقافة الشركة وعمليات المقابلة *
4. Hired
وهو عبارة عن منصة فريدة تسمح لمحترفي التكنولوجيا بما في ذلك مهندسي البيانات بالتواصل مع الشركات بدلاً من التقدم للوظائف بأنفسهم من خلال إنشاء ملف تعريفي يعرض مهاراتك وخبراتك يمكنك تلقي طلبات إجراء مقابلات من أصحاب العمل الذين يبحثون بنشاط عن مرشحين يتمتعون بمؤهلاتك
:الميزات الرئيسية
يتواصل أصحاب العمل معك مباشرة من خلال طلبات إجراء المقابلات *
عروض رواتب شفافة قبل مرحلة المقابلة *
وظائف مطابقة منسقة بناءً على ملفك الشخصي وتفضيلاتك *
5. AngelList
هي منصة مفضلة لأولئك المهتمين بالعمل مع الشركات الناشئة والعديد منها في صناعة التكنولوجيا، يسمح لك الموقع بالتقدم مباشرة إلى الوظائف الشاغرة في الشركات الناشئة ويوفر معلومات حول تمويل الشركة وحجم الفريق والثقافة مما يسهل تقييم ما إذا كانت الشركة الناشئة مناسبة لك
:الميزات الرئيسية
التركيز على فرص العمل في الشركات الناشئة بما في ذلك الأدوار عن بُعد *
عملية تقديم طلبات مباشرة مع مديري التوظيف *
نظرة ثاقبة على حجم الشركة وتمويلها وثقافتها *
Advertisements
6. Stack Overflow وظائف
المعروف بمجتمع الأسئلة والأجوبة للمطورين وهو يقدم أيضاً لوحة وظائف مصممة خصيصاً لمحترفي التكنولوجيا، تتيح لك هذه المنصة عرض مهاراتك كمطور والمشاركة في المجتمع مما قد يؤدي إلى عروض عمل من الشركات التي تقدر خبرتك
:الميزات الرئيسية
قوائم الوظائف تركز على الأدوار التقنية بما في ذلك هندسة البيانات *
فرص لإظهار مهاراتك من خلال المشاركة المجتمعية *
بحث مفلتر بناءً على مجموعة التكنولوجيا والموقع والمزيد *
7. GitHub Jobs
عبارة عن لوحة وظائف للمطورين والمحترفين التقنيين GitHub Jobs
GitHub تستضيفها
المنصة الشهيرة لاستضافة التعليمات البرمجية والتحكم في الإصدارات، في حين أن لوحة الوظائف أصغر من بعض اللوحات الأخرى إلا أنها تقدم قوائم عالية الجودة من الشركات التي تبحث عن مهندسين مهرة
GitHub وخاصة أولئك الذين يعرفون نظام
:الميزات الرئيسية
قوائم الوظائف تركز على الأدوار التقنية والمطورين *
اتصال مباشر بالشركات التي تقدر مساهمات المصدر المفتوح *
GithHub فرصة لعرض ملفك الشخصي ومشاريعك على *
8. Dice
وهي عبارة عن لوحة وظائف متخصصة للمحترفين التقنيين تقدم مجموعة واسعة من القوائم في هندسة البيانات وتطوير البرمجيات وتكنولوجيا المعلومات، توفر المنصة أيضاً نصائح مهنية ورؤى حول الرواتب وأخباراً تقنية لإبقائك على اطلاع دائم باتجاهات الصناعة وظروف سوق العمل
:الميزات الرئيسية
قوائم الوظائف التي تركز على التكنولوجيا بما في ذلك العديد من أدوار هندسة البيانات *
أخبار الصناعة وموارد الوظائف للبقاء على اطلاع دائم بالاتجاهات *
معلومات الرواتب ورؤى سوق العمل *
9. SimplyHired
تجمع هذه المنصة قوائم الوظائف من مصادر مختلفة ولكن بواجهة أبسط والتركيز على تصفية الوظائف لتتوافق مع معاييرك الدقيقة، إنه مورد رائع للعثور على وظائف هندسة البيانات عبر مواقع ومستويات خبرة مختلفة
:الميزات الرئيسية
قوائم وظائف مجمعة من مصادر متعددة *
واجهة سهلة الاستخدام مع مرشحات بحث متقدمة *
تقديرات الرواتب وبيانات اتجاهات الوظائف *
10. Kaggle وظائف
المعروف بمسابقات علوم البيانات وهو يقدم أيضاً لوحة وظائف حيث تنشر الشركات فرص العمل في أدوار هندسة البيانات وعلوم البيانات، إذا شاركت في مسابقات هذه المنصة يمكن أن يعمل ملفك الشخصي كمحفظة لعرض مهاراتك لأصحاب العمل المحتملين
:الميزات الرئيسية
قوائم الوظائف التي تركز على أدوار البيانات بما في ذلك الهندسة *
القدرة على عرض نتائج المنافسة كجزء من ملفك الشخصي *
فرص للتواصل مع الشركات التي تقدر المهارات القائمة على البيانات *
الخلاصة
إن العثور على الوظيفة المناسبة كمهندس بيانات لا يتطلب فقط المهارات الفنية بل يتطلب أيضاً معرفة المكان الذي تبحث فيه، تقدم مواقع الويب المهنية الرائدة هذه مجموعة من الفرص، من الشركات الناشئة إلى شركات التكنولوجيا العملاقة الراسخة وتوفر الأدوات التي تحتاجها للتواصل مع أصحاب العمل المناسبين، سواء كنت تتطلع إلى اتخاذ الخطوة التالية في حياتك المهنية أو مجرد استكشاف السوق يمكن أن تساعدك هذه المنصات في الحصول على الوظيفة التي تتوافق مع مهاراتك وتطلعاتك
The data industry is booming, and with it comes a multitude of career paths and opportunities. Whether you’re a data scientist, analyst, or engineer, deciding where to go next in your data career can be both exciting and daunting. Here’s a guide to help you navigate the various options and figure out the best direction for your professional growth.
1. Deepening Your Technical Expertise
One natural step in your data career is to deepen your technical expertise. If you’re already proficient in tools like Python, R, SQL, or data visualization platforms like Tableau and Power BI, consider honing more advanced skills. Specializations such as machine learning, deep learning, or big data technologies (e.g., Hadoop, Spark) are highly sought after and can set you apart from the competition.
Action Steps:
Enroll in advanced courses or certifications in your area of interest.
Participate in hackathons or data science competitions like Kaggle.
Work on personal or open-source projects to apply new skills in a practical context.
2. Transitioning to Data Engineering
If you enjoy the technical side of data but want to focus on the infrastructure and architecture, transitioning to data engineering could be a rewarding move. Data engineers are responsible for building and maintaining the systems that store, process, and analyze data, ensuring that data pipelines are robust and scalable.
Action Steps:
Gain proficiency in programming languages like Python, Java, or Scala.
Learn about database systems, ETL (Extract, Transform, Load) processes, and cloud platforms such as AWS, Azure, or Google Cloud.
Consider certifications like AWS Certified Data Analytics or Google Cloud Professional Data Engineer.
3. Moving Into Data Science Leadership
For those with a few years of experience under their belt, moving into leadership roles can be a significant next step. Data science managers, directors, or even Chief Data Officers (CDOs) are increasingly in demand as companies recognize the importance of data-driven decision-making.
Action Steps:
Develop strong communication and project management skills to effectively lead teams.
Understand the business side of data to align your team’s efforts with company goals.
Seek mentorship from current leaders in the field and network within the industry.
Advertisements
4. Specializing in a Niche Field
The data industry offers numerous niche areas where you can specialize, such as healthcare analytics, financial data analysis, or sports analytics. Focusing on a niche can make you an expert in that domain, opening up opportunities in specific industries.
Action Steps:
Identify a niche that aligns with your interests and the industry demand.
Take specialized courses or certifications tailored to that field.
Network with professionals in that niche to learn about emerging trends and opportunities.
5. Exploring AI and Machine Learning
Artificial Intelligence (AI) and Machine Learning (ML) are among the fastest-growing areas in data science. If you’re intrigued by creating algorithms that can learn and make decisions, this could be the next frontier in your career.
Action Steps:
Learn foundational AI/ML concepts through online courses or advanced degrees.
Work on projects that involve natural language processing, computer vision, or predictive analytics.
Stay updated with the latest research and advancements in AI and ML by attending conferences or reading academic journals.
6. Becoming a Data Consultant
If you prefer a more dynamic and varied role, becoming a data consultant might be the path for you. Consultants work with different clients to solve specific data challenges, often bringing in fresh perspectives and innovative solutions.
Action Steps:
Build a strong portfolio showcasing your ability to deliver results.
Develop excellent communication and problem-solving skills to adapt to different industries and client needs.
Consider working for a consulting firm to gain experience before branching out on your own.
7. Entering Academia or Research
For those passionate about advancing the field of data science, entering academia or research can be a fulfilling option. This path allows you to contribute to the body of knowledge in data science while mentoring the next generation of professionals.
Action Steps:
Pursue advanced degrees (e.g., Ph.D.) in data science or related fields.
Focus on publishing research papers and presenting at conferences.
Engage in collaborations with academic institutions or research labs.
Conclusion
The direction you take in your data career depends on your interests, strengths, and the kind of impact you want to make. Whether you choose to deepen your technical skills, move into leadership, specialize in a niche, or explore new areas like AI and consulting, the key is continuous learning and adaptation. The data industry is constantly evolving, and by staying curious and proactive, you can carve out a rewarding and successful career path.
Advertisements
ما هي خطوتك التالية خلال مسيرتك المهنية في البيانات؟
Advertisements
تشهد صناعة البيانات ازدهاراً كبيراً ومعها العديد من مسارات العمل والفرص، فسواء كنت عالم بيانات أو محللاً أو مهندساً فإن تحديد المكان الذي ستذهب إليه بعد ذلك في حياتك المهنية في مجال البيانات قد يكون مثيراً ومخيفاً في نفس الوقت
إليك دليل لمساعدتك في التنقل بين الخيارات المختلفة ومعرفة أفضل اتجاه لنموك المهني
1. تعميق خبرتك الفنية
تتمثل إحدى الخطوات الطبيعية في حياتك المهنية في مجال البيانات في تعميق خبرتك الفنية
Python أو R أو SQL فإذا كنت بالفعل بارعاً في أدوات مثل
Tableau وPower BI أو منصات تصور البيانات مثل
ففكر في صقل مهارات أكثر تقدماً، التخصصات مثل التعلم الآلي أو التعلم العميق أو تقنيات البيانات الضخمة
Hadoop و Spark :على سبيل المثال
مطلوبة بشدة ويمكن أن تميزك عن المنافسة
:خطوات العمل
التسجيل في دورات أو شهادات متقدمة في مجال اهتمامك *
Kaggle المشاركة في مسابقات علوم البيانات مثل *
العمل على مشاريع شخصية أو مفتوحة المصدر لتطبيق مهارات جديدة في سياق عملي *
2. الانتقال إلى هندسة البيانات
إذا كنت تستمتع بالجانب الفني للبيانات ولكنك تريد التركيز على البنية الأساسية والهندسة المعمارية فقد يكون الانتقال إلى هندسة البيانات خطوة مجزية، مهندسو البيانات مسؤولون عن بناء وصيانة الأنظمة التي تخزن البيانات وتعالجها وتحللها مما يضمن أن تكون خطوط أنابيب البيانات قوية وقابلة للتطوير
: خطوات العمل
Python أو Java أو Scala اكتسب الكفاءة في لغات البرمجة مثل *
ETL تعرف على أنظمة قواعد البيانات وعمليات *
(استخراج وتحويل وتحميل) ومنصات السحابة مثل *
AWS أو Azure أو Google Cloud
فكر في الشهادات مثل
AWS Certified Data Analytics أو Google Cloud Professional Data Engineer
3. الانتقال إلى قيادة علوم البيانات
بالنسبة لأولئك الذين لديهم بضع سنوات من الخبرة يمكن أن يكون الانتقال إلى أدوار قيادية خطوة تالية مهمة، يزداد الطلب على مديري علوم البيانات أو المديرين
(CDOs) أو حتى رؤساء مسؤولي البيانات
حيث تدرك الشركات أهمية اتخاذ القرارات القائمة على البيانات
:خطوات العمل
قم بتطوير مهارات قوية في التواصل وإدارة المشاريع لقيادة الفرق بفعالية *
قم بفهم الجانب التجاري للبيانات لمواءمة جهود فريقك مع أهداف الشركة *
اطلب التوجيه من القادة الحاليين في هذا المجال وتواصل مع الآخرين في الصناعة *
Advertisements
4. التخصص في مجال محدد
تقدم صناعة البيانات العديد من المجالات المحددة التي يمكنك التخصص فيها مثل تحليلات الرعاية الصحية أو تحليل البيانات المالية أو تحليلات الرياضة، إن التركيز على مجال محدد يمكن أن يجعلك خبيراً في هذا المجال مما يفتح لك فرصاً في صناعات محددة
:خطوات العمل
حدد مجالاً محدداً يتماشى مع اهتماماتك ومتطلبات الصناعة *
احصل على دورات أو شهادات متخصصة مصممة خصيصاً لهذا المجال *
تواصل مع المحترفين في هذا المجال للتعرف على الاتجاهات والفرص الناشئة *
5. استكشاف الذكاء الاصطناعي والتعلم الآلي
يعد الذكاء الاصطناعي والتعلم الآلي من أسرع المجالات نمواً في علم البيانات، إذا كنت مهتماً بإنشاء خوارزميات يمكنها التعلم واتخاذ القرارات فقد تكون هذه هي الخطوة التالية في حياتك المهنية
:خطوات العمل
تعلم المفاهيم الأساسية للذكاء الاصطناعي/التعلم الآلي من خلال الدورات التدريبية عبر الإنترنت أو الدرجات العلمية المتقدمة
العمل على المشاريع التي تنطوي على معالجة اللغة الطبيعية أو الرؤية الحاسوبية أو التحليلات التنبؤية
ابق على اطلاع بأحدث الأبحاث والتطورات في الذكاء الاصطناعي والتعلم الآلي من خلال حضور المؤتمرات أو قراءة المجلات الأكاديمية
6. أن تصبح مستشار بيانات
إذا كنت تفضل دوراً أكثر ديناميكية وتنوعاً فقد يكون أن تصبح مستشار بيانات هو المسار المناسب لك، يعمل المستشارون مع عملاء مختلفين لحل تحديات بيانات محددة وغالباً ما يجلبون وجهات نظر جديدة وحلولاً مبتكرة
:خطوات العمل
قم ببناء محفظة قوية تعرض قدرتك على تحقيق النتائج *
قم بتطوير مهارات الاتصال وحل المشكلات الممتازة للتكيف مع الصناعات المختلفة واحتياجات العملاء *
فكر في العمل لدى شركة استشارية لاكتساب الخبرة قبل التوسع بمفردك *
7. دخول المجال الأكاديمي أو البحثي
بالنسبة لأولئك المتحمسين لتطوير مجال علم البيانات فإن دخول المجال الأكاديمي أو البحثي يمكن أن يكون خياراً مُرضياً، يتيح لك هذا المسار المساهمة في مجموعة المعرفة في علم البيانات أثناء توجيه الجيل القادم من المحترفين
:خطوات العمل
احصل على درجات متقدمة (على سبيل المثال الدكتوراه) في علم البيانات أو المجالات ذات الصلة *
ركز على نشر أوراق البحث والتقديم في المؤتمرات *
اشترك في التعاون مع المؤسسات الأكاديمية أو مختبرات الأبحاث *
الخلاصة
يعتمد الاتجاه الذي تتخذه في حياتك المهنية في مجال البيانات على اهتماماتك ونقاط قوتك ونوع التأثير الذي تريد إحداثه، سواء اخترت تعميق مهاراتك الفنية أو الانتقال إلى القيادة أو التخصص في مجال محدد أو استكشاف مجالات جديدة مثل الذكاء الاصطناعي والاستشارات فإن المفتاح هو التعلم المستمر والتكيف، تتطور صناعة البيانات باستمرار ومن خلال البقاء فضولياً واستباقياً، يمكنك شق طريق مهني مجزٍ وناجح
Data science continues to evolve rapidly, driven by advancements in technology, increasing volumes of data, and the growing demand for data-driven decision-making across various sectors. The year 2024 brings several notable developments in the field of data science, influencing how data is collected, processed, analyzed, and utilized. This article explores the key advancements and trends shaping data science in 2024.
1. Enhanced Machine Learning and AI
A. AutoML and Democratization of AI
AutoML Advancements: Automated Machine Learning (AutoML) tools have become more sophisticated, enabling non-experts to build complex machine learning models. These tools handle data preprocessing, feature selection, model selection, and hyperparameter tuning with minimal human intervention.
Democratization of AI: With the rise of user-friendly AI platforms, more organizations can leverage AI without needing extensive technical expertise. This democratization is making AI accessible to small and medium-sized enterprises (SMEs) and even individual users.
B. Explainable AI (XAI)
Transparency in AI Models: Explainable AI has gained traction, addressing the black-box nature of many AI models. XAI techniques provide insights into how models make decisions, enhancing trust and enabling regulatory compliance.
Application in Critical Sectors: In healthcare, finance, and legal sectors, where transparency and accountability are paramount, XAI is crucial for adopting AI technologies.
2. Advanced Data Integration and Management
A. Data Fabric and Data Mesh
Data Fabric: This architecture integrates data across various environments, including on-premises, cloud, and hybrid systems. It enables seamless data access, management, and governance, breaking down data silos.
Data Mesh: A decentralized data architecture that promotes data ownership within business domains. It enhances scalability and agility by treating data as a product and emphasizing self-service data infrastructure.
B. Real-Time Data Processing
Stream Processing: Technologies like Apache Kafka, Apache Flink, and Amazon Kinesis have improved, facilitating real-time data ingestion, processing, and analysis. Real-time analytics are increasingly crucial for applications in finance, e-commerce, and IoT.
Edge Computing: With the proliferation of IoT devices, edge computing has become more prevalent. It allows data processing closer to the data source, reducing latency and bandwidth usage.
Advertisements
3. Enhanced Data Privacy and Security
A. Privacy-Enhancing Technologies (PETs)
Federated Learning: This technique enables model training across multiple decentralized devices or servers while keeping data localized. It enhances privacy by avoiding central data aggregation.
Differential Privacy: Differential privacy techniques are being integrated into data analysis workflows to ensure that individual data points cannot be re-identified from aggregate data sets.
B. Data Governance and Compliance
Regulatory Frameworks: Stricter data privacy regulations worldwide, such as GDPR, CCPA, and new regional laws, require organizations to implement robust data governance frameworks.
AI Ethics and Responsible AI: Organizations are increasingly focusing on ethical AI practices, ensuring that AI systems are fair, transparent, and accountable.
4. Improved Data Visualization and Interpretation
A. Augmented Analytics
AI-Driven Insights: Augmented analytics uses AI and machine learning to enhance data analytics processes. It automates data preparation, insight generation, and explanation, enabling users to uncover hidden patterns and trends quickly.
Natural Language Processing (NLP): NLP capabilities in analytics platforms allow users to query data and generate reports using natural language, making data analysis more accessible.
B. Immersive Data Visualization
Virtual Reality (VR) and Augmented Reality (AR): VR and AR are being used to create immersive data visualizations, providing new ways to interact with and understand complex data sets.
Interactive Dashboards: Enhanced interactive features in dashboards allow users to explore data dynamically, improving the analytical experience and decision-making process.
5. Domain-Specific Data Science Applications
A. Healthcare
Precision Medicine: Advances in data science are driving precision medicine, where treatments are tailored to individual patients based on their genetic, environmental, and lifestyle data.
Predictive Analytics: Predictive models are used for early disease detection, patient risk stratification, and optimizing treatment plans.
B. Finance
Fraud Detection: Machine learning models for fraud detection are becoming more sophisticated, utilizing vast amounts of transactional data to identify and prevent fraudulent activities.
Algorithmic Trading: Data science continues to revolutionize algorithmic trading, with models that analyze market trends and execute trades at high speeds.
C. Environmental Science
Climate Modeling: Advanced data science techniques are improving climate models, helping predict weather patterns and understand the impacts of climate change.
Sustainability Initiatives: Data analytics is playing a crucial role in sustainability initiatives, from optimizing resource usage to monitoring environmental health.
Conclusion
The developments in data science in 2024 are transforming how data is leveraged across various industries. Enhanced machine learning and AI capabilities, advanced data integration and management techniques, improved data privacy and security measures, and innovative data visualization tools are driving this transformation. As these trends continue to evolve, the role of data science in solving complex problems and driving business innovation will only become more significant. Organizations and professionals in the field must stay abreast of these advancements to harness the full potential of data science in the coming years.
Advertisements
ما هو التطور الذي حصل على علم البيانات في العام ٢٠٢٤؟
Advertisements
يستمر علم البيانات في التطور بسرعة مدفوعاً بالتقدم في التكنولوجيا وزيادة أحجام البيانات والطلب المتزايد على اتخاذ القرارات القائمة على البيانات عبر مختلف القطاعات، إذ يجلب عام 2024 العديد من التطورات البارزة في مجال علم البيانات مما يؤثر على كيفية جمع البيانات ومعالجتها وتحليلها واستخدامها
تستكشف هذه المقالة التطورات والاتجاهات الرئيسية التي تشكل علم البيانات في عام 2024
1. التعلم الآلي المحسن والذكاء الاصطناعي
أ. التعلم الآلي وتقنيات الذكاء الاصطناعي
تطورات التعلم الآلي: أصبحت أدوات التعلم الآلي أكثر تطوراً، مما يمكِّن غير الخبراء من بناء نماذج التعلم الآلي المعقدة تتعامل هذه الأدوات مع معالجة البيانات مسبقاً واختيار الميزات واختيار النموذج وضبط المعلمات الفائقة مع الحد الأدنى من التدخل البشري
تقنيات الذكاء الاصطناعي: مع ظهور منصات الذكاء الاصطناعي سهلة الاستخدام يمكن لمزيد من المنظمات الاستفادة من الذكاء الاصطناعي دون الحاجة إلى خبرة تقنية واسعة النطاق، بحيث تجعل هذه الميزات الذكاء الاصطناعي في متناول الشركات الصغيرة والمتوسطة الحجم وحتى المستخدمين الأفراد
ب. الذكاء الاصطناعي القابل للتفسير
الشفافية في نماذج الذكاء الاصطناعي: اكتسب الذكاء الاصطناعي القابل للتفسير رواجاً كبيراً، حيث عالج الطبيعة الغامضة للعديد من نماذج الذكاء الاصطناعي، توفر تقنيات الذكاء الاصطناعي القابل للتفسير رؤى حول كيفية اتخاذ النماذج للقرارات وتعزيز الثقة وتمكين الامتثال التنظيمي
التطبيق في القطاعات الحرجة: في قطاعات الرعاية الصحية والمالية والقانونية بحيث تكون الشفافية والمساءلة في غاية الأهمية، يعد الذكاء الاصطناعي القابل للتفسير أمراً بالغ الأهمية لتبني تقنيات الذكاء الاصطناعي
2. تكامل وإدارة البيانات المتقدمة
أ. نسيج البيانات وشبكة البيانات
نسيج البيانات: يدمج هذا الهيكل البيانات عبر بيئات مختلفة بما في ذلك الأنظمة المحلية والسحابية والهجينة، إنه يتيح الوصول السلس إلى البيانات وإدارتها وحوكمتها
شبكة البيانات: هيكل بيانات لامركزي يعزز ملكية البيانات داخل مجالات الأعمال، إنه يعزز قابلية التوسع والمرونة من خلال التعامل مع البيانات كمنتج والتأكيد على البنية الأساسية للبيانات ذاتية الخدمة
ب. معالجة البيانات في الوقت الفعلي
معالجة التدفق: تحسنت التقنيات مثل
Apache Kafka و Apache Flink و Amazon Kinesis
مما سهل استيعاب البيانات ومعالجتها وتحليلها في الوقت الفعلي، أصبحت التحليلات في الوقت الفعلي ذات أهمية متزايدة للتطبيقات في التمويل والتجارة الإلكترونية وإنترنت الأشياء
الحوسبة الحافة: مع انتشار أجهزة الإنترنت أصبحت الحوسبة الحافة أكثر انتشاراً فهي تسمح بمعالجة البيانات بالقرب من مصدر البيانات مما يقلل من زمن الوصول واستخدام النطاق الترددي
3. تعزيز خصوصية البيانات والأمان
(PETs) أ. تقنيات تعزيز الخصوصية
التعلم الفيدرالي: تمكن هذه التقنية من تدريب النموذج عبر أجهزة أو خوادم متعددة لامركزية مع الحفاظ على توطين البيانات وهي تعزز الخصوصية من خلال تجنب تجميع البيانات المركزية
الخصوصية التفاضلية: يتم دمج تقنيات الخصوصية التفاضلية في سير عمل تحليل البيانات لضمان عدم إمكانية إعادة تحديد نقاط البيانات الفردية من مجموعات البيانات المجمعة
ب. حوكمة البيانات والامتثال
الأطر التنظيمية: تتطلب لوائح خصوصية البيانات الأكثر صرامة في جميع أنحاء العالم مثل اللائحة العامة لحماية البيانات وقانون خصوصية المستهلك في كاليفورنيا والقوانين الإقليمية الجديدة من المنظمات تنفيذ أطر حوكمة بيانات قوية
أخلاقيات الذكاء الاصطناعي والذكاء الاصطناعي المسؤول: تركز المنظمات بشكل متزايد على ممارسات الذكاء الاصطناعي الأخلاقية مما يضمن أن تكون أنظمة الذكاء الاصطناعي عادلة وشفافة وخاضعة للمساءلة
Advertisements
4. تحسين تصور البيانات وتفسيرها
أ. التحليلات المعززة
الرؤى التي يقودها الذكاء الاصطناعي: تستخدم التحليلات المعززة الذكاء الاصطناعي والتعلم الآلي لتحسين عمليات تحليل البيانات فهي تعمل على أتمتة إعداد البيانات وتوليد الرؤى وتفسيرها مما يتيح للمستخدمين اكتشاف الأنماط والاتجاهات المخفية بسرعة
:(NLP) معالجة اللغة الطبيعية
تتيح قدرات معالجة اللغة الطبيعية في منصات التحليلات للمستخدمين الاستعلام عن البيانات وإنشاء التقارير باستخدام اللغة الطبيعية مما يجعل تحليل البيانات أكثر سهولة في الوصول
ب. التصور الدقيق للبيانات
الواقع الافتراضي والواقع المعزز: يتم استخدام الواقع الافتراضي والواقع المعزز لإنشاء تصورات دقيقة للبيانات، مما يوفر طرقاً جديدة للتفاعل مع مجموعات البيانات المعقدة وفهمها
لوحات المعلومات التفاعلية: تتيح الميزات التفاعلية المحسنة في لوحات المعلومات للمستخدمين استكشاف البيانات بشكل ديناميكي مما يحسن التجربة التحليلية وعملية اتخاذ القرار
5. تطبيقات علوم البيانات الخاصة بالمجال
أ. الرعاية الصحية
الطب الدقيق: تعمل التطورات في علوم البيانات على دفع الطب الدقيق حيث يتم تصميم العلاجات للمرضى الأفراد بناءً على بياناتهم الوراثية والبيئية ونمط حياتهم
التحليلات التنبؤية: تُستخدم النماذج التنبؤية للكشف المبكر عن الأمراض وتصنيف مخاطر المرضى وتحسين خطط العلاج
ب. التمويل
اكتشاف الاحتيال: أصبحت نماذج التعلم الآلي للكشف عن الاحتيال أكثر تطوراً، حيث تستخدم كميات هائلة من البيانات المعاملاتية لتحديد الأنشطة الاحتيالية ومنعها
التداول الخوارزمي: يواصل علم البيانات إحداث ثورة في التداول الخوارزمي من خلال نماذج تحلل اتجاهات السوق وتنفذ الصفقات بسرعات عالية
ج. علم البيئة
• نمذجة المناخ: تعمل تقنيات علوم البيانات المتقدمة على تحسين نماذج المناخ مما يساعد في التنبؤ بأنماط الطقس وفهم تأثيرات تغير المناخ
• مبادرات الاستدامة: تلعب تحليلات البيانات دوراً حاسماً في مبادرات الاستدامة من تحسين استخدام الموارد إلى مراقبة الصحة البيئية
:الاستنتاج
إن التطورات في علوم البيانات في عام 2024 تعمل على تحويل كيفية الاستفادة من البيانات عبر مختلف الصناعات، إن قدرات التعلم الآلي والذكاء الاصطناعي المحسنة وتقنيات تكامل وإدارة البيانات المتقدمة وتدابير خصوصية البيانات والأمان المحسنة وأدوات تصور البيانات المبتكرة هي التي تقود هذا التحول، ومع استمرار تطور هذه الاتجاهات فإن دور علوم البيانات في حل المشكلات المعقدة ودفع الابتكار التجاري سيصبح أكثر أهمية، يجب على المنظمات والمهنيين في هذا المجال مواكبة هذه التطورات لتسخير الإمكانات الكاملة لعلوم البيانات في السنوات القادمة
Power BI is a powerful business analytics tool by Microsoft that enables users to visualize and share insights from their data. One of the core components of effectively using Power BI is data modeling. Data modeling in Power BI involves organizing and structuring data to create a coherent, efficient, and insightful data model that facilitates accurate reporting and analysis. This guide will explore the fundamentals of data modeling in Power BI, including key concepts, best practices, and illustrative examples.
Introduction to Data Modeling
Data modeling is the process of creating a data model for the data to be stored in a database. This model is a conceptual representation of data objects, the associations between different data objects, and the rules. In Power BI, data modeling helps in organizing and relating data from different sources in a way that makes it easy to create reports and dashboards.
Key Concepts in Power BI Data Modeling
1. Tables and Relationships
Tables: Tables are the fundamental building blocks in Power BI. Each table represents a collection of related data.
Relationships: Relationships define how tables are connected to each other. They can be one-to-one, one-to-many, or many-to-many.
2. Primary Keys and Foreign Keys
Primary Key: A unique identifier for each record in a table.
Foreign Key: A field in one table that uniquely identifies a row of another table.
3. Star Schema and Snowflake Schema
Star Schema: A central fact table surrounded by dimension tables. It is straightforward and easy to understand.
Snowflake Schema: A more complex schema where dimension tables are normalized into multiple related tables.
4. DAX (Data Analysis Expressions)
A formula language used to create calculated columns, measures, and custom tables in Power BI.
Advertisements
Steps to Create a Data Model in Power BI
1. Import Data
Use Power BI’s data connectors to import data from various sources such as Excel, SQL Server, Azure, and online services.
2. Clean and Transform Data
Use Power Query Editor to clean and transform data. This includes removing duplicates, filtering rows, renaming columns, and more.
3. Create Relationships
Define relationships between tables using primary and foreign keys to connect related data.
4. Create Calculated Columns and Measures
Use DAX to create calculated columns and measures for advanced data calculations and aggregations.
5. Define Hierarchies
Create hierarchies in dimension tables to facilitate drill-down analysis in reports.
6. Optimize the Data Model
Optimize data model performance by minimizing the number of columns, reducing data granularity, and using summarized data where possible.
Best Practices for Data Modeling in Power BI
1. Use a Star Schema
Prefer a star schema over a snowflake schema for simplicity and performance.
2. Keep the Data Model Simple
Avoid unnecessary complexity. Use clear and descriptive names for tables and columns.
3. Normalize Data
Normalize data to reduce redundancy and improve data integrity.
4. Create Measures Instead of Calculated Columns
Use measures for aggregations as they are calculated on the fly and do not increase the data model size.
5. Optimize Relationships
Use single-directional relationships when possible to improve performance.
Conclusion
Data modeling is a critical aspect of creating efficient and insightful Power BI reports and dashboards. By understanding and applying the key concepts and best practices discussed in this guide, you can create robust data models that support accurate analysis and reporting. Remember to keep your data model simple, use a star schema, and optimize for performance. Happy data modeling!
This article provides a comprehensive overview of data modeling in Power BI, with practical steps, best practices, and illustrative examples to guide you through the process.
Advertisements
دليل شامل – Power BI نمذجة البيانات في
Advertisements
هي أداة تحليل أعمال قوية من مايكروسوفت Power BI
تمكن المستخدمين من تصور ومشاركة الأفكار من بياناتهم
بشكل فعال هو نمذجة البيانات Power BI أحد المكونات الأساسية لاستخدام
Power BI تتضمن نمذجة البيانات في
تنظيم البيانات وهيكلتها لإنشاء نموذج بيانات متماسك وفعال وعميق يسهل إعداد التقارير والتحليل الدقيق
Power BI سيستكشف هذا الدليل أساسيات نمذجة البيانات في
بما في ذلك المفاهيم الرئيسية وأفضل الممارسات والأمثلة التوضيحية
مقدمة إلى نمذجة البيانات
نمذجة البيانات هي عملية إنشاء نموذج بيانات لتخزين البيانات في قاعدة بيانات، هذا النموذج هو تمثيل مفاهيمي لكائنات البيانات والارتباطات بين كائنات البيانات المختلفة والقواعد
تساعد نمذجة البيانات في تنظيم البيانات Power BI في
وربطها من مصادر مختلفة بطريقة تسهل إنشاء التقارير ولوحات المعلومات
Power BIالمفاهيم الأساسية في نمذجة البيانات في
1. الجداول والعلاقات
Power BI الجداول: الجداول هي اللبنات الأساسية في
إذ يمثل كل جدول مجموعة من البيانات ذات الصلة
العلاقات: تحدد العلاقات كيفية اتصال الجداول ببعضها البعض، يمكن أن تكون من واحد إلى واحد أو من واحد إلى كثير أو من كثير إلى كثير
2. المفاتيح الأساسية والمفاتيح الخارجية
المفتاح الأساسي: معرف فريد لكل سجل في جدول
المفتاح الخارجي: حقل في جدول واحد يحدد بشكل فريد صفًا في جدول آخر
مخطط حبة الثلج: مخطط أكثر تعقيدًا حيث يتم توحيد جداول الأبعاد في جداول متعددة ذات صلة
4. DAX (تعبيرات تحليل البيانات)
لغة صيغة تستخدم لإنشاء أعمدة محسوبة
Power BI ومقاييس وجداول مخصصة في
Advertisements
: Power BI خطوات إنشاء نموذج بيانات في
1. استيراد البيانات
لاستيراد البيانات Power BI استخدم موصلات البيانات في
والخدمات عبر الإنترنت Excel و SQL Server و Azure من مصادر مختلفة مثل
2. تنظيف البيانات وتحويلها
لتنظيف البيانات وتحويلها Power Query استخدم محرر
يتضمن ذلك إزالة التكرارات وتصفية الصفوف وإعادة تسمية الأعمدة والمزيد
3. إنشاء علاقات
حدد العلاقات بين الجداول باستخدام المفاتيح الأساسية والأجنبية لتوصيل البيانات ذات الصلة
4. إنشاء أعمدة ومقاييس محسوبة
لإنشاء أعمدة ومقاييس محسوبة لحسابات البيانات المتقدمة والتجميعات DAX استخدم
5. تحديد التسلسلات الهرمية
قم بإنشاء التسلسلات الهرمية في جداول الأبعاد لتسهيل التحليل التفصيلي في التقارير
6. تحسين نموذج البيانات
قم بتحسين أداء نموذج البيانات من خلال تقليل عدد الأعمدة وتقليل تفاصيل البيانات واستخدام البيانات الملخصة حيثما أمكن
Power BIأفضل الممارسات لنمذجة البيانات في
1. استخدم مخطط النجمة
يفضل مخطط النجمة على مخطط ندفة الثلج من أجل البساطة والأداء
2. حافظ على نموذج البيانات بسيطًا
تجنب التعقيد غير الضروري، استخدم أسماء واضحة ووصفية للجداول والأعمدة
3. تطبيع البيانات
تطبيع البيانات لتقليل التكرار وتحسين سلامة البيانات
4. إنشاء مقاييس بدلاً من الأعمدة المحسوبة
استخدم المقاييس للتجميعات حيث يتم حسابها أثناء العمل ولا تزيد من حجم نموذج البيانات
5. تحسين العلاقات
استخدم العلاقات أحادية الاتجاه عندما يكون ذلك ممكنًا لتحسين الأداء
الاستنتاج
يعد نمذجة البيانات جانبًا بالغ الأهمية
فعّالة وعميقة Power BI لإنشاء تقارير ولوحات معلومات
فمن خلال فهم وتطبيق المفاهيم الأساسية وأفضل الممارسات التي تمت مناقشتها في هذا الدليل يمكنك إنشاء نماذج بيانات قوية تدعم التحليل الدقيق وإعداد التقارير، تذكر أن تحافظ على نموذج البيانات بسيطاً واستخدم مخطط النجوم وقم بالتحسين من أجل الأداء
Power BI قدمت هذه المقالة نظرة عامة شاملة على نمذجة البيانات في
مع خطوات عملية وأفضل الممارسات وأمثلة توضيحية لإرشادك خلال العملية
The data job market has grown exponentially over the past decade, driven by the increasing reliance on data-driven decision-making across industries. As we move into 2024, several key trends and insights are shaping the landscape of data-related careers. This article explores the current state, emerging trends, in-demand roles, required skills, and future outlook of the data job market.
1. Current State of the Data Job Market
The demand for data professionals continues to rise, with businesses across sectors investing heavily in data capabilities to gain a competitive edge.
A. High Demand for Data Talent
Industries: Finance, healthcare, retail, technology, and manufacturing are leading sectors.
Roles: Data scientists, data analysts, data engineers, and machine learning engineers are in high demand.
B. Competitive Salaries and Benefits
Compensation: Competitive salaries, sign-on bonuses, and comprehensive benefits packages are common.
Remote Work: Increased flexibility with remote and hybrid work options.
2. Emerging Trends in the Data Job Market
A. Increased Adoption of AI and Machine Learning
AI Integration: Companies are integrating AI and ML into their operations for predictive analytics, automation, and customer personalization.
Specialized Roles: Growing demand for AI specialists, machine learning engineers, and deep learning experts.
B. Emphasis on Data Privacy and Security
Regulations: Stricter data privacy regulations (e.g., GDPR, CCPA) are driving the need for data governance and compliance roles.
Security: Increased focus on data security, leading to demand for data security analysts and cybersecurity experts.
C. Rise of DataOps and MLOps
DataOps: Streamlining data management and analytics workflows to enhance efficiency and collaboration.
MLOps: Managing machine learning lifecycle, from development to deployment and monitoring.
Advertisements
3. In-Demand Data Roles in 2024
A. Data Scientist
Responsibilities: Analyzing complex data sets, developing predictive models, and providing actionable insights.
Skills: Proficiency in Python, R, SQL, machine learning, and statistical analysis.
B. Data Engineer
Responsibilities: Designing, building, and maintaining data pipelines and architectures.
Skills: Expertise in ETL processes, data warehousing, and cloud platforms (e.g., AWS, Azure, GCP).
C. Machine Learning Engineer
Responsibilities: Developing, deploying, and optimizing machine learning models.
Skills: Strong programming skills (Python, Java), deep learning frameworks (TensorFlow, PyTorch), and model deployment.
D. Data Analyst
Responsibilities: Interpreting data, generating reports, and supporting business decision-making.
Skills: Proficiency in data visualization tools (Tableau, Power BI), Excel, and SQL.
E. Data Privacy Officer
Responsibilities: Ensuring data privacy compliance and managing data protection strategies.
Skills: Knowledge of data privacy laws, risk assessment, and data governance.
4. Essential Skills for Data Professionals in 2024
A. Technical Skills
Programming: Python, R, SQL, and other relevant languages.
Data Visualization: Tools like Tableau, Power BI, and D3.js.
Big Data Technologies: Hadoop, Spark, Kafka, and related technologies.
Cloud Computing: AWS, Azure, GCP, and cloud data services.
B. Soft Skills
Communication: Ability to translate complex data insights into actionable business recommendations.
Problem-Solving: Strong analytical and critical thinking skills.
Collaboration: Working effectively in cross-functional teams.
5. Future Outlook and Opportunities
A. Continuous Learning and Adaptation
Lifelong Learning: Staying updated with the latest tools, technologies, and methodologies.
Certifications: Earning relevant certifications (e.g., AWS Certified Big Data, Google Data Engineer) to enhance credibility.
B. Emerging Fields
Data Ethics: Growing importance of ethical considerations in data collection and analysis.
Quantum Computing: Potential impact on data processing and analytics, leading to new roles and opportunities.
C. Global Opportunities
Remote Work: Expanding opportunities for remote data jobs, allowing access to global talent pools.
Diverse Markets: Increasing demand for data professionals in emerging markets and developing economies.
Conclusion
The data job market in 2024 is characterized by rapid growth, high demand for skilled professionals, and exciting new opportunities driven by technological advancements. By staying abreast of emerging trends, acquiring essential skills, and continuously learning, data professionals can thrive in this dynamic and rewarding field. The future of the data job market holds immense potential for those ready to embrace its challenges and opportunities.
Advertisements
أفضل الرؤى حول سوق وظائف البيانات 2024
Advertisements
نما سوق وظائف البيانات بشكل كبير خلال العقد الماضي مدفوعًا بالاعتماد المتزايد على عملية صنع القرار المستندة إلى البيانات عبر الصناعات، ومع وصولنا إلى عام 2024 تعمل العديد من الاتجاهات والرؤى الرئيسية على تشكيل مشهد المهن المتعلقة بالبيانات
يستكشف هذا المقال الوضع الحالي والاتجاهات الناشئة والأدوار المطلوبة والمهارات المطلوبة والتوقعات المستقبلية لسوق عمل البيانات
1. الوضع الحالي لسوق عمل البيانات
يستمر الطلب على متخصصي البيانات في الارتفاع حيث تستثمر الشركات عبر القطاعات بشكل كبير في قدرات البيانات للحصول على ميزة تنافسية
أ. ارتفاع الطلب على المواهب المتعلقة بالتعامل مع البيانات
الصناعات: تعتبر قطاعات التمويل والرعاية الصحية وتجارة التجزئة والتكنولوجيا والتصنيع من القطاعات الرائدة
الأدوار: هناك طلب كبير على علماء البيانات، ومحللي البيانات، ومهندسي البيانات، ومهندسي التعلم الآلي
ب. رواتب ومزايا تنافسية
التعويض: تعتبر الرواتب التنافسية ومكافآت تسجيل الدخول وحزم المزايا الشاملة أمراً شائعاً
العمل عن بعد: زيادة المرونة مع خيارات العمل عن بعد والمختلط
2. الاتجاهات الناشئة في سوق وظائف البيانات
أ. زيادة اعتماد الذكاء الاصطناعي والتعلم الآلي
تكامل الذكاء الاصطناعي: تعمل الشركات على دمج الذكاء الاصطناعي والتعلم الآلي في عملياتها من أجل التحليلات التنبؤية والأتمتة وتخصيص العملاء
المسؤوليات: تفسير البيانات وتوليد التقارير ودعم اتخاذ القرارات التجارية
Tableau، Power BI، Excel، SQL المهارات: الكفاءة في أدوات تصور البيانات
هـ. مسؤول خصوصية البيانات
المسؤوليات: ضمان الامتثال لخصوصية البيانات وإدارة استراتيجيات حماية البيانات
المهارات: المعرفة بقوانين خصوصية البيانات وتقييم المخاطر وإدارة البيانات
4. المهارات الأساسية لمتخصصي البيانات في عام 2024
أ. المهارات الفنية
واللغات الأخرى ذات الصلة Python، R، SQL : البرمجة
D3.js و Power BI و Tableau تصور البيانات: أدوات مثل
Hadoop، Spark، Kafka :تقنيات البيانات الضخمة
AWS و Azure و GCP الحوسبة السحابية: خدمات البيانات السحابية
ب. المهارات الناعمة
الاتصالات: القدرة على ترجمة رؤى البيانات المعقدة إلى توصيات تجارية قابلة للتنفيذ
حل المشكلات: مهارات التفكير التحليلي والنقدي القوية
التعاون: العمل بفعالية في فرق متعددة الوظائف
5. النظرة المستقبلية والفرص
أ. التعلم المستمر والتكيف
التعلم مدى الحياة: البقاء على اطلاع بأحدث الأدوات والتقنيات والمنهجيات
الشهادات: الحصول على الشهادات ذات الصلة
Google Data Engineer و AWS Certified Big Data :على سبيل المثال
ب. المجالات الناشئة
أخلاقيات البيانات: تزايد أهمية الاعتبارات الأخلاقية في جمع البيانات وتحليلها
الحوسبة الكمومية: التأثير المحتمل على معالجة البيانات والتحليلات مما يؤدي إلى أدوار وفرص جديدة
ج. الفرص العالمية
العمل عن بعد: توسيع فرص وظائف البيانات عن بعد مما يسمح بالوصول إلى مجموعات المواهب العالمية
أسواق متنوعة: زيادة الطلب على محترفي البيانات في الأسواق الناشئة والاقتصادات النامية
ختاماً
يتميز سوق وظائف البيانات في عام 2024 بالنمو السريع وارتفاع الطلب على المهنيين المهرة والفرص الجديدة المثيرة المدفوعة بالتقدم التكنولوجي، فمن خلال مواكبة الاتجاهات الناشئة واكتساب المهارات الأساسية والتعلم المستمر يمكن لمحترفي البيانات أن يزدهروا في هذا المجال الديناميكي والمجزي، يحمل مستقبل سوق عمل البيانات إمكانات هائلة لأولئك المستعدين لتقبل تحدياته وفرصه
Passive income is money earned with minimal active involvement, allowing you to build wealth and financial security over time. While many passive income strategies require initial investment, there are several ways to generate passive income without any upfront cost. This article explores various methods to create passive income from scratch.
1. Leverage Your Skills and Talents
One of the most effective ways to create passive income is by leveraging skills you already possess.
A. Freelancing to Build Capital
Platforms: Sign up on freelancing websites like Upwork, Fiverr, or Freelancer.
Services: Offer skills like writing, graphic design, programming, or digital marketing.
Building a Portfolio: Use initial earnings to build a portfolio that can be leveraged later.
B. Creating Digital Products
E-books: Write and publish e-books on topics you’re knowledgeable about. Use platforms like Amazon Kindle Direct Publishing.
Online Courses: Create online courses and sell them on platforms like Udemy, Teachable, or Skillshare.
Templates and Printables: Design digital templates or printables to sell on Etsy or Gumroad.
2. Content Creation
Content creation is a powerful way to generate passive income with no money upfront.
A. Blogging
Start a Blog: Use free blogging platforms like WordPress.com or Blogger.
Content: Write about topics you’re passionate about or have expertise in.
Monetization: Earn through ads (Google AdSense), affiliate marketing, and sponsored posts.
B. YouTube
Create a YouTube Channel: Use your smartphone to start a channel.
Content: Focus on engaging and valuable content that attracts viewers.
Monetization: Earn through YouTube Partner Program (ad revenue), sponsorships, and merchandise.
Advertisements
3. Social Media and Influencer Marketing
Building a social media presence can lead to multiple passive income streams.
A. Growing Your Following
Platforms: Choose platforms like Instagram, TikTok, or Twitter.
Engagement: Consistently post valuable and engaging content.
Authenticity: Build a genuine connection with your audience.
B. Monetization
Sponsored Posts: Collaborate with brands for sponsored content.
Affiliate Marketing: Promote products and earn a commission on sales through affiliate links.
Brand Partnerships: Establish long-term partnerships with brands for ongoing income.
4. Creating a Personal Brand
A strong personal brand can open doors to various passive income opportunities.
A. Establishing Your Brand
Identity: Define your niche and unique selling proposition (USP).
Consistency: Maintain consistency in your content, messaging, and visuals.
Engagement: Actively engage with your audience to build trust and loyalty.
B. Expanding Income Streams
Digital Products: Sell e-books, courses, and printables under your personal brand.
Membership Sites: Create membership sites where users pay for exclusive content.
Merchandise: Design and sell branded merchandise.
5. Utilizing Free Resources and Learning
Continuous learning and networking can significantly enhance your passive income journey.
A. Free Educational Resources
YouTube Tutorials: Learn new skills and strategies through free tutorials.
Online Courses: Enroll in free courses on platforms like Coursera, edX, or Khan Academy.
Podcasts and Blogs: Stay updated with industry trends and insights.
B. Networking and Communities
Online Communities: Join forums, Facebook groups, or LinkedIn groups related to your niche.
Networking: Connect with like-minded individuals, share experiences, and explore collaboration opportunities.
6. Transitioning to Passive Income
As you build active income streams, gradually transition them into passive income.
A. Automation
Tools: Use automation tools for social media posting, email marketing, and customer management.
Delegation: Outsource tasks to freelancers or virtual assistants.
B. Investment of Earnings
Reinvestment: Reinvest your earnings into scalable passive income streams.
Diversification: Diversify your income sources to reduce risk and ensure stability.
Conclusion
Creating passive income with no money requires creativity, resourcefulness, and consistent effort. By leveraging your skills, creating valuable content, building a personal brand, and continuously learning, you can generate passive income streams that contribute to your financial independence. Start small, stay persistent, and gradually expand your passive income portfolio.
Advertisements
كيف يمكنك تحقيق دخل سلبي بدون أموال
Advertisements
الدخل السلبي هو المال الذي يتم الحصول عليه بأقل قدر من المشاركة النشطة مما يسمح لك ببناء الثروة التي تؤمن مستقبلك المادي مع مرور الوقت، في حين أن العديد من استراتيجيات الدخل السلبي تتطلب استثماراً أولياً هناك عدة طرق لتوليد الدخل السلبي دون أي تكلفة مقدمة
تستكشف هذه المقالة طرقًا مختلفة لإنشاء دخل سلبي من الصفر
1. استفد من مهاراتك ومواهبك
إحدى أكثر الطرق فعالية لتحقيق دخل سلبي هي الاستفادة من المهارات التي تمتلكها بالفعل
أ. العمل الحر لبناء رأس المال
المنصات: قم بالتسجيل في مواقع العمل الحر *
Upwork أو Fiverr أو Freelancer مثل
الخدمات: تقديم مهارات مثل الكتابة أو التصميم الجرافيكي أو البرمجة أو التسويق الرقمي *
بناء محفظة أعمال: استخدم الأرباح الأولية لبناء محفظة يمكن الاستفادة منها لاحقاً *
ب. إنشاء المنتجات الرقمية
الكتب الإلكترونية: قم بكتابة ونشر كتب إلكترونية حول موضوعات تعرفها، استخدم منصات *
Amazon Kindle Direct Publishing مثل
الدورات التدريبية عبر الإنترنت: أنشئ دورات عبر الإنترنت وقم ببيعها على منصات *
يعد إنشاء المحتوى طريقة قوية لتوليد دخل سلبي دون الحاجة إلى أموال مقدماً
أ. التدوين
ابدأ مدونة: استخدم منصات التدوين المجانية *
WordPress.com أو Blogger مثل
المحتوى: اكتب عن المواضيع التي تثير شغفك أو لديك خبرة فيها *
(Google AdSense) تحقيق الدخل: اربح من خلال الإعلانات *
والتسويق التابع والمشاركات الدعائية
ب. يوتيوب
إنشاء قناة على يوتيوب: استخدم هاتفك الذكي لبدء قناة *
المحتوى: التركيز على المحتوى الجذاب والقيم الذي يجذب المشاهدين *
تحقيق الدخل: اربح من خلال برنامج شركاء يوتيوب (إيرادات الإعلانات) والرعاية والسلع *
Advertisements
3. وسائل التواصل الاجتماعي والتسويق المؤثر
يمكن أن يؤدي بناء تواجد على وسائل التواصل الاجتماعي إلى تدفقات دخل سلبية متعددة
أ. زيادة متابعتك
Instagram أو TikTok أو Twitter المنصات: اختر منصات مثل *
المشاركة: قم بنشر محتوى قيم وجذاب باستمرار *
المصداقية: قم ببناء علاقة حقيقية مع جمهورك *
ب. تحقيق الدخل
المشاركات التي ترعاها: التعاون مع العلامات التجارية للمحتوى المدعوم *
التسويق بالعمولة: قم بترويج المنتجات واحصل على عمولة على المبيعات من خلال الروابط التابعة *
شراكات العلامات التجارية: إقامة شراكات طويلة الأمد مع العلامات التجارية لتحقيق دخل مستمر *
4. إنشاء علامة تجارية شخصية
يمكن للعلامة التجارية الشخصية القوية أن تفتح الأبواب أمام فرص الدخل السلبي المختلفة
أ. تأسيس علامتك التجارية
(USP) الهوية: تحديد مكانك وعرض البيع الفريد *
الاتساق: حافظ على الاتساق في المحتوى الخاص بك والرسائل والمرئيات *
المشاركة: تفاعل بشكل فعال مع جمهورك لبناء الثقة والولاء *
ب. توسيع مصادر الدخل
المنتجات الرقمية: بيع الكتب الإلكترونية والدورات التدريبية والمطبوعات تحت علامتك التجارية الشخصية *
مواقع العضوية: قم بإنشاء مواقع العضوية حيث يدفع المستخدمون مقابل المحتوى الحصري *
البضائع: تصميم وبيع البضائع ذات العلامات التجارية *
5. الاستفادة من الموارد المجانية والتعلم
التعلم المستمر والتواصل يمكن أن يعزز بشكل كبير رحلة الدخل السلبي الخاصة بك
أ. الموارد التعليمية المجانية
دروس يوتيوب: تعلم مهارات واستراتيجيات جديدة من خلال البرامج التعليمية المجانية *
الدورات التدريبية عبر الإنترنت: قم بالتسجيل في الدورات التدريبية المجانية على منصات *
Coursera أو edX أو Khan Academy مثل
المدونات الصوتية والمدونات: ابق على اطلاع بأحدث اتجاهات الصناعة وأفكارها *
ب. الشبكات والمجتمعات
المجتمعات عبر الإنترنت: انضم إلى المنتديات
ذات الصلة بمكانتك LinkedIn أو مجموعات Facebook أو مجموعات
التواصل: التواصل مع الأفراد ذوي التفكير المماثل وتبادل الخبرات واستكشاف فرص التعاون *
6. الانتقال إلى الدخل السلبي
عندما تقوم ببناء مصادر دخل نشطة قم بتحويلها تدريجيًا إلى دخل سلبي
أ. الأتمتة
الأدوات: استخدم أدوات التشغيل الآلي للنشر على وسائل التواصل الاجتماعي والتسويق عبر البريد الإلكتروني وإدارة العملاء *
التفويض: الاستعانة بمصادر خارجية للمستقلين أو المساعدين الظاهريين *
ب. استثمار الأرباح
إعادة الاستثمار: أعد استثمار أرباحك في مصادر دخل سلبية قابلة للتطوير *
التنويع: قم بتنويع مصادر دخلك لتقليل المخاطر وضمان الاستقرار *
ختاماً
يتطلب إنشاء دخل سلبي بدون أموال الإبداع وسعة الحيلة والجهد المستمر فمن خلال الاستفادة من مهاراتك وإنشاء محتوى قيم وبناء علامة تجارية شخصية والتعلم المستمر يمكنك توليد مصادر دخل سلبية تساهم في استقلالك المالي. ابدأ صغيراً وحافظ على مثابرتك وقم بتوسيع محفظة دخلك السلبي تدريجياً
Analyzing sales data from a coffee shop provides valuable insights that can inform decision-making processes, enhance customer experiences, and improve profitability.
This article outlines a comprehensive data analysis project for a coffee shop, detailing the steps taken to gather, process, and analyze sales data.
Objectives
The primary objectives of this data analysis project include:
Understanding sales trends over time.
Identifying the most popular products.
Analyzing sales by time of day and day of the week.
Evaluating the impact of promotions.
Understanding customer preferences and behavior.
Data Collection
Data Sources
Data for this project can be collected from various sources, including:
Point-of-Sale (POS) Systems: Transaction data, including product, quantity, price, time, and date.
Customer Surveys: Feedback on products, service quality, and preferences.
Loyalty Programs: Data on repeat customers and their purchasing habits.
Sample Data
For simplicity, consider the following sample data structure from the POS system:
Transaction_ID
Date
Time
Product
Quantity
Price
Promotion
1
2024-07-01
08:05
Latte
2
5.00
None
2
2024-07-01
08:15
Espresso
1
3.00
None
3
2024-07-01
08:45
Cappuccino
1
4.50
10% Off
…
…
…
…
…
…
…
Data Processing
Data Cleaning
Data cleaning involves removing duplicates, handling missing values, and correcting errors. For instance:
Missing Values: Filling or removing missing entries.
Duplicates: Removing duplicate transactions.
Incorrect Entries: Correcting any discrepancies in product names or prices.
Data Transformation
Transform the data into a format suitable for analysis. This may include:
Datetime Conversion: Convert date and time strings to datetime objects.
Feature Engineering: Create new features like Day of Week, Hour of Day, and Total Sales.
Example in Python using Pandas:
Data Analysis
Sales Trends Over Time
Analyzing sales over different time periods helps identify trends and seasonal patterns.
Daily Sales: Sum of sales for each day.
Weekly and Monthly Trends: Aggregating daily sales into weekly or monthly totals to observe longer-term trends.
Popular Products
Identifying the best-selling products can guide inventory and marketing strategies.
Sales by Time of Day and Day of Week
Understanding peak hours and busy days helps in staff scheduling and promotional planning.
Advertisements
Impact of Promotions
Evaluate the effectiveness of promotions by comparing sales during promotional periods with regular periods.
Customer Preferences and Behavior
Analyzing data from loyalty programs and surveys can provide insights into customer preferences.
Visualization
Visualizing the analysis results makes it easier to communicate insights.
Line Charts: For sales trends over time.
Bar Charts: For product popularity and sales by day/hour.
Pie Charts: For market share of different products.
Heatmaps: For sales distribution across different times and days.
Example Visualizations
Sales Trends
Product Popularity
Conclusion
This coffee shop sales analysis project demonstrates how to collect, process, and analyze sales data to gain valuable insights. By understanding sales trends, popular products, and customer behavior, coffee shop owners can make informed decisions to enhance their operations and profitability. Implementing data-driven strategies can lead to better inventory management, targeted marketing campaigns, and improved customer satisfaction.
Advertisements
مشروع تحليل البيانات – تحليل مبيعات المقاهي
Advertisements
مقدمة
يوفر تحليل بيانات المبيعات من المقهى رؤى قيمة يمكن أن تفيد عمليات صنع القرار وتعزيز تجارب العملاء وتحسين الربح
توضح هذه المقالة مشروعًا شاملاً لتحليل البيانات لأحد المقاهي مع توضيح الخطوات المتخذة لجمع بيانات المبيعات ومعالجتها وتحليلها
الأهداف
:تشمل الأهداف الأساسية لمشروع تحليل البيانات ما يلي
1. فهم اتجاهات المبيعات مع مرور الوقت
2. التعرف على المنتجات الأكثر رواجاً
3. تحليل المبيعات حسب الوقت من اليوم واليوم من الأسبوع
4. تقييم أثر الترقيات
5. فهم تفضيلات العملاء وسلوكهم
:جمع البيانات
:مصادر البيانات
:يمكن جمع البيانات لهذا المشروع من مصادر مختلفة بما في ذلك
: (POS) أنظمة نقاط البيع *
بيانات المعاملات بما في ذلك المنتج والكمية والسعر والوقت والتاريخ
استطلاعات العملاء : ردود الفعل على المنتجات وجودة الخدمة والتفضيلات *
برنامج العملاء الدائمين : بيانات عن العملاء المتكررين وعاداتهم الشرائية *
: بيانات العينة
للتبسيط خذ بعين الاعتبار بنية البيانات النموذجية التالية من نظام نقطة البيع
Transaction_ID
Date
Time
Product
Quantity
Price
Promotion
1
2024-07-01
08:05
Latte
2
5.00
None
2
2024-07-01
08:15
Espresso
1
3.00
None
3
2024-07-01
08:45
Cappuccino
1
4.50
10% Off
…
…
…
…
…
…
…
:معالجة البيانات
تنظيف البيانات
: يتضمن تنظيف البيانات إزالة التكرارات ومعالجة القيم المفقودة وتصحيح الأخطاء، على سبيل المثال
القيم المفقودة: ملء أو إزالة الإدخالات المفقودة *
التكرارات: إزالة المعاملات المكررة *
إدخالات غير صحيحة: تصحيح أي اختلافات في أسماء المنتجات أو الأسعار *
:تحويل البيانات
:تحويل البيانات إلى تنسيق مناسب للتحليل، قد يشمل ذلك
تحويل التاريخ والوقت: تحويل سلاسل التاريخ والوقت إلى كائنات التاريخ والوقت *
هندسة الميزات: إنشاء ميزات جديدة مثل يوم من الأسبوع وساعة من اليوم وإجمالي المبيعات *
: Pandas مثال في بايثون باستخدام
:تحليل البيانات
:اتجاهات المبيعات مع مرور الوقت
يساعد تحليل المبيعات على مدى فترات زمنية مختلفة في تحديد الاتجاهات والأنماط الموسمية
المبيعات اليومية: مجموع المبيعات لكل يوم
الاتجاهات الأسبوعية والشهرية: تجميع المبيعات اليومية إلى مجاميع أسبوعية أو شهرية لمراقبة الاتجاهات طويلة الأمد
Advertisements
المنتجات الشعبية
يمكن أن يؤدي تحديد المنتجات الأكثر مبيعًا إلى توجيه استراتيجيات المخزون والتسويق
المبيعات حسب الوقت من اليوم واليوم من الأسبوع
يساعد فهم ساعات الذروة والأيام المزدحمة في جدولة الموظفين والتخطيط الترويجي
:تأثير الترقيات
تقييم فعالية العروض الترويجية من خلال مقارنة المبيعات خلال الفترات الترويجية بالفترات العادية
:تفضيلات العملاء وسلوكهم
يمكن أن يوفر تحليل البيانات من برامج الولاء والاستطلاعات نظرة ثاقبة لتفضيلات العملاء
:التصور
يؤدي تصور نتائج التحليل إلى تسهيل توصيل الرؤى
الرسوم البيانية الخطية: لاتجاهات المبيعات مع مرور الوقت *
الرسوم البيانية الشريطية: لمعرفة شعبية المنتج ومبيعاته حسب اليوم/الساعة *
الرسوم البيانية الدائرية: لحصة السوق من المنتجات المختلفة *
الخرائط الحرارية: لتوزيع المبيعات عبر أوقات وأيام مختلفة *
:تصورات المثال
:اتجاهات المبيعات
:شعبية المنتج
:خاتمة
يوضح مشروع تحليل مبيعات المقاهي كيفية جمع بيانات المبيعات ومعالجتها وتحليلها للحصول على رؤى قيمة، من خلال فهم اتجاهات المبيعات والمنتجات الشعبية وسلوك العملاء يمكن لأصحاب المقاهي اتخاذ قرارات مستنيرة لتعزيز عملياتهم وربحيتهم، ويمكن أن يؤدي تنفيذ الاستراتيجيات المبنية على البيانات إلى إدارة أفضل للمخزون وحملات تسويقية مستهدفة وتحسين رضا العملاء
In the ever-evolving landscape of data science, staying ahead of the curve requires a keen understanding of the skills that are driving the industry forward. As we move further into 2024, several key competencies have emerged as critical for data scientists. These skills not only enhance individual capabilities but also ensure that organizations can leverage data effectively to drive decision-making and innovation. Here are the five data science skills you can’t ignore in 2024:
1. Advanced Machine Learning and AI
Machine learning (ML) and artificial intelligence (AI) continue to be at the forefront of data science. As these technologies evolve, the demand for advanced expertise in this area has skyrocketed. Understanding complex algorithms, neural networks, and deep learning frameworks is crucial.
Deep Learning: Mastery of deep learning frameworks such as TensorFlow and PyTorch is essential. Deep learning, a subset of machine learning, focuses on neural networks with many layers (deep neural networks). These are particularly effective in tasks such as image and speech recognition, natural language processing, and complex pattern recognition.
Natural Language Processing (NLP): With the explosion of unstructured data from sources like social media, customer reviews, and other text-heavy formats, NLP has become a vital skill. Understanding NLP techniques such as sentiment analysis, entity recognition, and language generation is critical for extracting meaningful insights from text data.
Model Optimization: Beyond building models, optimizing them for performance and efficiency is key. Techniques like hyperparameter tuning, cross-validation, and deployment-ready solutions ensure that ML models are both robust and scalable.
2. Data Engineering
Data engineering is the backbone of data science, ensuring that data is collected, stored, and processed efficiently. With the volume of data growing exponentially, the role of data engineers has become more crucial than ever.
Big Data Technologies: Proficiency in big data tools such as Hadoop, Spark, and Kafka is vital. These technologies enable the processing and analysis of large datasets that traditional databases cannot handle.
Data Warehousing Solutions: Understanding cloud-based data warehousing solutions like Amazon Redshift, Google BigQuery, and Snowflake is important. These platforms offer scalable, flexible, and cost-effective data storage and processing solutions.
ETL Processes: Extract, Transform, Load (ETL) processes are fundamental in preparing data for analysis. Knowledge of ETL tools like Apache NiFi, Talend, and Informatica ensures that data is clean, reliable, and ready for use.
3. Data Visualization and Storytelling
Data visualization and storytelling are about transforming data into actionable insights. The ability to communicate complex information in a clear and compelling way is invaluable.
Visualization Tools: Proficiency in tools such as Tableau, Power BI, and D3.js is essential. These tools help create interactive and intuitive visual representations of data.
Design Principles: Understanding design principles and best practices for visual communication ensures that visualizations are not only aesthetically pleasing but also effective in conveying the intended message.
Storytelling Techniques: Beyond visualization, storytelling involves crafting a narrative that contextualizes data insights. This skill is critical for engaging stakeholders and driving data-driven decision-making.
Advertisements
4. Cloud Computing and Data Management
Cloud computing has revolutionized the way data is stored, processed, and analyzed. Familiarity with cloud platforms and data management strategies is a must for modern data scientists.
Cloud Platforms: Expertise in platforms like AWS, Google Cloud, and Azure is crucial. These platforms offer a range of services from data storage and processing to machine learning and AI capabilities.
Data Security and Governance: Understanding data security protocols and governance frameworks ensures that data is handled responsibly. This includes knowledge of GDPR, CCPA, and other regulatory requirements.
Scalable Solutions: Implementing scalable solutions that can handle growing data volumes without compromising performance is essential. This involves using distributed computing and parallel processing techniques.
5. Domain Expertise and Business Acumen
While technical skills are paramount, domain expertise and business acumen are equally important. Understanding the specific industry and business context in which data science is applied can significantly enhance the impact of data-driven solutions.
Industry Knowledge: Gaining expertise in specific industries such as finance, healthcare, or retail allows data scientists to tailor their approaches to the unique challenges and opportunities within those sectors.
Problem-Solving Skills: The ability to translate business problems into data science problems and vice versa is crucial. This requires a deep understanding of both the technical and business aspects of a project.
Communication Skills: Effectively communicating findings and recommendations to non-technical stakeholders ensures that data insights are acted upon. This involves simplifying complex concepts and focusing on the business value of data science initiatives.
Conclusion
As we navigate through 2024, the data science landscape will continue to evolve, driven by advancements in technology and changing business needs. By mastering these five key skills—advanced machine learning and AI, data engineering, data visualization and storytelling, cloud computing and data management, and domain expertise and business acumen—data scientists can position themselves at the cutting edge of the industry. These competencies not only enhance individual careers but also empower organizations to harness the full potential of their data, driving innovation, efficiency, and growth.
Advertisements
مهارات علم البيانات الخمس التي لا يمكنك تجاهلها في عام 2024
Advertisements
في المشهد المتطور باستمرار لعلم البيانات يتطلب البقاء في الطليعة فهماً عميقاً للمهارات التي تدفع الصناعة إلى الأمام، مع تقدمنا نحو عام 2024 ظهرت العديد من الكفاءات الرئيسية باعتبارها بالغة الأهمية لعلماء البيانات، لا تعمل هذه المهارات على تعزيز القدرات الفردية فحسب بل تضمن أيضاً قدرة المؤسسات على الاستفادة من البيانات بشكل فعال لدفع عملية صنع القرار والابتكار
فيما يلي مهارات علم البيانات الخمس التي لا يمكنك تجاهلها في عام 2024
1. التعلم الآلي المتقدم والذكاء الاصطناعي
لا يزال التعلم الآلي والذكاء الاصطناعي في طليعة علوم البيانات، ومع تطور هذه التقنيات ارتفع الطلب على الخبرة المتقدمة في هذا المجال بشكل كبير، يعد فهم الخوارزميات المعقدة والشبكات العصبية وأطر التعلم العميق أمرًا بالغ الأهمية
أمراً ضرورياً PyTorch و TensorFlow التعلم العميق: يعد إتقان أطر التعلم العميق مثل
التعلم العميق وهو مجموعة فرعية من التعلم الآلي يركز على الشبكات العصبية ذات الطبقات المتعددة (الشبكات العصبية العميقة) وهي فعالة بشكل خاص في مهام مثل التعرف على الصور والكلام ومعالجة اللغة الطبيعية والتعرف على الأنماط المعقدة
معالجة اللغات الطبيعية: مع تزايد البيانات غير المنظمة من مصادر مثل وسائل التواصل الاجتماعي ومراجعات العملاء وغيرها من التنسيقات التي تحتوي على نصوص ثقيلة أصبحت البرمجة اللغوية العصبية مهارة حيوية. يعد فهم تقنيات البرمجة اللغوية العصبية مثل تحليل المشاعر والتعرف على الكيانات وتوليد اللغة أمراً بالغ الأهمية لاستخلاص رؤى ذات معنى من البيانات النصية
تحسين النموذج: إلى جانب بناء النماذج يعد تحسينها من أجل الأداء والكفاءة أمراً أساسياً تضمن تقنيات مثل ضبط المعلمات الفائقة والتحقق المتبادل والحلول الجاهزة للنشر أن تكون نماذج تعلم الآلة قوية وقابلة للتطوير
2. هندسة البيانات
هندسة البيانات هي العمود الفقري لعلم البيانات مما يضمن جمع البيانات وتخزينها ومعالجتها بكفاءة. مع تزايد حجم البيانات بشكل كبير أصبح دور مهندسي البيانات أكثر أهمية من أي وقت مضى
تقنيات البيانات الضخمة: يعد إتقان أدوات البيانات الضخمة
أمراً حيوياً Kafkaو Sparkو Hadoop مثل
تتيح هذه التقنيات معالجة وتحليل مجموعات البيانات الكبيرة التي لا تستطيع قواعد البيانات التقليدية التعامل معها
حلول تخزين البيانات: من المهم فهم حلول تخزين البيانات المستندة
Snowflakeو Google BigQueryو Amazon Redshift إلى السحابة مثل
توفر هذه الأنظمة الأساسية حلولاً لتخزين البيانات ومعالجتها قابلة للتطوير ومرنة وفعالة من حيث التكلفة
:ETL عمليات
(ETL) تعد عمليات الاستخراج والتحويل والتحميل
ETL أساسية في إعداد البيانات للتحليل، بحيث تضمن المعرفة بأدوات
Apache NiFi و Talend و Informatica مثل
أن تكون البيانات نظيفة وموثوقة وجاهزة للاستخدام
Advertisements
3. تصور البيانات وسرد القصص
يدور تصور البيانات وسرد القصص حول تحويل البيانات إلى رؤى قابلة للتنفيذ، إن القدرة على توصيل المعلومات المعقدة بطريقة واضحة ومقنعة لا تقدر بثمن
Tableau و Power BI أدوات التصور: يعد الكفاءة في أدوات مثل
أمراً ضرورياً، تساعد هذه الأدوات في إنشاء تمثيلات مرئية تفاعلية وبديهية للبيانات
مبادئ التصميم: إن فهم مبادئ التصميم وأفضل الممارسات للاتصال المرئي يضمن أن التصورات ليست ممتعة من الناحية الجمالية فحسب بل فعالة أيضًا في نقل الرسالة المقصودة
تقنيات سرد القصص: إلى جانب التصور يتضمن سرد القصص صياغة سرد يضع رؤى البيانات في سياقها بحيث تعد هذه المهارة أمراً بالغ الأهمية لإشراك أصحاب المصلحة وقيادة عملية صنع القرار المستندة إلى البيانات
4. الحوسبة السحابية وإدارة البيانات
أحدثت الحوسبة السحابية ثورة في طريقة تخزين البيانات ومعالجتها وتحليلها، فيعد الإلمام بالمنصات السحابية واستراتيجيات إدارة البيانات أمراً ضرورياً لعلماء البيانات المعاصرين
الأنظمة الأساسية السحابية: تعد الخبرة في الأنظمة الأساسية
أمراً بالغ الأهمية AWS و Google Cloud و Azure مثل
تقدم هذه المنصات مجموعة من الخدمات بدءاً من تخزين البيانات ومعالجتها وحتى التعلم الآلي وقدرات الذكاء الاصطناعي
أمن البيانات وحوكمتها: إن فهم بروتوكولات أمان البيانات وأطر الحوكمة يضمن التعامل مع البيانات بطريقة مسؤولة
(GDPR) يتضمن ذلك معرفة القانون العام لحماية البيانات
(CCPA) وقانون خصوصية المستهلك في كاليفورنيا
والمتطلبات التنظيمية الأخرى
الحلول القابلة للتطوير: يعد تنفيذ الحلول القابلة للتطوير والتي يمكنها التعامل مع أحجام البيانات المتزايدة دون المساس بالأداء أمراً ضرورياً، يتضمن ذلك استخدام تقنيات الحوسبة الموزعة والمعالجة المتوازية
5. خبرة المجال والذكاء التجاري
في حين أن المهارات التقنية لها أهمية قصوى فإن الخبرة في المجال والفطنة التجارية لهما نفس القدر من الأهمية، إن فهم سياق الصناعة والأعمال المحدد الذي يتم فيه تطبيق علم البيانات يمكن أن يعزز بشكل كبير تأثير الحلول المستندة إلى البيانات
المعرفة الصناعية: اكتساب الخبرة في صناعات محددة مثل التمويل أو الرعاية الصحية أو البيع بالتجزئة يسمح لعلماء البيانات بتكييف مناهجهم مع التحديات والفرص الفريدة داخل تلك القطاعات
مهارات حل المشكلات: تعد القدرة على ترجمة مشكلات العمل إلى مشكلات في علم البيانات والعكس أمراً بالغ الأهمية، وهذا يتطلب فهماً عميقاً للجوانب الفنية والتجارية للمشروع
مهارات الاتصال: يضمن توصيل النتائج والتوصيات بشكل فعال إلى أصحاب المصلحة غير التقنيين العمل بناءً على رؤى البيانات، يتضمن ذلك تبسيط المفاهيم المعقدة والتركيز على القيمة التجارية لمبادرات علوم البيانات
خاتمة
بينما ننتقل إلى عام 2024 سيستمر مشهد علوم البيانات في التطور مدفوعاً بالتقدم التكنولوجي واحتياجات الأعمال المتغيرة، من خلال إتقان هذه المهارات الخمس الأساسية التعلم الآلي المتقدم والذكاء الاصطناعي وهندسة البيانات وتصور البيانات وسرد القصص والحوسبة السحابية وإدارة البيانات والخبرة في المجال والفطنة التجارية يمكن لعلماء البيانات أن يضعوا أنفسهم في طليعة الصناعة، فلا تعمل هذه الكفاءات على تعزيز الوظائف الفردية فحسب بل تعمل أيضاً على تمكين المؤسسات من تسخير الإمكانات الكاملة لبياناتها ودفع الابتكار والكفاءة والنمو
Data science is a multidisciplinary field that uses scientific methods, processes, algorithms, and systems to extract knowledge and insights from structured and unstructured data. The success of a data science project hinges on following best practices that ensure efficiency, accuracy, and reproducibility. Here are eight best practices that every data scientist should adhere to:
1. Define the Problem Clearly
Importance:
Establishing a clear understanding of the problem sets the direction for the entire project.
Helps in identifying the goals, requirements, and constraints of the project.
Steps:
Collaborate with stakeholders to gather detailed requirements.
Formulate the problem statement as a specific question or hypothesis.
Identify the metrics for success.
2. Data Collection and Cleaning
Importance:
High-quality data is the foundation of any data science project.
Cleaning the data ensures that the analysis is accurate and reliable.
Steps:
Collect data from reliable sources.
Handle missing values and outliers.
Ensure data consistency and accuracy through validation checks.
Document the data cleaning process for reproducibility.
3. Exploratory Data Analysis (EDA)
Importance:
EDA helps in understanding the underlying patterns and relationships in the data.
It guides feature selection and model selection.
Steps:
Use statistical summaries and visualizations to explore the data.
Identify key variables and their distributions.
Detect anomalies and patterns that may influence the modeling process.
4. Feature Engineering
Importance:
Feature engineering can significantly improve the performance of machine learning models.
It involves creating new features from existing data to better represent the underlying problem.
Steps:
Generate new features using domain knowledge.
Transform features to improve their predictive power.
Select the most relevant features using techniques like correlation analysis and feature importance.
Advertisements
5. Model Selection and Evaluation
Importance:
Choosing the right model and evaluation metrics is crucial for the success of the project.
Different models and metrics may be suitable for different types of problems.
Steps:
Experiment with various algorithms and techniques.
Use cross-validation to assess model performance.
Choose evaluation metrics that align with the business objectives (e.g., accuracy, precision, recall, F1 score).
6. Model Training and Tuning
Importance:
Training the model with optimal hyperparameters ensures the best possible performance.
Proper tuning avoids overfitting and underfitting.
Steps:
Split the data into training and validation sets.
Use techniques like grid search or random search for hyperparameter tuning.
Monitor training and validation performance to detect overfitting.
7. Model Deployment and Monitoring
Importance:
Deploying the model in a production environment allows it to provide real-time predictions.
Continuous monitoring ensures that the model remains accurate and relevant over time.
Steps:
Use tools and frameworks that support scalable deployment (e.g., Docker, Kubernetes).
Implement monitoring to track model performance and detect drift.
Set up a feedback loop to update the model with new data.
8. Documentation and Reproducibility
Importance:
Documentation ensures that the project can be understood and replicated by others.
Reproducibility is essential for validating results and maintaining trust in the findings.
Steps:
Document the entire workflow, including data sources, preprocessing steps, and model parameters.
Use version control systems (e.g., Git) to track changes in code and data.
Share code, data, and results in a structured format to facilitate collaboration.
Conclusion Adhering to these best practices in data science helps ensure that projects are executed efficiently, results are reliable, and insights are actionable. By defining the problem clearly, collecting and cleaning data meticulously, conducting thorough exploratory data analysis, engineering features effectively, selecting and evaluating models appropriately, training and tuning models carefully, deploying and monitoring models rigorously, and maintaining comprehensive documentation, data scientists can maximize the impact of their work and contribute valuable insights to their organizations.
Advertisements
أفضل 8 ممارسات في علم البيانات
Advertisements
علم البيانات هو مجال متعدد التخصصات يستخدم الأساليب العلمية والعمليات والخوارزميات والأنظمة لاستخراج المعرفة والرؤى من البيانات المنظمة وغير المنظمة، يعتمد نجاح مشروع علم البيانات على اتباع أفضل الممارسات التي تضمن الكفاءة والدقة وقابلية التكرار
فيما يلي ثمانية من أفضل الممارسات التي يجب على كل عالم بيانات الالتزام بها
1. حدد المشكلة بوضوح
:أهميتها
إنشاء فهم واضح للمشكلة يحدد الاتجاه للمشروع بأكمله *
يساعد في تحديد أهداف ومتطلبات وقيود المشروع *
:الخطوات
التعاون مع أصحاب المصلحة لجمع المتطلبات التفصيلية *
صياغة بيان المشكلة كسؤال محدد أو فرضية *
تحديد مقاييس النجاح *
2. جمع البيانات وتنظيفها
:أهميتها
البيانات عالية الجودة هي أساس أي مشروع لعلم البيانات *
تنظيف البيانات يضمن دقة التحليل وموثوقيته *
:الخطوات
جمع البيانات من مصادر موثوقة *
التعامل مع القيم المفقودة والقيم المتطرفة *
ضمان اتساق البيانات ودقتها من خلال عمليات التحقق من الصحة *
توثيق عملية تنظيف البيانات من أجل إمكانية تكرار نتائج *
3. (EDA) تحليل البيانات الاستكشافية
:أهميتها
يساعد تحليل البيانات الاستكشافية في فهم الأنماط والعلاقات الأساسية في البيانات *
أنه يوجه اختيار الميزة واختيار النموذج *
:الخطوات
استخدم الملخصات الإحصائية والمرئيات لاستكشاف البيانات *
تحديد المتغيرات الرئيسية وتوزيعاتها *
الكشف عن الحالات الشاذة والأنماط التي قد تؤثر على عملية النمذجة *
4. هندسة الميزات
:أهميتها
يمكن لهندسة الميزات تحسين أداء نماذج التعلم الآلي بشكل كبير *
يتضمن إنشاء ميزات جديدة من البيانات الموجودة لتمثيل المشكلة الأساسية بشكل أفضل *
:الخطوات
إنشاء ميزات جديدة باستخدام المعرفة بالمجال *
تحويل الميزات لتحسين قدرتها التنبؤية *
تحديد الميزات الأكثر صلة باستخدام تقنيات مثل تحليل الارتباط وأهمية الميزة *
Advertisements
5. اختيار النموذج وتقييمه
:أهميته
يعد اختيار النموذج الصحيح ومقاييس التقييم أمرًا بالغ الأهمية لنجاح المشروع *
نماذج ومقاييس مختلفة قد تكون مناسبة لأنواع مختلفة من المشاكل *
:الخطوات
تجربة مختلف الخوارزميات والتقنيات *
استخدام التحقق المتبادل لتقييم أداء النموذج *
(F1 اختر مقاييس التقييم التي تتوافق مع أهداف العمل (على سبيل المثال الدقة والاستدعاء ودرجة *
6. التدريب النموذجي والضبط
:أهميته
تدريب النموذج باستخدام المعلمات الفائقة الأمثل يضمن أفضل أداء ممكن *
الضبط السليم يتجنب الإفراط في التجهيز أو التجهيز غير المناسب *
:الخطوات
تقسيم البيانات إلى مجموعات التدريب والتحقق من الصحة *
استخدم تقنيات مثل بحث الشبكة أو البحث العشوائي لضبط المعلمة الفائقة *
مراقبة أداء التدريب والتحقق من الصحة للكشف عن التجاوز *
7. نشر النموذج ومراقبته
:أهميته
يتيح نشر النموذج في بيئة الإنتاج إمكانية تقديم تنبؤات في الوقت الفعلي *
تضمن المراقبة المستمرة بقاء النموذج دقيقًا وملائمًا بمرور الوقت *
:الخطوات
استخدم الأدوات والأطر التي تدعم النشر القابل للتطوير *
Kubernetes و Docker على سبيل المثال *
تنفيذ المراقبة لتتبع أداء النموذج واكتشاف الانحراف *
قم بإعداد حلقة ردود الفعل لتحديث النموذج ببيانات جديدة
8. التوثيق والاستنساخ
:أهميته
يضمن التوثيق إمكانية فهم المشروع وتكراره من قبل الآخرين *
تعد إمكانية التكرار أمرًا ضروريًا للتحقق من صحة النتائج والحفاظ على الثقة في النتائج *
:الخطوات
توثيق سير العمل بأكمله بما في ذلك مصادر البيانات وخطوات المعالجة المسبقة ومعلمات النموذج *
لتتبع التغييرات في التعليمات البرمجية والبيانات Git استخدم أنظمة التحكم في الإصدار مثل *
مشاركة التعليمات البرمجية والبيانات والنتائج بتنسيق منظم لتسهيل التعاون *
خاتمة
يساعد الالتزام بأفضل الممارسات في علم البيانات على ضمان تنفيذ المشاريع بكفاءة وموثوقية النتائج وقابلة للتنفيذ، فمن خلال تحديد المشكلة بوضوح وجمع البيانات وتنظيفها بدقة وإجراء تحليل شامل للبيانات الاستكشافية والميزات الهندسية بفعالية واختيار النماذج وتقييمها بشكل مناسب وتدريب النماذج وضبطها بعناية ونشر النماذج ومراقبتها بدقة والحفاظ على التوثيق الشامل يمكن لعلماء البيانات إثبات جدارتهم في عملهم وبالتالي المساهمة برؤى قيمة لمنظماتهم
ChatGPT, a large language model developed by OpenAI, is an incredibly versatile tool that can assist data scientists in various stages of their workflow. Here’s a comprehensive guide on how you can leverage ChatGPT in your data science projects.
1. Data Understanding and Exploration
a. Data Interpretation:
Data Summarization: ChatGPT can provide summaries of data by reading descriptions, metadata, and sample data points. This is useful for understanding the context of the data.
Statistical Insights: It can offer insights into basic statistics like mean, median, mode, standard deviation, and more, helping you understand the distribution of your data.
b. Exploratory Data Analysis (EDA):
EDA Techniques: ChatGPT can suggest various EDA techniques such as plotting histograms, scatter plots, box plots, and more.
Insights from Visualizations: Although ChatGPT cannot create visualizations directly, it can suggest tools and libraries (like Matplotlib, Seaborn, Plotly) and interpret the results of your plots.
2. Data Cleaning and Preprocessing
a. Identifying Issues:
Missing Values: ChatGPT can provide strategies to handle missing values, such as imputation techniques or removal strategies.
Outliers Detection: It can suggest methods to detect and handle outliers, such as Z-score, IQR, or visualization techniques.
b. Data Transformation:
Normalization and Scaling: It can explain when and why to apply normalization or scaling and how to use libraries like Scikit-learn for these transformations.
Encoding Categorical Variables: ChatGPT can guide on different encoding techniques like one-hot encoding, label encoding, and when to use each.
3. Feature Engineering
a. Creating New Features:
Feature Creation: ChatGPT can help brainstorm new features that might be useful for your model, such as polynomial features, interaction terms, or domain-specific features.
Dimensionality Reduction: It can explain techniques like PCA (Principal Component Analysis) and t-SNE for reducing the number of features while retaining essential information.
b. Feature Selection:
Selection Techniques: ChatGPT can suggest techniques for feature selection like Recursive Feature Elimination (RFE), feature importance from tree-based models, or correlation analysis.
Interpreting Results: It can help interpret the results of feature selection techniques to decide which features to retain.
Advertisements
4. Model Building and Evaluation
a. Choosing Algorithms:
Algorithm Selection: ChatGPT can recommend different machine learning algorithms based on the problem type (regression, classification, clustering) and dataset characteristics.
Hyperparameter Tuning: It can provide insights into hyperparameters for various algorithms and suggest strategies like Grid Search, Random Search, or Bayesian Optimization for tuning them.
b. Model Training and Evaluation:
Training Models: ChatGPT can guide through the process of training models using popular libraries like Scikit-learn, TensorFlow, and PyTorch.
Evaluation Metrics: It can explain different evaluation metrics (accuracy, precision, recall, F1 score, ROC-AUC for classification; RMSE, MAE for regression) and help interpret the results.
5. Model Deployment and Monitoring
a. Deployment Strategies:
Deployment Options: ChatGPT can suggest various deployment options, such as Flask/Django for creating APIs, using cloud services like AWS, Google Cloud, or Azure for scalable deployments.
Containerization: It can explain the benefits of using Docker for containerizing your models and provide guidance on creating Docker images.
b. Monitoring and Maintenance:
Monitoring Tools: ChatGPT can recommend tools for monitoring model performance in production, such as Prometheus, Grafana, or custom logging solutions.
Model Retraining: It can suggest strategies for maintaining and retraining models as new data comes in, ensuring your models remain accurate over time.
6. Automating Workflows
a. Pipeline Automation:
Pipeline Tools: ChatGPT can introduce tools for automating data pipelines like Apache Airflow, Prefect, or Luigi.
CI/CD for ML: It can explain the concepts of Continuous Integration and Continuous Deployment (CI/CD) in the context of machine learning and suggest tools like Jenkins, GitHub Actions, or GitLab CI.
7. Learning and Staying Updated
a. Educational Resources:
Books and Courses: ChatGPT can recommend books, online courses, and tutorials to help you deepen your knowledge in data science.
Research Papers: It can provide summaries and explanations of recent research papers in machine learning and data science.
b. Community and Forums:
Discussion Platforms: ChatGPT can point you to forums and communities like Stack Overflow, Reddit (r/datascience, r/machinelearning), and specialized Slack or Discord groups for networking and problem-solving.
Conclusion
ChatGPT is a powerful assistant for data scientists, offering support across the entire data science lifecycle. From initial data exploration to deploying and monitoring models, ChatGPT can provide valuable insights, suggest tools and techniques, and help troubleshoot issues, making your data science projects more efficient and effective. By integrating ChatGPT into your workflow, you can enhance your productivity, stay updated with the latest advancements, and ultimately, deliver better data-driven solutions.
Advertisements
كعالِم بيانات: دليل تفصيلي ChatGPT استخدام
Advertisements
OpenAI وهو نموذج لغة كبير تم تطويره بواسطة ChatGPT يعد
أداة متعددة الاستخدامات بشكل لا يصدق يمكنها مساعدة علماء البيانات في مراحل مختلفة من سير عملهم
ChatGPT فيما يلي دليل شامل حول كيفية الاستفادة من
:في مشاريع علوم البيانات الخاصة بك
1. فهم البيانات واستكشافها
:أ. تفسير البيانات
ChatGPT تلخيص البيانات: يمكن لـ
تقديم ملخصات للبيانات من خلال قراءة الأوصاف والبيانات الوصفية ونقاط البيانات النموذجية وهذا مفيد لفهم سياق البيانات
الرؤى الإحصائية: يمكنها تقديم رؤى حول الإحصائيات الأساسية مثل المتوسط والوسيط والمنوال والانحراف المعياري والمزيد مما يساعدك على فهم توزيع بياناتك
: (EDA)ب. تحليل البيانات الاستكشافية
: EDA تقنيات
EDA اقتراح تقنيات ChatGPT يمكن لـ
المختلفة مثل رسم الرسوم البيانية والمؤامرات المبعثرة والمؤامرات المربعة والمزيد
ChatGPT رؤى من التصورات: على الرغم من أن
لا يمكنه إنشاء تصورات مباشرة إلا أنه يمكنه اقتراح أدوات
وتفسير نتائج مخططاتك (Matplotlib وSeaborn وPlotly :ومكتبات (مثل
2. تنظيف البيانات ومعالجتها مسبقاً
:أ. تحديد المشكلات
ChatGPT القيم المفقودة: يمكن لـ
توفير إستراتيجيات للتعامل مع القيم المفقودة مثل تقنيات التضمين أو إستراتيجيات الإزالة
اكتشاف القيم المتطرفة: يمكن أن يقترح طرقًا لاكتشاف القيم المتطرفة والتعامل معها
أو تقنيات التصور Z-score أو IQR مثل
:ب. تحويل البيانات
التطبيع والقياس: يمكن أن يوضح متى ولماذا يتم تطبيق التطبيع أو القياس وكيفية استخدام
لهذه التحولات Scikit-learn :مكتبات مثل
ChatGPT تشفير المتغيرات الفئوية: يمكن لـ
توجيه تقنيات التشفير المختلفة مثل التشفير الفردي وترميز الملصقات ومتى يتم استخدام كل منها
3. هندسة الميزات
: أ. إنشاء ميزات جديدة
ChatGPT إنشاء الميزات: يمكن أن يساعد
في تبادل الأفكار حول الميزات الجديدة التي قد تكون مفيدة لنموذجك مثل الميزات متعددة الحدود أو مصطلحات التفاعل أو الميزات الخاصة بالمجال
(تحليل المكونات الرئيسية) PCA تقليل الأبعاد: يمكنه شرح تقنيات مثل
لتقليل عدد الميزات مع الاحتفاظ بالمعلومات الأساسية t-SNE و
: ب. اختيار ميزة
ChatGPT تقنيات الاختيار: يمكن لـ
(RFE) اقتراح تقنيات لاختيار الميزات مثل إزالة الميزات المتكررة
أو أهمية الميزة من النماذج المستندة إلى الشجرة أو تحليل الارتباط
تفسير النتائج: يمكن أن يساعد في تفسير نتائج تقنيات اختيار الميزات لتحديد الميزات التي سيتم الاحتفاظ بها
Advertisements
4. بناء النموذج والتقييم
: أ. اختيار الخوارزميات
ChatGPT اختيار الخوارزمية: يمكن لـ
أن يوصي بخوارزميات مختلفة للتعلم الآلي بناءً على نوع المشكلة (الانحدار، التصنيف، التجميع) وخصائص مجموعة البيانات
ضبط المعلمات الفائقة: يمكنه تقديم رؤى حول المعلمات الفائقة للخوارزميات المختلفة واقتراح
لضبطها Grid Search أو Random Search أو Bayesian Optimization إستراتيجيات مثل
: ب. نموذج التدريب والتقييم
ChatGPT نماذج التدريب: يمكن لـ
توجيه عملية نماذج التدريب باستخدام المكتبات الشائعة
Scikit-learn وTensorFlow وPyTorch : مثل
مقاييس التقييم: يمكن أن تشرح مقاييس التقييم المختلفة
للتصنيف ROC-AUC ،F1 الدقة، الدقة، الاستدعاء، درجة
للانحدار MAE ،RMSE
وتساعد في تفسير النتائج
5. نشر النموذج ومراقبته
:أ. استراتيجيات النشر
ChatGPT خيارات النشر: يمكن لـ
Flask/Django اقتراح خيارات نشر متنوعة مثل
لإنشاء واجهات برمجة التطبيقات
Azure أو Google Cloud أو AWS واستخدام الخدمات السحابية مثل
لعمليات نشر قابلة للتطوير
Docker النقل بالحاويات: يمكنه شرح فوائد استخدام
Docker لوضع نماذجك في حاويات وتقديم إرشادات حول إنشاء صور
:ب. المراقبة والصيانة
ChatGPT أدوات المراقبة: يمكن لـ
أن يوصي بأدوات لمراقبة أداء النموذج في الإنتاج
أو حلول التسجيل المخصصة Grafana أو Prometheus مثل
إعادة تدريب النماذج: يمكنها اقتراح إستراتيجيات لصيانة النماذج وإعادة تدريبها عند وصول بيانات جديدة مما يضمن بقاء نماذجك دقيقة بمرور الوقت
6. أتمتة سير العمل
: أ. أتمتة خطوط الأنابيب
ChatGPT أدوات خطوط الأنابيب: يمكن لـ
تقديم أدوات لأتمتة خطوط أنابيب البيانات
Apache Airflow أو Prefect أو Luigi مثل
:ML لـ CI/CD
(CI/CD) يمكنه شرح مفاهيم التكامل المستمر والنشر المستمر
في سياق التعلم الآلي واقتراح أدوات مثل
Jenkins أو GitHub Actions أو GitLab CI
7. التعلم والبقاء على اطلاع دائم
: أ. أحداث غير متوقعة
ChatGPT الكتب والدورات: يمكن لـ
أن يوصي بالكتب والدورات التدريبية عبر الإنترنت والبرامج التعليمية لمساعدتك على تعميق معرفتك في علم البيانات
الأوراق البحثية: يمكن أن توفر ملخصات وشروحات للأوراق البحثية الحديثة في التعلم الآلي وعلوم البيانات
: ب. المجتمع والمنتديات
ChatGPT منصات المناقشة: يمكن لـ
توجيهك إلى المنتديات والمجتمعات مثل
Stack Overflow و Reddit (r/datascience و r/machinelearning)
المتخصصة للتواصل وحل المشكلات Slack أو Discord ومجموعات
خاتمة
مساعداً قوياً لعلماء البيانات ChatGPT يعد
حيث يقدم الدعم عبر دورة حياة علم البيانات بأكملها بدءاً من استكشاف البيانات الأولية وحتى نشر النماذج ومراقبتها
ChatGPT يمكن لـ
توفير رؤى قيمة واقتراح الأدوات والتقنيات والمساعدة في استكشاف المشكلات وإصلاحها مما يجعل مشاريع علوم البيانات الخاصة بك أكثر كفاءة وفعالية
ChatGPT من خلال دمج
في سير عملك يمكنك تحسين إنتاجيتك والبقاء على اطلاع بأحدث التطورات وفي النهاية تقديم حلول أفضل تعتمد على البيانات
The demand for data analysts has been on a steady rise as businesses increasingly rely on data-driven decision-making. Freelance data analysts, in particular, are in high demand due to the flexibility they offer to companies. Becoming a freelance data analyst in 2024 requires a combination of technical skills, business acumen, and effective self-marketing. This essay provides a detailed guide on how to embark on this career path, covering essential skills, tools, strategies for finding clients, and tips for building a successful freelance business.
Essential Skills for Freelance Data Analysts
Technical Proficiency
Statistical Analysis: Understanding statistical methods and being able to apply them is crucial. Tools like R and Python (with libraries such as Pandas, NumPy, and SciPy) are essential.
Data Visualization: Proficiency in data visualization tools like Tableau, Power BI, or D3.js helps in presenting data insights effectively.
Database Management: Knowledge of SQL and NoSQL databases for data extraction, manipulation, and management is fundamental.
Machine Learning: Familiarity with machine learning techniques and tools like Scikit-Learn, TensorFlow, or PyTorch can set you apart.
Soft Skills
Communication: The ability to explain complex data insights in a simple and concise manner to stakeholders who may not have a technical background.
Problem-Solving: Critical thinking and the ability to solve problems creatively using data.
Time Management: Managing multiple projects and meeting deadlines is crucial in a freelance setting.
Business Acumen
Understanding Business Context: Knowing how to apply data insights to solve business problems and drive decisions.
Marketing and Sales: Skills in self-promotion, networking, and sales to attract and retain clients.
Building Your Skill Set
Education and Certification
Formal Education: A degree in data science, statistics, computer science, or a related field can be beneficial.
Online Courses and Bootcamps: Platforms like Coursera, Udacity, and DataCamp offer specialized courses and certifications in data analysis and related fields.
Certifications: Consider certifications like Microsoft Certified: Data Analyst Associate, Google Data Analytics Professional Certificate, or IBM Data Science Professional Certificate.
Practical Experience
Projects: Work on personal or open-source projects to build a portfolio.
Internships: Gain practical experience through internships or volunteer work.
Setting Up as a Freelance Data Analyst
Creating a Portfolio
Showcase Your Work: Include detailed case studies of projects you’ve worked on, highlighting your role, the problem, your approach, and the results.
GitHub and Personal Website: Host your code and projects on GitHub, and create a professional website to showcase your portfolio and provide a point of contact for potential clients.
Tools and Resources
Freelance Platforms: Register on platforms like Upwork, Freelancer, and Toptal to find freelance opportunities.
Professional Network: Leverage LinkedIn and professional associations like the Data Science Association to network and find job leads.
Advertisements
Finding Clients and Building a Client Base
Marketing Your Services
Online Presence: Maintain an active online presence through a blog, LinkedIn posts, and participating in forums and online communities related to data science.
Content Marketing: Publish articles, case studies, and tutorials to demonstrate your expertise and attract potential clients.
Networking
Professional Events: Attend industry conferences, webinars, and local meetups to network with potential clients and other professionals.
Referrals: Ask satisfied clients for referrals and testimonials to build credibility and attract new clients.
Pricing Your Services
Research Market Rates: Understand the going rates for freelance data analysts in your region and set competitive prices.
Flexible Pricing Models: Offer different pricing models, such as hourly rates, project-based pricing, or retainer agreements, to suit the needs of various clients.
Managing Your Freelance Business
Project Management
Tools: Use project management tools like Trello, Asana, or Jira to organize tasks, manage deadlines, and collaborate with clients.
Communication: Maintain clear and regular communication with clients to manage expectations and ensure project alignment.
Financial Management
Accounting Software: Utilize accounting software like QuickBooks or FreshBooks to track income, expenses, and manage invoices.
Tax Planning: Understand your tax obligations as a freelancer and set aside money for taxes. Consider hiring an accountant to manage your finances.
Staying Updated and Continuous Learning
Ongoing Education
Workshops and Seminars: Attend workshops and seminars to stay updated on the latest trends and technologies in data analysis.
Online Courses: Continuously update your skills through online courses and certifications.
Community Involvement
Join Data Science Communities: Participate in data science communities, both online and offline, to stay connected with industry developments and network with peers.
Conclusion
Becoming a successful freelance data analyst in 2024 involves a mix of technical skills, business savvy, and effective self-marketing. By continuously improving your skills, building a strong portfolio, and networking effectively, you can establish a thriving freelance career in data analysis. The flexibility and variety that come with freelancing can offer a rewarding career path for those willing to invest the effort and adapt to the evolving demands of the data industry.
Advertisements
كيف تصبح محلل بيانات مستقل في عام 2024
Advertisements
مقدمة
يتزايد الطلب على محللي البيانات بشكل متصاعد حيث تعتمد الشركات بشكل متزايد على عملية صنع القرار المستندة إلى البيانات يزداد الطلب على محللي البيانات المستقلين على وجه الخصوص بسبب المرونة التي يقدمونها للشركات يتطلب أن تصبح محلل بيانات مستقلاً في عام 2024 مزيجاً من المهارات التقنية والفطنة التجارية والتسويق الذاتي الفعال يقدم هذا المقال دليلاً مفصلاً حول كيفية الشروع في هذا المسار الوظيفي ويغطي المهارات الأساسية والأدوات والاستراتيجيات للعثور على العملاء ونصائح لبناء مشروع تجاري مستقل ناجح
المهارات الأساسية لمحللي البيانات المستقلين
1. الكفاءة الفنية
التحليل الإحصائي: يعد فهم الأساليب الإحصائية والقدرة على تطبيقها أمرًا بالغ الأهمية *
Pythonو R تعتبر أدوات مثل
ضرورية SciPy و NumPy و Pandas :مع مكتبات مثل
تصور البيانات: يساعد الكفاءة في أدوات تصور البيانات *
في تقديم رؤى البيانات بشكل فعال D3js أو Power BI أو Tableau مثل
:إدارة قواعد البيانات *
NoSQL و SQL تعد المعرفة بقواعد بيانات
لاستخراج البيانات ومعالجتها وإدارتها أمرًا أساسيًا
أبحاث أسعار السوق: فهم الأسعار الحالية لمحللي البيانات المستقلين في منطقتك وتحديد الأسعار التنافسية
نماذج تسعير مرنة: تقديم نماذج تسعير مختلفة مثل الأسعار بالساعة أو التسعير على أساس المشروع أو اتفاقيات التجنيب لتناسب احتياجات العملاء المختلفين
إدارة عملك المستقل
1. إدارة المشاريع
الأدوات: استخدم أدوات إدارة المشروع
Trello أو Asana أو Jira :مثل
لتنظيم المهام وإدارة المواعيد النهائية والتعاون مع العملاء
التواصل: حافظ على تواصل واضح ومنتظم مع العملاء لإدارة التوقعات وضمان توافق المشروع
2. الإدارة المالية
برامج المحاسبة: استخدم برامج المحاسبة مثل
لتتبع الدخل والنفقات وإدارة الفواتير QuickBooks أو FreshBooks
التخطيط الضريبي: افهم التزاماتك الضريبية كموظف مستقل وقم بتخصيص الأموال للضرائب فكر في تعيين محاسب لإدارة أموالك
مواكبة التطور والتعلم المستمر
1. التعليم المستمر
ورش العمل والندوات: حضور ورش العمل والندوات للبقاء على اطلاع دائم بأحدث الاتجاهات والتقنيات في تحليل البيانات
الدورات التدريبية عبر الإنترنت: قم بتحديث مهاراتك باستمرار من خلال الدورات والشهادات عبر الإنترنت
2. المشاركة المجتمعية
انضم إلى مجتمعات علوم البيانات: شارك في مجتمعات علوم البيانات عبر الإنترنت للبقاء على اتصال بتطورات الصناعة والتواصل مع أقرانك
خاتمة
يتطلب أن تصبح محلل بيانات مستقلًا ناجحًا في عام 2024 مزيجًا من المهارات التقنية والدهاء التجاري والتسويق الذاتي الفعال من خلال التحسين المستمر لمهاراتك وبناء محفظة قوية والتواصل بشكل فعال يمكنك إنشاء مهنة مستقلة مزدهرة في تحليل البيانات يمكن للمرونة والتنوع اللذين يأتيان مع العمل الحر أن يوفرا مساراً وظيفياً مجزياً للراغبين في استثمار الجهد والتكيف مع المتطلبات المتطورة لصناعة البيانات
With the advent of advanced AI models like ChatGPT, opportunities to create revenue streams through AI-driven solutions have expanded significantly. This guide provides detailed strategies and 20 practical examples of how you can leverage ChatGPT to generate income.
1. Content Creation
Example: Blog Writing Service
Description: Use ChatGPT to generate high-quality blog posts for clients. Topics can range from technology and finance to lifestyle and travel.
Implementation: Market your services on platforms like Upwork or Fiverr. Offer custom content creation based on client specifications.
Example: E-book Writing
Description: Create e-books on popular topics by using ChatGPT to generate content.
Implementation: Write comprehensive guides or stories, format them professionally, and sell on Amazon Kindle Direct Publishing.
2. Customer Support
Example: Automated Customer Support for E-commerce
Description: Implement ChatGPT to handle customer inquiries, complaints, and FAQs.
Implementation: Integrate ChatGPT with an e-commerce platform to provide 24/7 customer support, reducing the need for a large support team.
3. Educational Services
Example: Online Tutoring
Description: Offer tutoring services in various subjects, with ChatGPT providing explanations and answering student questions.
Implementation: Use platforms like Teachable or Udemy to create courses supplemented by ChatGPT-powered Q&A sessions.
Example: Language Learning
Description: Develop a language learning app where ChatGPT acts as a conversation partner to help users practice new languages.
Implementation: Create an interactive app and charge a subscription fee for premium features.
4. Virtual Assistance
Example: Personal Assistant Services
Description: Provide virtual personal assistant services to busy professionals, using ChatGPT to manage schedules, emails, and reminders.
Implementation: Market the service to small business owners and executives who need help with day-to-day tasks.
5. Social Media Management
Example: Social Media Content Creation
Description: Use ChatGPT to create engaging social media posts for businesses and influencers.
Implementation: Offer packages for different types of content (e.g., daily posts, weekly blogs) and manage accounts for clients.
6. Market Research
Example: Competitive Analysis Reports
Description: Generate detailed competitive analysis reports using ChatGPT to gather and summarize market data.
Implementation: Sell these reports to businesses looking to gain an edge over their competitors.
7. Creative Writing
Example: Script Writing for YouTube Creators
Description: Write scripts for YouTube videos on various topics.
Implementation: Partner with YouTube creators to provide them with engaging scripts and help them grow their channels.
Example: Ghostwriting
Description: Offer ghostwriting services for books, articles, or speeches.
Implementation: Market yourself to authors, executives, and public figures who need high-quality written material.
8. Consulting Services
Example: Business Strategy Consulting
Description: Use ChatGPT to provide insights and strategic advice for businesses.
Implementation: Offer consulting services in areas like marketing, operations, and growth strategies.
9. Entertainment
Example: Interactive Storytelling
Description: Create interactive stories or games where users can choose their adventure paths.
Implementation: Develop a web or mobile app and charge for premium content or in-game purchases.
10. Healthcare Support
Example: Symptom Checker
Description: Develop a chatbot that helps users understand potential health issues based on their symptoms.
Implementation: Partner with healthcare providers to offer this as a service on their websites.
Advertisements
11. Financial Advice
Example: Personal Finance Management
Description: Create a chatbot that provides personalized financial advice and budgeting tips.
Implementation: Offer this as a subscription-based service to individuals seeking to improve their financial health.
12. Real Estate
Example: Property Recommendations
Description: Develop a chatbot that helps users find real estate properties based on their preferences.
Implementation: Partner with real estate agencies to integrate this tool into their websites.
13. Travel Planning
Example: Travel Itinerary Planning
Description: Offer personalized travel itineraries and recommendations.
Implementation: Create a subscription-based app or service for frequent travelers.
14. Event Planning
Example: Event Coordination
Description: Use ChatGPT to assist in planning and coordinating events, from weddings to corporate functions.
Implementation: Market your services to event planners and companies.
15. Legal Advice
Example: Legal Document Drafting
Description: Provide services for drafting legal documents, such as contracts and wills.
Implementation: Offer a subscription service or charge per document.
16. Technical Support
Example: IT Support Chatbot
Description: Develop a chatbot that provides technical support for software and hardware issues.
Implementation: Partner with IT service companies to offer this as a value-added service.
17. Gaming
Example: Game Development Assistance
Description: Use ChatGPT to generate game dialogues, storylines, and character backgrounds.
Implementation: Partner with game developers to streamline the creative process.
18. Nonprofit Organizations
Example: Fundraising Campaigns
Description: Use ChatGPT to create compelling fundraising content and manage donor communications.
Implementation: Offer your services to nonprofits to help them increase their fundraising efforts.
19. Research Assistance
Example: Academic Research Support
Description: Assist researchers by summarizing articles, generating hypotheses, and organizing references.
Implementation: Market your services to academic institutions and independent researchers.
20. Personal Coaching
Example: Life Coaching
Description: Provide life coaching sessions with ChatGPT offering advice and motivational content.
Implementation: Create a subscription-based service or offer one-on-one sessions.
By leveraging the capabilities of ChatGPT, you can tap into a wide range of industries and create multiple revenue streams. The key is to identify areas where ChatGPT can add value and then market your services effectively.
Advertisements
إلى آلة لكسب المال ChatGPT كيف تحول
Advertisements
ChatGPT مع ظهور نماذج الذكاء الاصطناعي المتقدمة مثل
توسعت فرص إنشاء تدفقات الإيرادات من خلال الحلول المعتمدة على الذكاء الاصطناعي بشكل كبير يقدم هذا الدليل إستراتيجيات مفصلة وعشرون مثالاً عملياً لكيفية الاستفادة من هذه المنصة لتوليد الدخل
1. إنشاء المحتوى
مثال: خدمة كتابة المدونات
ChatGPT الوصف: استخدم
لإنشاء منشورات مدونة عالية الجودة للعملاء يمكن أن تتراوح المواضيع من التكنولوجيا والتمويل إلى نمط الحياة والسفر
Fiverr أو Upwork التنفيذ: قم بتسويق خدماتك على منصات مثل
تقديم إنشاء محتوى مخصص بناءً على مواصفات العميل
مثال: كتابة الكتب الإلكترونية الوصف: قم بإنشاء كتب إلكترونية حول موضوعات شائعة باستخدام هذه المنصة لإنشاء المحتوى
التنفيذ: كتابة أدلة أو قصص شاملة، وتنسيقها بشكل احترافي
Amazon Kindle Direct Publishing وبيعها على
2. دعم العملاء
مثال: دعم العملاء الآلي للتجارة الإلكترونية
للتعامل مع استفسارات العملاء والشكاوى والأسئلة الشائعة ChatGPT الوصف: تنفيذ
ChatGPT التنفيذ: دمج
مع منصة التجارة الإلكترونية لتوفير دعم العملاء على مدار الساعة طوال أيام الأسبوع، مما يقلل الحاجة إلى فريق دعم كبير
3. الخدمات التعليمية
مثال: التدريس عبر الإنترنت
الوصف: تقديم خدمات التدريس في مواضيع مختلفة
التوضيحات والإجابة على أسئلة الطلاب ChatGPT مع توفير
Udemy أو Teachable التنفيذ: استخدم منصات مثل
ChatGPT لإنشاء دورات مكملة بجلسات أسئلة وأجوبة مدعومة بـ
مثال: تعلم اللغة
ChatGPT الوصف: تطوير تطبيق لتعلم اللغة حيث يعمل
كشريك محادثة لمساعدة المستخدمين على ممارسة لغات جديدة
التنفيذ: إنشاء تطبيق تفاعلي وتحصيل رسوم اشتراك مقابل الميزات المتميزة
4. المساعدة الافتراضية
مثال: خدمات المساعد الشخصي
الوصف: توفير خدمات المساعد الشخصي الافتراضي للمحترفين المشغولين، باستخدام هذه المنصة لإدارة الجداول الزمنية ورسائل البريد الإلكتروني والتذكيرات
التنفيذ: تسويق الخدمة لأصحاب الأعمال الصغيرة والمديرين التنفيذيين الذين يحتاجون إلى المساعدة في المهام اليومية
5. إدارة وسائل التواصل الاجتماعي
مثال: إنشاء محتوى الوسائط الاجتماعية
الوصف: استخدم هذه المنصة لإنشاء منشورات جذابة على وسائل التواصل الاجتماعي للشركات والمؤثرين
التنفيذ: تقديم حزم لأنواع مختلفة من المحتوى (مثل المنشورات اليومية والمدونات الأسبوعية) وإدارة الحسابات للعملاء
6. أبحاث السوق
مثال: تقارير التحليل التنافسي
الوصف: إنشاء تقارير تحليلية تنافسية مفصلة باستخدام هذه المنصة لجمع بيانات السوق وتلخيصها
التنفيذ: بيع هذه التقارير للشركات التي تتطلع إلى التفوق على منافسيها
7. الكتابة الإبداعية
مثال: كتابة السيناريو لمنشئي المحتوى على يوتيوب
الوصف: كتابة نصوص برمجية لمقاطع فيديو يوتيوب حول مواضيع مختلفة
التنفيذ: الشراكة مع منشئي المحتوى على يوتيوب لتزويدهم بنصوص جذابة ومساعدتهم على تنمية قنواتهم
على سبيل المثال: كتابة خفية
الوصف: تقديم خدمات الكتابة الخفية للكتب أو المقالات أو الخطب
التنفيذ: قم بتسويق نفسك للمؤلفين والمديرين التنفيذيين والشخصيات العامة الذين يحتاجون إلى مواد مكتوبة عالية الجودة
8. الخدمات الاستشارية
مثال: استشارات استراتيجية الأعمال
الوصف: استخدم هذه المنصة لتقديم رؤى ونصائح استراتيجية للشركات
التنفيذ: تقديم خدمات استشارية في مجالات مثل التسويق والعمليات واستراتيجيات النمو
9. الترفيه
مثال: رواية القصص التفاعلية
الوصف: قم بإنشاء قصص أو ألعاب تفاعلية حيث يمكن للمستخدمين اختيار مسارات المغامرة الخاصة بهم
التنفيذ: تطوير تطبيق ويب أو هاتف محمول وتحصيل رسوم مقابل المحتوى المتميز أو عمليات الشراء داخل اللعبة
Advertisements
10. دعم الرعاية الصحية
مثال: مدقق الأعراض
الوصف: تطوير برنامج دردشة آلي يساعد المستخدمين على فهم المشكلات الصحية المحتملة بناءً على الأعراض التي يعانون منها
التنفيذ: الشراكة مع مقدمي الرعاية الصحية لتقديم ذلك كخدمة على مواقعهم الإلكترونية
11. الاستشارة المالية
مثال: إدارة التمويل الشخصي
يقدم نصائح مالية مخصصة ونصائح حول الميزانية chatbot الوصف: قم بإنشاء
التنفيذ: تقديم هذه الخدمة كخدمة قائمة على الاشتراك للأفراد الذين يسعون إلى تحسين صحتهم المالية
12. العقارات
مثال: توصيات الملكية
chatbot الوصف: تطوير برنامج
يساعد المستخدمين في العثور على العقارات بناءً على تفضيلاتهم
التنفيذ: الشراكة مع الوكالات العقارية لدمج هذه الأداة في مواقعها الإلكترونية
13. تخطيط السفر
مثال: تخطيط خط سير الرحلة
الوصف: عرض مسارات السفر والتوصيات الشخصية
التنفيذ: إنشاء تطبيق أو خدمة قائمة على الاشتراك للمسافرين الدائمين
14. تخطيط الأحداث
مثال: تنسيق الأحداث
الوصف: استخدم هذه المنصة للمساعدة في تخطيط وتنسيق الأحداث، من حفلات الزفاف إلى وظائف الشركة
The pursuit of financial success often conjures images of high-stakes investments, volatile markets, and daring entrepreneurial ventures. However, making substantial money does not necessarily require assuming significant risks. Through a strategic approach that emphasizes steady growth, diversification, and informed decision-making, one can achieve financial prosperity while minimizing exposure to potential losses. Here are some effective strategies to make big money without taking big risks:
1. Diversification of Investments
Diversification is a foundational principle in risk management. By spreading investments across various asset classes such as stocks, bonds, real estate, and mutual funds, you can mitigate the impact of a poor performance in any single investment. For instance, while stocks can offer high returns, they can be volatile. Balancing them with bonds, which are generally more stable, can help smooth out overall portfolio performance. Additionally, investing in real estate provides a tangible asset that can generate rental income and appreciate over time.
2. Long-Term Investment in Index Funds and ETFs
Index funds and exchange-traded funds (ETFs) are investment vehicles that track the performance of a market index. These funds offer broad market exposure, low operating expenses, and a passive management style. Investing in index funds and ETFs can yield significant returns over the long term due to the compounding effect. They are considered less risky than individual stocks because they represent a diversified portfolio of companies. This strategy reduces the likelihood of substantial losses, as the overall market tends to grow over time despite short-term fluctuations.
3. Building a Strong Emergency Fund
An emergency fund acts as a financial safety net, providing liquidity in times of unexpected expenses or economic downturns. By having three to six months’ worth of living expenses saved in a readily accessible account, you can avoid liquidating investments at inopportune times. This financial cushion allows you to stay the course with your long-term investment strategy, thereby minimizing risk and enhancing the potential for growth.
4. Investing in Personal Development and Skills
Investing in yourself is one of the most reliable ways to increase your earning potential without taking significant financial risks. Pursuing higher education, obtaining professional certifications, and developing new skills can lead to better job opportunities and higher income. The knowledge and skills acquired can provide a competitive edge in the job market and open doors to lucrative career advancements or entrepreneurial ventures with a strong foundation.
Advertisements
5. Starting a Side Business
Starting a side business can be a low-risk way to increase your income. Unlike quitting your job to start a business, a side hustle allows you to maintain a steady paycheck while exploring entrepreneurial interests. The key is to start small, leverage existing skills, and gradually scale up. With careful planning and minimal upfront investment, a side business can grow into a significant source of income without exposing you to the financial risks associated with full-time entrepreneurship.
6. Real Estate Investment through Rental Properties
Real estate is a tangible asset that historically appreciates over time. Investing in rental properties can provide a steady stream of passive income while the property itself increases in value. By carefully selecting properties in growing areas and maintaining them well, you can minimize risks. Additionally, utilizing property management services can help handle the operational aspects, reducing the time and effort required from the investor.
7. Leveraging Tax-Advantaged Accounts
Maximizing contributions to tax-advantaged accounts such as 401(k)s, IRAs, and Health Savings Accounts (HSAs) can enhance your financial growth with minimal risk. These accounts offer tax benefits that can significantly boost your savings over time. For instance, contributions to a traditional 401(k) are tax-deductible, reducing your taxable income, while the investments grow tax-deferred until withdrawal.
8. Staying Informed and Adapting to Market Conditions
Staying informed about market trends, economic conditions, and investment opportunities is crucial for making prudent financial decisions. Continuous education and a proactive approach allow you to adjust your strategies in response to changing conditions, thereby minimizing risks. Utilizing financial advisors and leveraging technology for investment management can also provide valuable insights and enhance decision-making.
Conclusion
Making big money without taking big risks is not only possible but also a prudent approach to financial success. By diversifying investments, focusing on long-term growth, building a strong financial foundation, investing in personal development, and making informed decisions, you can achieve substantial financial gains with minimized risk. The key lies in strategic planning, continuous learning, and disciplined execution, ensuring that your financial journey is both prosperous and secure.
Advertisements
هل يمكنك كسب الكثير من المال بدون مخاطرة
Advertisements
غالباً ما يستحضر السعي لتحقيق النجاح المالي صوراً لاستثمارات عالية المخاطر وأسواق متقلبة ومشاريع ريادية جريئة، ومع ذلك فإن تحقيق قدر كبير من المال لا يتطلب بالضرورة تحمل مخاطر كبيرة، ومن خلال نهج استراتيجي يؤكد على النمو المطرد والتنويع واتخاذ القرارات المستنيرة يستطيع المرء تحقيق الرخاء المالي مع تقليل التعرض للخسائر المحتملة
: فيما يلي بعض الاستراتيجيات الفعالة لكسب أموال كبيرة دون المخاطرة الكبيرة
1. تنويع الاستثمارات
التنويع هو مبدأ أساسي في إدارة المخاطر من خلال توزيع الاستثمارات عبر فئات الأصول المختلفة مثل الأسهم والسندات والعقارات وصناديق الاستثمار المشتركة يمكنك التخفيف من تأثير الأداء الضعيف في أي استثمار واحد، على سبيل المثال في حين أن الأسهم يمكن أن تقدم عوائد عالية إلا أنها يمكن أن تكون متقلبة، إن موازنتها بالسندات التي تكون أكثر استقراراً بشكل عام يمكن أن تساعد في تحسين أداء المحفظة بشكل عام بالإضافة إلى ذلك يوفر الاستثمار في العقارات أصولاً ملموسة يمكن أن تولد دخلاً من الإيجار وترتفع قيمته بمرور الوقت
2. الاستثمار طويل الأجل في صناديق المؤشرات وصناديق الاستثمار المتداولة
(ETFs) صناديق المؤشرات والصناديق المتداولة في البورصة
هي أدوات استثمارية تتتبع أداء مؤشر السوق، توفر هذه الصناديق تعرضاً واسعاً للسوق ونفقات تشغيل منخفضة وأسلوب إدارة سلبي يمكن أن يحقق الاستثمار في صناديق المؤشرات وصناديق الاستثمار المتداولة عوائد كبيرة على المدى الطويل بسبب التأثير المركب وتعتبر أقل خطورة من الأسهم الفردية لأنها تمثل محفظة متنوعة من الشركات تقلل هذه الإستراتيجية من احتمالية حدوث خسائر كبيرة حيث يميل السوق بشكل عام إلى النمو بمرور الوقت على الرغم من التقلبات قصيرة المدى
3. بناء صندوق طوارئ قوي
يعمل صندوق الطوارئ كشبكة أمان مالي حيث يوفر السيولة في أوقات النفقات غير المتوقعة أو الركود الاقتصادي من خلال توفير نفقات المعيشة لمدة ثلاثة إلى ستة أشهر في حساب يسهل الوصول إليه يمكنك تجنب تصفية الاستثمارات في الأوقات غير المناسبة تسمح لك هذه الوسادة المالية بمواصلة استراتيجيتك الاستثمارية طويلة المدى وبالتالي تقليل المخاطر وتعزيز إمكانات النمو
4. الاستثمار في التنمية الشخصية والمهارات
يعد الاستثمار في نفسك أحد أكثر الطرق الموثوقة لزيادة أرباحك المحتملة دون تحمل مخاطر مالية كبيرة، إن متابعة التعليم العالي والحصول على الشهادات المهنية وتطوير مهارات جديدة يمكن أن يؤدي إلى فرص عمل أفضل وزيادة الدخل المعرفة والمهارات المكتسبة، يمكن أن توفر ميزة تنافسية في سوق العمل وتفتح الأبواب أمام التقدم الوظيفي المربح أو المشاريع الريادية ذات أساس قوي
Advertisements
5. بدء عمل جانبي
يمكن أن يكون بدء عمل جانبي طريقة منخفضة المخاطر لزيادة دخلك على عكس ترك وظيفتك لبدء مشروع تجاري، يسمح لك العمل الجانبي بالحفاظ على راتب ثابت أثناء استكشاف اهتماماتك في مجال ريادة الأعمال المفتاح هو أن تبدأ صغيراً وتستفيد من المهارات الموجودة ثم تتوسع تدريجياً من خلال التخطيط الدقيق والحد الأدنى من الاستثمار المسبق يمكن أن ينمو العمل الجانبي ليصبح مصدراً مهماً للدخل دون تعريضك للمخاطر المالية المرتبطة بريادة الأعمال بدوام كامل
6. الاستثمار العقاري من خلال تأجير العقارات
العقارات هي أحد الأصول الملموسة التي تقدر تاريخياً، مع مرور الوقت يمكن أن يوفر الاستثمار في العقارات المستأجرة دفقاً ثابتاً من الدخل السلبي بينما تزداد قيمة العقار نفسه ومن خلال اختيار العقارات بعناية في مناطق النمو وصيانتها بشكل جيد يمكنك تقليل المخاطر بالإضافة إلى ذلك فإن الاستفادة من خدمات إدارة الممتلكات يمكن أن تساعد في التعامل مع الجوانب التشغيلية مما يقلل من الوقت والجهد المطلوب من المستثمر
7. الاستفادة من الحسابات ذات المزايا الضريبية
إن تعظيم المساهمات في الحسابات ذات المزايا الضريبية مثل
401(k)s, IRAs, and and Health Savings Accounts (HSAs)
يمكن أن يعزز نموك المالي بأقل قدر من المخاطر تقدم هذه الحسابات مزايا ضريبية يمكنها تعزيز مدخراتك بشكل كبير بمرور الوقت
401(k) على سبيل المثال المساهمات في
التقليدية تكون معفاة من الضرائب مما يقلل من دخلك الخاضع للضريبة في حين أن الاستثمارات تنمو مع تأجيل الضرائب حتى الانسحاب
8. البقاء على اطلاع والتكيف مع ظروف السوق
يعد البقاء على اطلاع باتجاهات السوق والظروف الاقتصادية وفرص الاستثمار أمراً بالغ الأهمية لاتخاذ قرارات مالية حكيمة، يسمح لك التعليم المستمر والنهج الاستباقي بتعديل استراتيجياتك استجابة للظروف المتغيرة وبالتالي تقليل المخاطر، إن الاستفادة من المستشارين الماليين والاستفادة من التكنولوجيا لإدارة الاستثمار يمكن أن توفر أيضاً رؤى قيمة وتعزز عملية صنع القرار
خاتمة
إن كسب أموال كبيرة دون المخاطرة الكبيرة ليس أمراً ممكناً فحسب، بل هو أيضاً نهج حكيم لتحقيق النجاح المالي ومن خلال تنويع الاستثمارات والتركيز على النمو طويل الأجل وبناء أساس مالي قوي والاستثمار في التنمية الشخصية واتخاذ قرارات مستنيرة يمكنك تحقيق مكاسب مالية كبيرة مع تقليل المخاطر إلى الحد الأدنى ويكمن المفتاح في التخطيط الاستراتيجي والتعلم المستمر والتنفيذ المنضبط مما يضمن أن تكون رحلتك المالية مزدهرة وآمنة
Power Query is a powerful tool for manipulating and cleaning data, and it offers various features for managing dates. Here are some essential steps and techniques for handling date formats:
1. Data Type Conversion:
When you import data into Power Query, ensure that date columns have the correct data type. Sometimes Power Query’s automatic detection gets it wrong, so verify that all columns are correctly recognized as dates.
To change a specific column into a date format, you have several options:
Click the data type icon in the column header and select “Date.”
Select the column, then click Transform > Data Type > Date from the Ribbon.
Right-click on the column header and choose Change Type > Date.
You can also modify the applied data type directly in the M code to ensure proper recognition.
2. Extracting Additional Information:
From a date column, you can extract various details using Power Query functions. These include:
Year
Days in the month
Week of the year
Day name
Day of the year
Advertisements
3. Custom Formatting:
To format dates in a specific way, you can use the Date.ToText function. It accepts a date value and optional parameters for formatting and culture settings.
Combine Date.ToText with custom format strings to achieve precise and varied date formats in a single line of code.
4. Common Formats:
If you’re dealing with common formats like DD/MM/YYYY, MM/DD/YYYY, or YYYY-MM-DD, you can easily change the format:
Import your data into Power Query.
Select the date column to be formatted.
Right-click and choose Change Type > Date.
Select the desired predefined format (e.g., DD/MM/YYYY) and click OK.
Remember, mastering date formatting in Power Query can significantly simplify your data processing tasks. Feel free to explore more advanced scenarios and create custom formats tailored to your needs!
Advertisements
تنسيق التاريخ والوقت Power Query
Advertisements
أداة قوية لمعالجة البيانات وتنظيفها Power Query يعد
كما يوفر ميزات متنوعة لإدارة التواريخ فيما يلي بعض الخطوات والتقنيات الأساسية للتعامل مع تنسيقات التاريخ
تحويل نوع البيانات
Power Query عند استيراد البيانات إلى
تأكد من أن أعمدة التاريخ تحتوي على نوع البيانات الصحيح
Power Query ففي بعض الأحيان يحدث خطأ في الاكتشاف التلقائي لـ
لذا تحقق من أنه تم التعرف على جميع الأعمدة بشكل صحيح كتواريخ
لتغيير عمود معين إلى تنسيق تاريخ لديك عدة خيارات
Date في رأس العمود وحدد Data Type انقر على أيقونة
Date < Data Type< Transform حدد العمود ثم انقر فوق
Date < Change Type انقر بزر الماوس الأيمن على رأس العمود واختر
M يمكنك أيضًا تعديل نوع البيانات المطبق مباشرة في كود
لضمان التعرف الصحيح
استخراج معلومات إضافية
من عمود التاريخ يمكنك استخراج تفاصيل متنوعة
:وتشمل Power Query باستخدام وظائف
Year
Days in the month
Week of the year
Day name
Day of the year
Advertisements
:التنسيق المخصص
لتنسيق التواريخ بطريقة معينة
Date.ToText يمكنك استخدام الدالة
يقبل قيمة التاريخ والمعلمات الاختيارية لإعدادات التنسيق والثقافة
Date.ToText قم بدمج
مع سلاسل التنسيق المخصصة لتحقيق تنسيقات تاريخ دقيقة ومتنوعة في سطر واحد من التعليمات البرمجية
التنسيقات الشائعة
إذا كنت تتعامل مع تنسيقات شائعة مثل
DD/MM/YYYY
MM/DD/YYYY
YYYY-MM-DD
فيمكنك تغيير التنسيق بسهولة
Power Query قم باستيراد بياناتك إلى
حدد عمود التاريخ المراد تنسيقه
Date< Change Type انقر بزر الماوس الأيمن واختر
حدد التنسيق المحدد مسبقًا المطلوب
DD/MM/YYYY : على سبيل المثال
OK وانقر فوق
Power Query تذكر أن إتقان تنسيق التاريخ في
يمكن أن يبسط مهام معالجة البيانات بشكل كبير لا تتردد في استكشاف تقنيات أكثر تقدماً وإنشاء تنسيقات مخصصة تناسب احتياجاتك
The realms of physics and data science may seem distinct at first glance, but they share a common foundation in analytical thinking, problem-solving, and quantitative analysis. Physicists are trained to decipher complex systems, model phenomena, and handle large datasets—all skills that are incredibly valuable in data science. As the demand for data scientists continues to grow across various industries, many physicists find themselves well-positioned to make a career transition into this exciting field. This guide outlines the steps and considerations for physicists aiming to transition into data science.
Understanding the Overlap
Physics and data science intersect in several key areas:
Mathematical Modeling: Both fields require strong skills in mathematics and the ability to build models that represent real-world phenomena.
Statistical Analysis: Understanding statistical methods is crucial for analyzing experimental data in physics and for extracting insights from datasets in data science.
Computational Skills: Proficiency in programming and computational tools is essential in both domains for solving complex problems.
Key Skills to Develop
While physicists already possess a strong analytical background, transitioning to data science requires acquiring specific skills and knowledge:
Programming Languages: Proficiency in programming languages such as Python and R is essential. These languages are widely used for data analysis, machine learning, and data visualization.
Data Manipulation and Cleaning: Learning how to preprocess and clean data using libraries like pandas (Python) or dplyr (R) is fundamental.
Machine Learning: Familiarity with machine learning algorithms and frameworks (e.g., scikit-learn, TensorFlow, PyTorch) is crucial for developing predictive models.
Data Visualization: Tools like Matplotlib, Seaborn, and Tableau help in visualizing data and presenting findings clearly.
Database Management: Understanding SQL and NoSQL databases is important for efficiently storing and retrieving large datasets.
Advertisements
Educational Pathways
Several educational resources can help bridge the gap between physics and data science:
Online Courses and Certifications: Platforms like Coursera, edX, and Udacity offer specialized courses and certifications in data science, machine learning, and artificial intelligence.
Bootcamps: Intensive data science bootcamps provide hands-on experience and often include career support and networking opportunities.
Graduate Programs: Enrolling in a master’s program in data science or a related field can provide a structured learning environment and credential.
Gaining Practical Experience
Hands-on experience is critical for a successful transition:
Projects: Undertake personal or open-source projects that involve data analysis, machine learning, and data visualization to build a portfolio.
Internships: Seek internships or part-time roles in data science to gain industry experience and apply theoretical knowledge to real-world problems.
Competitions: Participate in data science competitions on platforms like Kaggle to solve challenging problems and improve your skills.
Networking and Community Engagement
Building a professional network and engaging with the data science community can provide valuable insights and opportunities:
Meetups and Conferences: Attend data science meetups, workshops, and conferences to learn from experts and network with professionals in the field.
Online Communities: Join online forums and communities such as Reddit’s r/datascience, Stack Overflow, and LinkedIn groups to seek advice, share knowledge, and stay updated with industry trends.
Mentorship: Find a mentor in the data science field who can provide guidance, feedback, and support throughout your transition.
Tailoring Your Resume and Job Search
Effectively marketing your skills and experience is crucial when applying for data science roles:
Highlight Transferable Skills: Emphasize your analytical skills, problem-solving abilities, and experience with data in your resume and cover letter.
Showcase Projects and Experience: Include relevant projects, internships, and any practical experience that demonstrates your proficiency in data science tools and techniques.
Tailor Applications: Customize your resume and cover letter for each job application to align with the specific requirements and keywords of the job posting.
Conclusion
Transitioning from physics to data science is a feasible and rewarding career move that leverages your existing analytical skills and quantitative background. By developing new competencies in programming, machine learning, and data analysis, gaining practical experience, and actively engaging with the data science community, you can successfully navigate this transition and thrive in the burgeoning field of data science. The journey requires dedication, continuous learning, and a proactive approach to building your skillset and professional network, but the potential for growth and impact in this dynamic field is substantial.
Advertisements
دليل شامل حول كيفية الانتقال من الفيزياء إلى علم البيانات
Advertisements
مقدمة
قد يبدو مجالا الفيزياء وعلوم البيانات مختلفين للوهلة الأولى لكنهما يشتركان في أساس مشترك في التفكير التحليلي وحل المشكلات والتحليل الكمي، يتم تدريب الفيزيائيين على فك رموز الأنظمة المعقدة ونمذجة الظواهر والتعامل مع مجموعات البيانات الكبيرة – وكلها مهارات ذات قيمة كبيرة في علم البيانات، مع استمرار نمو الطلب على علماء البيانات عبر مختلف الصناعات يجد العديد من الفيزيائيين أنفسهم في وضع جيد يسمح لهم بالانتقال الوظيفي إلى هذا المجال المثير
يوضح هذا الدليل الخطوات والاعتبارات الخاصة بالفيزيائيين الذين يهدفون إلى الانتقال إلى علم البيانات
فهم التداخل
تتقاطع الفيزياء وعلوم البيانات في عدة مجالات رئيسية
النمذجة الرياضية: يتطلب كلا المجالين مهارات قوية في الرياضيات والقدرة على بناء نماذج تمثل ظواهر العالم الحقيقي
التحليل الإحصائي: يعد فهم الأساليب الإحصائية أمرًا بالغ الأهمية لتحليل البيانات التجريبية في الفيزياء واستخلاص الأفكار من مجموعات البيانات في علم البيانات
المهارات الحسابية: الكفاءة في البرمجة والأدوات الحسابية أمر ضروري في كلا المجالين لحل المشاكل المعقدة
المهارات الأساسية للتطوير
في حين أن الفيزيائيين يمتلكون بالفعل خلفية تحليلية قوية فإن الانتقال إلى علم البيانات يتطلب اكتساب مهارات ومعرفة محددة
1. لغات البرمجة
أمراً ضرورياً Rيعد إتقان لغات البرمجة مثل بايثون و
تُستخدم هذه اللغات على نطاق واسع لتحليل البيانات والتعلم الآلي وتصور البيانات
2. معالجة البيانات وتنظيفها
يعد تعلم كيفية المعالجة المسبقة للبيانات وتنظيفها باستخدام مكتبات مثل
أمراً أساسياً dplyr (R) أو pandas (Python)
3. التعلم الآلي
يعد الإلمام بخوارزميات وأطر التعلم الآلي
PyTorchو TensorFlow و scikit-learn على سبيل المثال
أمراً بالغ الأهمية لتطوير النماذج التنبؤية
4. تصور البيانات
Tableau و Seaborn و Matplotlib تساعد أدوات مثل
في تصور البيانات وعرض النتائج بوضوح
5. إدارة قواعد البيانات
NoSQL و SQL يعد فهم قواعد بيانات
أمراً مهماً لتخزين مجموعات البيانات الكبيرة واسترجاعها بكفاءة
Advertisements
المسارات التعليمية
يمكن أن تساعد العديد من الموارد التعليمية في سد الفجوة بين الفيزياء وعلوم البيانات
• الدورات والشهادات عبر الإنترنت
Udacity و edX و Coursera تقدم منصات مثل
دورات وشهادات متخصصة في علوم البيانات والتعلم الآلي والذكاء الاصطناعي
• المعسكرات التدريبية
توفر المعسكرات التدريبية المكثفة لعلوم البيانات خبرة عملية وغالباً ما تتضمن دعماً وظيفياً وفرصاً للتواصل
• برامج الدراسات العليا
يمكن أن يوفر التسجيل في برنامج الماجستير في علوم البيانات أو في مجال ذي صلة بيئة تعليمية منظمة وبيانات اعتماد
اكتساب الخبرة العملية
تعتبر الخبرة العملية أمرًا بالغ الأهمية لتحقيق انتقال ناجح
المشاريع: تنفيذ مشاريع شخصية أو مفتوحة المصدر تتضمن تحليل البيانات والتعلم الآلي وتصور البيانات لبناء محفظة
التدريب الداخلي: ابحث عن التدريب الداخلي أو الأدوار بدوام جزئي في علوم البيانات لاكتساب خبرة الصناعة وتطبيق المعرفة النظرية على مشاكل العالم الحقيقي
:المسابقات
Kaggle شارك في مسابقات علوم البيانات على منصات مثل
لحل المشكلات الصعبة وتحسين مهاراتك
التواصل والمشاركة المجتمعية
:يمكن أن يوفر بناء شبكة احترافية والتفاعل مع مجتمع علوم البيانات رؤى وفرصاً قيمة
اللقاءات والمؤتمرات: احضر اجتماعات وورش عمل ومؤتمرات علوم البيانات للتعلم من الخبراء والتواصل مع المتخصصين في هذا المجال
المجتمعات عبر الإنترنت: انضم إلى المنتديات والمجتمعات عبر الإنترنت
LinkedIn و Stack Overflow و r/datascience مثل مجموعات
لطلب المشورة ومشاركة المعرفة والبقاء على اطلاع دائم باتجاهات الصناعة
• الإرشاد: ابحث عن مرشد في مجال علم البيانات يمكنه تقديم التوجيه والتعليقات والدعم طوال فترة انتقالك
تصميم سيرتك الذاتية والبحث عن وظيفة
يعد تسويق مهاراتك وخبراتك بشكل فعال أمراً بالغ الأهمية عند التقدم لأدوار علم البيانات:
تسليط الضوء على المهارات القابلة للتحويل: أكد على مهاراتك التحليلية وقدراتك على حل المشكلات وخبرتك في التعامل مع البيانات الموجودة في سيرتك الذاتية وخطاب التقديم
عرض المشاريع والخبرات: قم بتضمين المشاريع ذات الصلة والتدريب الداخلي وأي خبرة عملية توضح كفاءتك في أدوات وتقنيات علم البيانات
تخصيص التطبيقات: قم بتخصيص سيرتك الذاتية وخطاب تقديمي لكل طلب وظيفة لتتوافق مع المتطلبات المحددة والكلمات الرئيسية لنشر الوظيفة
خاتمة
يعد الانتقال من الفيزياء إلى علم البيانات خطوة مهنية مجدية ومجزية تعمل على تعزيز مهاراتك التحليلية الحالية وخلفيتك الكمية. من خلال تطوير كفاءات جديدة في البرمجة والتعلم الآلي وتحليل البيانات واكتساب الخبرة العملية والمشاركة بنشاط مع مجتمع علوم البيانات يمكنك التنقل بنجاح في هذا التحول والازدهار في مجال علم البيانات المزدهر، تتطلب الرحلة التفاني والتعلم المستمر ونهج استباقي لبناء مجموعة المهارات الخاصة بك والشبكة المهنية، ولكن إمكانات النمو والتأثير في هذا المجال الديناميكي كبيرة
In the contemporary world, artificial intelligence (AI) is revolutionizing how we approach self-improvement. Leveraging AI, we can enhance various aspects of our daily lives, from mental health and productivity to learning new skills and maintaining physical wellness. Here are ten AI tools that can significantly contribute to your self-improvement journey when used daily.
1.Headspace: Meditation and Mindfulness
Meditation is a powerful tool for reducing stress and enhancing mental clarity. Headspace offers guided meditation sessions, mindfulness exercises, and sleep aids. This AI-driven app personalizes your meditation experience, helping you to cultivate mindfulness and manage stress effectively. Daily use can lead to improved focus, emotional health, and overall well-being.
2.Grammarly: Writing Enhancement
Effective communication is key in both personal and professional settings. Grammarly uses AI to enhance your writing by checking for grammar mistakes, suggesting style improvements, and even adjusting tone. Whether you’re drafting emails, reports, or creative pieces, Grammarly ensures your writing is clear, correct, and engaging, making it an indispensable tool for daily use.
3.MyFitnessPal: Nutrition and Fitness Tracking
Maintaining a healthy lifestyle requires awareness of your dietary and exercise habits. MyFitnessPal offers a comprehensive platform for tracking your caloric intake and physical activity. With its extensive food database and personalized fitness plans, this AI tool helps you set and achieve your health goals. Daily logging can lead to better nutrition choices and improved physical fitness.
4.Lumosity: Brain Training
Cognitive health is as important as physical health. Lumosity provides a suite of brain games designed to improve memory, attention, and problem-solving skills. By engaging in these personalized training programs daily, you can enhance your cognitive abilities, making it easier to handle complex tasks and improve mental agility.
5.Duolingo: Language Learning
Learning a new language opens up a world of opportunities and enhances cognitive skills. Duolingo uses AI to create interactive, gamified lessons tailored to your learning pace. Daily practice with Duolingo can significantly improve your language skills, aiding in better communication and cultural understanding.
6.RescueTime: Productivity and Time Management
In an age of digital distractions, managing time effectively is crucial. RescueTime tracks how you spend your time on digital devices, providing detailed reports and insights. By identifying productivity patterns and potential distractions, RescueTime helps you optimize your time, ensuring you stay focused on your goals.
Advertisements
7.Habitica: Habit Building
Building and maintaining good habits can be challenging. Habitica turns habit formation into a game, rewarding you for completing tasks and establishing positive routines. This AI-driven tool makes habit-building fun and engaging, encouraging you to stick to your goals through daily tracking and rewards.
8.Elevate: Cognitive Skills Improvement
Elevate offers personalized brain training programs aimed at improving critical thinking, language skills, and math proficiency. With daily exercises designed to challenge and engage, Elevate helps you sharpen your cognitive skills, making it an excellent tool for continuous self-improvement.
9.Noom: Weight Loss and Health Coaching
Achieving and maintaining a healthy weight involves more than just diet and exercise. Noom provides personalized coaching, meal plans, and psychological tips to foster sustainable habit changes. Using Noom daily can guide you towards healthier lifestyle choices, promoting long-term weight management and well-being.
10.Sleep Cycle: Sleep Tracking and Improvement
Quality sleep is fundamental to overall health. Sleep Cycle analyzes your sleep patterns and uses a smart alarm clock to wake you during your lightest sleep phase, ensuring you feel refreshed. By reviewing your sleep data and making necessary adjustments, Sleep Cycle helps improve sleep quality, contributing to better daily functioning.
Integrating AI Tools into Your Daily Routine
To maximize the benefits of these AI tools, integrate them seamlessly into your daily routine:
Morning: Start with a Headspace meditation session and review your Sleep Cycle data.
Throughout the Day: Use MyFitnessPal to track meals and exercise. Engage with Duolingo during breaks to practice a new language.
Work and Study: Improve your writing with Grammarly and monitor productivity with RescueTime. Take short cognitive breaks with Lumosity or Elevate.
Evening: Reflect on your habits and tasks with Habitica and plan for the next day. Wind down with a sleep story or guided meditation from Headspace.
By incorporating these AI tools into your daily life, you can significantly enhance your mental, physical, and cognitive well-being. The personalized and adaptive nature of AI ensures that your self-improvement journey is tailored to your unique needs and goals, making the process more effective and enjoyable.
Advertisements
عشر أدوات للذكاء الاصطناعي لتطوير الذات بشكل يومي
Advertisements
في العالم المعاصر يُحدث الذكاء الاصطناعي ثورة في كيفية تعاملنا مع تطوير الذات ومن خلال الاستفادة من الذكاء الاصطناعي يمكننا تعزيز جوانب مختلفة من حياتنا اليومية بدءاً من الصحة العقلية والإنتاجية وحتى تعلم مهارات جديدة والحفاظ على الصحة البدنية
فيما يلي عشر أدوات للذكاء الاصطناعي يمكن أن تساهم بشكل كبير في رحلة التحسين الذاتي عند استخدامها يومياً
1. Headspace: التأمل واليقظة
التأمل هو أداة قوية لتقليل التوتر وتعزيز الوضوح العقلي، تقدم هذه المنصة جلسات تأمل موجهة وتمارين اليقظة الذهنية وأدوات مساعدة على النوم، يقوم هذا التطبيق المعتمد على الذكاء الاصطناعي بتخصيص تجربة التأمل الخاصة بك مما يساعدك على تنمية الوعي الذهني وإدارة التوتر بشكل فعال، يمكن أن يؤدي الاستخدام اليومي إلى تحسين التركيز والصحة العاطفية والرفاهية العامة
2. Grammarly: تحسين الكتابة
التواصل الفعال هو المفتاح في كل من الإعدادات الشخصية والمهنية تستخدم هذه الأداة الذكاء الاصطناعي لتحسين كتابتك عن طريق التحقق من الأخطاء النحوية واقتراح تحسينات في الأسلوب وحتى ضبط النغمة، سواء كنت تقوم بصياغة رسائل البريد الإلكتروني أو التقارير أو المقالات الإبداعية فإن هذه الأداة تضمن أن كتابتك واضحة وصحيحة وجذابة، مما يجعلها أداة لا غنى عنها للاستخدام اليومي
3. MyFitnessPal: تتبع التغذية واللياقة البدنية
يتطلب الحفاظ على نمط حياة صحي الوعي بعاداتك الغذائية وممارسة الرياضة، تقدم هذه الأداة منصة شاملة لتتبع السعرات الحرارية التي تتناولها والنشاط البدني بفضل قاعدة بياناتها الغذائية الشاملة وخطط اللياقة البدنية المخصصة، تساعدك أداة الذكاء الاصطناعي هذه على تحديد أهدافك الصحية وتحقيقها كما ويمكن أن يؤدي التسجيل اليومي إلى خيارات غذائية أفضل وتحسين اللياقة البدنية
4. Lumosity: تدريب الدماغ
الصحة المعرفية لا تقل أهمية عن الصحة البدنية، إذ توفر هذه الأداة مجموعة من ألعاب الدماغ المصممة لتحسين الذاكرة والانتباه ومهارات حل المشكلات، فمن خلال المشاركة في هذه البرامج التدريبية المخصصة يوميًا يمكنك تعزيز قدراتك المعرفية مما يسهل التعامل مع المهام المعقدة وتحسين خفة الحركة العقلية
5. Duolingo: تعلم اللغة
إن تعلم لغة جديدة يفتح عالمًا من الفرص ويعزز المهارات المعرفية، تستخدم هذه الأداة الذكاء الاصطناعي لإنشاء دروس تفاعلية ومُصممة خصيصًا لتناسب وتيرة التعلم الخاصة بك كما ويمكن أن تؤدي الممارسة اليومية مع هذه الأداة إلى تحسين مهاراتك اللغوية بشكل كبير مما يساعد في تحسين التواصل والفهم الثقافي
6. RescueTime: الإنتاجية وإدارة الوقت
في عصر التشتيت الرقمي تعد إدارة الوقت بفعالية أمرًا بالغ الأهمية ومن هذا المنطلق ترشدك هذه الأداة كيف تقضي وقتك على الأجهزة الرقمية وتقدم تقارير ورؤى مفصلة من خلال تحديد أنماط الإنتاجية والانحرافات المحتملة، تساعدك هذه الأداة على تحسين وقتك، مما يضمن استمرار التركيز على أهدافك
Advertisements
7. Habitica: بناء العادة
قد يكون بناء العادات الجيدة والحفاظ عليها أمراً صعباً، يقوم هذا التطبيق بتحويل تكوين العادات إلى لعبة بحيث يكافئك على إكمال المهام وإنشاء إجراءات روتينية إيجابية، تجعل هذه الأداة المبنية على الذكاء الاصطناعي عملية بناء العادات أمراً ممتعاً وجذاباً وتشجعك على الالتزام بأهدافك من خلال التتبع اليومي والمكافآت
8. Elevate: تحسين المهارات المعرفية
تقدم هذه الأداة برامج تدريب عقلية مخصصة تهدف إلى تحسين التفكير النقدي والمهارات اللغوية وإتقان الرياضيات، فمن خلال التمارين اليومية المصممة للتحدي والمشاركة تساعدك هذه الأداة على صقل مهاراتك المعرفية مما يجعله أداة ممتازة للتحسين الذاتي المستمر
9. Noom: فقدان الوزن والتدريب الصحي
يتطلب تحقيق الوزن الصحي والحفاظ عليه أكثر من مجرد اتباع نظام غذائي وممارسة الرياضة، توفر هذه الأداة تدريباً شخصياً وخطط وجبات ونصائح نفسية لتعزيز التغييرات المستدامة في العادات، يمكن أن يرشدك استخدام هذه الأداة يومياً نحو خيارات نمط حياة أكثر صحة ويعزز إدارة الوزن على المدى الطويل والرفاهية
10. Sleep Cycle: تتبع النوم وتحسينه
النوم الجيد أمر أساسي للصحة العامة وعليه يقوم هذا التطبيق بتحليل أنماط نومك ويستخدم منبهاً ذكياً لإيقاظك خلال أخف مرحلة نوم لديك مما يضمن لك الشعور بالانتعاش، من خلال مراجعة بيانات نومك وإجراء التعديلات اللازمة تساعد هذه المنصة على تحسين جودة النوم، مما يساهم في تحسين الأداء اليومي
دمج أدوات الذكاء الاصطناعي في روتينك اليومي
لتحقيق أقصى قدر من فوائد أدوات الذكاء الاصطناعي هذه قم بدمجها بسلاسة في روتينك اليومي
وراجع بيانات دورة نومك Headspace الصباح: ابدأ بجلسة تأمل في
لتتبع وجبات الطعام وممارسة الرياضة MyFitnessPal طوال اليوم: استخدم
أثناء فترات الراحة لممارسة لغة جديدة Duolingo تفاعل مع
Grammarly العمل والدراسة: قم بتحسين كتابتك باستخدام
RescueTime وراقب الإنتاجية باستخدام
Lumosity أو Elevate خذ فترات راحة إدراكية قصيرة باستخدام
Habitica المساء: فكر في عاداتك ومهامك مع
Headspace وخطط لليوم التالي واستمتع بالاسترخاء مع قصة النوم أو التأمل الموجه من
ومن خلال دمج أدوات الذكاء الاصطناعي هذه في حياتك اليومية يمكنك تحسين صحتك العقلية والجسدية والمعرفية بشكل كبير، تضمن الطبيعة الشخصية والتكيفية للذكاء الاصطناعي أن تكون رحلتك للتحسين الذاتي مصممة وفقًا لاحتياجاتك وأهدافك الفريدة مما يجعل العملية أكثر فعالية ومتعة
Breaking into the field of data analysis can be both exciting and daunting. However, with the right approach, even beginners can achieve a significant hourly wage. Here’s a step-by-step guide on how you can make $30 per hour as a beginner data analyst.
1. Acquire Essential Skills
a. Online Courses
Start by taking online courses that cover the basics of data analysis. Websites like Coursera, Udemy, and edX offer courses on:
Excel: Learn data manipulation and basic analysis.
SQL: Master database querying.
Python: Gain proficiency in data manipulation libraries like pandas and NumPy.
Data Visualization: Get comfortable with tools like Tableau or Power BI.
b. Practical Projects
Engage in hands-on projects to apply what you’ve learned. Many courses offer project-based learning which is invaluable. Build a portfolio of your work to showcase your skills.
2. Gain Practical Experience
a. Personal Projects
Work on personal projects that interest you. These could involve analyzing public datasets available on platforms like Kaggle. Document your process and results to add to your portfolio.
b. Volunteer Work
Offer your skills to non-profits or small businesses that might not have the budget for professional data analysis. This provides real-world experience and builds your resume.
3. Build a Strong Online Presence
a. LinkedIn
Create a professional LinkedIn profile highlighting your skills, projects, and any volunteer work. Join LinkedIn groups related to data analysis to network with professionals in the field.
b. Portfolio Website
Consider building a personal website to host your portfolio. Include detailed descriptions of your projects, methodologies, and the tools you used.
Advertisements
4. Networking
a. Attend Meetups and Webinars
Join local meetups and online webinars related to data analysis. Networking can lead to job opportunities and valuable insights from experienced professionals.
b. Online Communities
Participate in online communities like Reddit’s r/datascience, Stack Overflow, and Data Science Central. Engage in discussions, ask questions, and share your knowledge.
5. Freelance Platforms
a. Create Profiles
Sign up on freelance platforms like Upwork, Freelancer, and Fiverr. Create a detailed profile showcasing your skills, experience, and projects.
b. Start Small
Initially, accept lower-paying jobs to build your reputation. Focus on delivering high-quality work and getting positive reviews.
c. Gradually Increase Rates
As you gain experience and positive feedback, gradually increase your rates. Highlight your successful projects and satisfied clients to justify your rate increase.
6. Job Hunting
a. Tailor Applications
Apply to entry-level data analyst positions on job boards like Indeed, Glassdoor, and DataJobs. Tailor your resume and cover letter to each job, emphasizing your skills and relevant experience.
b. Internships
Consider applying for internships that offer practical experience and the possibility of full-time employment. Internships can be a stepping stone to higher-paying roles.
7. Continuous Learning
a. Stay Updated
The field of data analysis is always evolving. Stay updated with the latest tools and techniques by following industry blogs, taking advanced courses, and participating in webinars.
b. Certifications
Consider obtaining certifications from recognized institutions. Certifications in SQL, Python, or data visualization tools can add credibility to your profile.
Conclusion
Making $30 per hour as a beginner data analyst is achievable with dedication and strategic planning. By acquiring essential skills, gaining practical experience, building a strong online presence, networking, leveraging freelance platforms, and continuously learning, you can position yourself for success in this field. Remember, persistence and a willingness to learn are key to advancing your career and achieving your financial goals.
Advertisements
كمبتدئ في تحليل البيانات، كيف يمكنك ربح 30 دولار في الساعة؟
Advertisements
يمكن أن يكون اقتحام مجال تحليل البيانات أمراً مثيراً ولكنه لا يخلو من المصاعب، ومع ذلك ومع اتباع النهج الصحيح حتى المبتدئين يمكنهم تحقيق دخل جيد بالساعة، فيما يلي دليل خطوة بخطوة حول كيفية ربح 30 دولار في الساعة كمحلل بيانات مبتدئ
1. اكتساب المهارات الأساسية
أ. دروس مباشرة على الإنترنت
ابدأ بأخذ دورات عبر الإنترنت تغطي أساسيات تحليل البيانات
Udemy و edX و Coursera تقدم مواقع الويب مثل
دورات تدريبية حول
تعلم معالجة البيانات والتحليل الأساسي :Excel
الاستعلام عن قاعدة البيانات الرئيسية :SQL
NumPyو pandas اكتسب الكفاءة في مكتبات معالجة البيانات مثل :Python
Tableau أو Power BI تصور البيانات: تمتع بالمرونة في العمل مع أدوات مثل
ب. مشاريع عملية
تقدم العديد من الدورات التعلم القائم على المشاريع وهو أمر لا يقدر بثمن، شارك في مشاريع عملية لتطبيق ما تعلمته ثم أنشئ مجموعة من أعمالك لعرض مهاراتك
2. اكتساب الخبرة العملية
أ. المشاريع الشخصية
العمل على المشاريع الشخصية التي تهمك وقد يتضمن ذلك تحليل مجموعات البيانات العامة
Kaggle المتاحة على منصات مثل
قم بتوثيق عمليتك ونتائجك لإضافتها إلى محفظتك
ب. عمل تطوعي
اعرض مهاراتك على المؤسسات غير الربحية أو الشركات الصغيرة التي قد لا تمتلك الميزانية اللازمة لتحليل البيانات الاحترافية وهذا يوفر تجربة واقعية ويبني سيرتك الذاتية
3. بناء حضور قوي على الإنترنت
: LinkedIn -أ
LinkedIn أنشئ ملفًا شخصيًا احترافيًا على
يسلط الضوء على مهاراتك ومشاريعك وأي عمل تطوعي، انضم إلى المجموعات المتعلقة بتحليل البيانات للتواصل مع المتخصصين في هذا المجال
Portfolio ب. موقع
فكر في إنشاء موقع ويب شخصي لاستضافة محفظتك وقم بتضمين أوصاف تفصيلية لمشاريعك ومنهجياتك والأدوات التي استخدمتها
4. الشبكات
أ. حضور اللقاءات والندوات عبر الإنترنت
انضم إلى اللقاءات المحلية والندوات عبر الإنترنت المتعلقة بتحليل البيانات، يمكن أن يؤدي التواصل إلى فرص عمل ورؤى قيمة من محترفين ذوي خبرة
ب. مجتمعات الانترنت
شارك في المجتمعات عبر الإنترنت مثل
Reddit’s r/datascience, Stack Overflow, and Data Science Central
شارك في المناقشات وطرح الأسئلة وشارك معرفتك
Advertisements
5. منصات العمل الحر
أ. إنشاء ملفات التعريف
Upwork وFreelancer وFiverr قم بالتسجيل في منصات العمل الحر مثل
قم بإنشاء ملف تعريفي مفصل يعرض مهاراتك وخبراتك ومشاريعك
ب. بداية متواضعة الأجر عالية الأداء
في البداية اقبل الوظائف ذات الأجور المنخفضة لبناء سمعتك، ركز على تقديم عمل عالي الجودة والحصول على تقييمات إيجابية
ج. زيادة الأسعار تدريجيا
ومع اكتسابك الخبرة والتعليقات الإيجابية، قم بزيادة أسعارك تدريجياً وقم بتسليط الضوء على مشاريعك الناجحة وعملائك الراضين لتبرير زيادة السعر
6. البحث عن وظيفة
Tailor Applications -أ
تقدم بطلبك إلى مناصب محللي البيانات المبتدئين في لوحات الوظائف مثل
Indeed و Glassdoor وDataJobs
صمم سيرتك الذاتية وتقرير تعريفي لكل وظيفة مع التركيز على مهاراتك وخبراتك ذات الصلة
ب. التدريب
فكر في التقدم للحصول على دورات تدريبية توفر خبرة عملية وإمكانية العمل بدوام كامل، يمكن أن يكون التدريب الداخلي بمثابة نقطة انطلاق للأدوار ذات الأجور الأعلى
7. التعلم المستمر
: أ. ابق على اطلاع
مجال تحليل البيانات يتطور دائماً، ابق على اطلاع بأحدث الأدوات والتقنيات من خلال متابعة مدونات الصناعة والحصول على دورات متقدمة والمشاركة في الندوات عبر الإنترنت
ب. الشهادات
فكر في الحصول على شهادات من مؤسسات معترف بها
SQL أو Python يمكن أن تضيف الشهادات في
أو أدوات تصور البيانات مصداقية إلى ملفك الشخصي
خاتمة
يمكن تحقيق ربح 30 دولارًا في الساعة كمحلل بيانات مبتدئًا من خلال التفاني والتخطيط الاستراتيجي، من خلال اكتساب المهارات الأساسية واكتساب الخبرة العملية وبناء تواجد قوي عبر الإنترنت والتواصل والاستفادة من منصات العمل الحر والتعلم المستمر يمكنك تحقيق النجاح في هذا المجال وتذكر أن المثابرة والرغبة في التعلم هما المفتاح للتقدم في حياتك المهنية وتحقيق أهدافك المالية
Working from home has become increasingly popular, offering flexibility, comfort, and the potential for significant income. Here are ten work-at-home jobs that can help you earn $100 a day or more:
1. Freelance Writing
Freelance writing is a versatile and accessible job for those with strong writing skills. Many companies and websites need content for blogs, articles, and marketing materials. Rates vary, but experienced writers can easily earn $100 a day by completing a few assignments.
How to Get Started:
Create a portfolio of writing samples.
Join freelance platforms like Upwork, Fiverr, or Freelancer.
Network with potential clients on LinkedIn and social media.
2. Virtual Assistant
Virtual assistants provide administrative support to businesses and entrepreneurs. Tasks can include managing emails, scheduling appointments, and social media management. Depending on the complexity and volume of work, virtual assistants can earn $15-$50 per hour.
How to Get Started:
Highlight your administrative and organizational skills in your resume.
Register on platforms like Zirtual, Time Etc, and Belay.
Offer your services to small businesses and entrepreneurs.
3. Online Tutoring
Online tutoring is an excellent option for those with expertise in a particular subject. Tutors can teach students of all ages in areas such as math, science, languages, and test preparation. Rates can range from $15 to $60 per hour, depending on the subject and level of expertise.
How to Get Started:
Identify your area of expertise and gather relevant certifications.
Join tutoring platforms like VIPKid, Chegg Tutors, and Tutor.com.
Market your services through social media and educational forums.
4. Graphic Design
Graphic designers create visual content for websites, advertisements, logos, and more. Skilled designers can charge $25-$100 per hour, making it possible to earn $100 a day with just a few hours of work.
How to Get Started:
Build a portfolio showcasing your design work.
Join design platforms like 99designs, Dribbble, and Behance.
Offer your services on freelance marketplaces.
5. Transcription Services
Transcription involves converting audio or video recordings into written text. Transcriptionists can earn $15-$30 per hour, and experienced transcriptionists can complete an hour of audio in about two hours of work, reaching the $100 mark daily.
How to Get Started:
Practice transcribing to improve speed and accuracy.
Join transcription platforms like Rev, TranscribeMe, and Scribie.
Invest in good headphones and transcription software.
Advertisements
6. Social Media Management
Social media managers handle the social media presence of businesses, including content creation, posting, and interaction with followers. Depending on the client and scope of work, rates can range from $20 to $50 per hour.
How to Get Started:
Develop a strong understanding of various social media platforms.
Create a portfolio showcasing successful social media campaigns.
Offer your services to small businesses and start-ups.
7. Online Customer Support
Customer support representatives assist customers via phone, email, or chat. Many companies hire remote customer support agents, and the pay typically ranges from $12 to $20 per hour.
How to Get Started:
Highlight your customer service experience and skills in your resume.
Apply for remote customer support positions on job boards like Indeed, Remote.co, and FlexJobs.
Ensure you have a quiet workspace and reliable internet connection.
8. E-commerce
Running an e-commerce store through platforms like Etsy, eBay, or Amazon can be highly profitable. Selling handmade crafts, vintage items, or even drop-shipped products can easily generate $100 a day with the right strategy.
How to Get Started:
Choose a niche and source or create products.
Set up your online store on platforms like Etsy, eBay, or Amazon.
Market your store through social media and online advertising.
9. Affiliate Marketing
Affiliate marketers promote products or services and earn a commission for each sale made through their referral link. With effective marketing strategies, affiliates can earn $100 or more per day.
How to Get Started:
Choose a niche and research affiliate programs related to it.
Create a blog or social media presence to promote products.
Join affiliate networks like Amazon Associates, ShareASale, and Commission Junction.
10. Online Coaching or Consulting
If you have expertise in a specific field, offering coaching or consulting services can be highly lucrative. Coaches and consultants can charge anywhere from $50 to $200 per hour, easily reaching $100 a day with a couple of sessions.
How to Get Started:
Identify your niche and gather relevant certifications.
Create a professional website to showcase your services.
Promote your services through networking and social media.
Conclusion
Working from home offers numerous opportunities to earn a substantial income. By leveraging your skills and expertise, you can find a work-at-home job that suits your lifestyle and financial goals. Whether you choose freelance writing, virtual assistance, or online tutoring, the potential to earn $100 a day or more is within your reach.
Advertisements
عشرة وظائف للعمل في المنزل تدفع 100 دولار في اليوم
Advertisements
أصبح العمل من المنزل شائعًا بشكل متزايد، مما يوفر المرونة والراحة وإمكانية تحقيق دخل كبير فيما يلي عشر وظائف للعمل في المنزل يمكن أن تساعدك على كسب مئة دولار يوميًا أو أكثر
1 الكتابة المستقلة
الكتابة المستقلة هي وظيفة متعددة الاستخدامات ويمكن الوصول إليها لأولئك الذين يتمتعون بمهارات كتابية قوية تحتاج العديد من الشركات ومواقع الويب إلى محتوى للمدونات والمقالات والمواد التسويقية تختلف الأسعار، لكن يمكن للكتّاب ذوي الخبرة كسب 100 دولار يوميًا بسهولة عن طريق إكمال بعض المهام
كيف تبدأ؟
إنشاء محفظة من عينات الكتابة
Upwork أو Fiverr أو Freelancer انضم إلى منصات العمل الحر مثل
ووسائل التواصل الاجتماعي LinkedIn التواصل مع العملاء المحتملين على
2 المساعد الافتراضي
يقدم المساعدون الافتراضيون الدعم الإداري للشركات ورجال الأعمال يمكن أن تشمل المهام إدارة رسائل البريد الإلكتروني وجدولة المواعيد وإدارة وسائل التواصل الاجتماعي اعتمادًا على مدى تعقيد وحجم العمل، يمكن أن يكسب المساعدون الافتراضيون ما بين 15 إلى 50 دولارًا في الساعة
كيف تبدأ؟
قم بإبراز مهاراتك الإدارية والتنظيمية في سيرتك الذاتية
Zirtual وTime Etc وBelay قم بالتسجيل على منصات مثل
تقديم خدماتك للشركات الصغيرة ورجال الأعمال
3 التدريس عبر الإنترنت
يعد التدريس عبر الإنترنت خيارًا ممتازًا لأولئك الذين لديهم خبرة في موضوع معين يمكن للمدرسين تعليم الطلاب من جميع الأعمار في مجالات مثل الرياضيات والعلوم واللغات والتحضير للاختبارات يمكن أن تتراوح الأسعار من 15 دولارًا إلى 60 دولارًا للساعة، اعتمادًا على الموضوع ومستوى الخبرة
كيف تبدأ؟
حدد مجال خبرتك واجمع الشهادات ذات الصلة
VIPKid وChegg Tutors وTutorcom انضم إلى منصات التدريس مثل
تسويق خدماتك عبر وسائل التواصل الاجتماعي والمنتديات التعليمية
4 التصميم الجرافيكي
يقوم مصممو الجرافيك بإنشاء محتوى مرئي لمواقع الويب والإعلانات والشعارات والمزيد يمكن للمصممين المهرة أن يتقاضوا ما بين 25 إلى 100 دولار في الساعة، مما يجعل من الممكن كسب 100 دولار في اليوم من خلال بضع ساعات فقط من العمل
كيف تبدأ؟
أنشئ محفظة تعرض أعمال التصميم الخاصة بك
designs99 وDribble وBehance انضم إلى منصات التصميم مثل
اعرض خدماتك في الأسواق المستقلة
5 خدمات النسخ
يتضمن النسخ تحويل التسجيلات الصوتية أو الفيديو إلى نص مكتوب يمكن أن يكسب عمال النسخ ما بين 15 إلى 30 دولارًا في الساعة، ويمكن لعمال النسخ ذوي الخبرة إكمال ساعة من الصوت في حوالي ساعتين من العمل، ليصلوا إلى علامة 100 دولار يوميًا
كيف تبدأ؟
تدرب على النسخ لتحسين السرعة والدقة
Rev وTranscribeMe وScribie انضم إلى منصات النسخ مثل
استثمر في سماعات الرأس الجيدة وبرامج النسخ
Advertisements
6 إدارة وسائل التواصل الاجتماعي
يتعامل مديرو وسائل التواصل الاجتماعي مع تواجد الشركات على وسائل التواصل الاجتماعي، بما في ذلك إنشاء المحتوى ونشره والتفاعل مع المتابعين اعتمادًا على العميل ونطاق العمل، يمكن أن تتراوح الأسعار من 20 دولارًا إلى 50 دولارًا في الساعة
كيف تبدأ؟
تطوير فهم قوي لمنصات التواصل الاجتماعي المختلفة
إنشاء محفظة تعرض حملات وسائل التواصل الاجتماعي الناجحة
تقديم خدماتك للشركات الصغيرة والشركات الناشئة
7 دعم العملاء عبر الإنترنت
يساعد ممثلو دعم العملاء العملاء عبر الهاتف أو البريد الإلكتروني أو الدردشة تقوم العديد من الشركات بتعيين وكلاء دعم العملاء عن بعد، ويتراوح الأجر عادةً من 12 دولارًا إلى 20 دولارًا في الساعة
كيف تبدأ؟
سلط الضوء على خبرتك ومهاراتك في خدمة العملاء في سيرتك الذاتية
Indeed، وRemoteco، وFlexJobsتقدم بطلب للحصول على وظائف دعم العملاء عن بعد على لوحات الوظائف مثل
تأكد من أن لديك مساحة عمل هادئة واتصالاً موثوقًا بالإنترنت
8 التجارة الإلكترونية
يمكن أن يكون تشغيل متجر للتجارة الإلكترونية من خلال منصات مثل Etsy أو eBay أو Amazon مربحًا للغاية يمكن أن يؤدي بيع المصنوعات اليدوية أو العناصر القديمة أو حتى المنتجات التي يتم شحنها بسهولة إلى تحقيق 100 دولار يوميًا باستخدام الإستراتيجية الصحيحة
كيف تبدأ؟
اختر مكانًا ومصدرًا أو أنشئ منتجات
Etsy أو eBay أو Amazon قم بإعداد متجرك عبر الإنترنت على منصات مثل
قم بتسويق متجرك من خلال وسائل التواصل الاجتماعي والإعلان عبر الإنترنت
9 التسويق بالعمولة
يقوم المسوقون بالعمولة بالترويج للمنتجات أو الخدمات ويحصلون على عمولة مقابل كل عملية بيع تتم من خلال رابط الإحالة الخاص بهم مع استراتيجيات التسويق الفعالة، يمكن للشركات التابعة أن تكسب 100 دولار أو أكثر يوميًا
كيف تبدأ؟
اختر مجالًا متخصصًا وابحث عن البرامج التابعة المتعلقة به
أنشئ مدونة أو تواجدًا على وسائل التواصل الاجتماعي للترويج للمنتجات
Amazon Associates وShareASale وCommission Junction انضم إلى الشبكات التابعة مثل
10 التدريب أو الاستشارة عبر الإنترنت
إذا كانت لديك خبرة في مجال معين، فإن تقديم خدمات التدريب أو الاستشارات يمكن أن يكون مربحًا للغاية يمكن للمدربين والاستشاريين أن يتقاضوا ما يتراوح بين 50 إلى 200 دولار في الساعة، ويصلون بسهولة إلى 100 دولار في اليوم من خلال جلستين
كيف تبدأ؟
حدد مكانتك واجمع الشهادات ذات الصلة
إنشاء موقع ويب احترافي لعرض خدماتك
الترويج لخدماتك من خلال شبكات التواصل الاجتماعي ووسائل التواصل الاجتماعي
خاتمة
يوفر العمل من المنزل العديد من الفرص لكسب دخل كبير من خلال الاستفادة من مهاراتك وخبراتك، يمكنك العثور على وظيفة عمل في المنزل تناسب أسلوب حياتك وأهدافك المالية سواء اخترت الكتابة المستقلة، أو المساعدة الافتراضية، أو التدريس عبر الإنترنت، فإن إمكانية كسب 100 دولار في اليوم أو أكثر هي في متناول يدك
In today’s digital era, there are numerous opportunities to make money online This article provides an overview of 60 websites, categorized by type, and explains how each can help you earn money from the comfort of your home
Freelancing Platforms
Upwork: A versatile freelancing platform for services like writing, graphic design, and programming
Fiverr: A marketplace for freelance services starting at $5, including digital marketing and video editing
Freelancer: Connects freelancers with clients for various services, from software development to administrative support
Toptal: A platform for top-tier freelancers, especially in software development, design, and finance
Guru: A freelance marketplace for professionals across multiple industries
PeoplePerHour: Connects freelancers with businesses needing project-based work, particularly in tech and design
99designs: A design-focused platform for graphic designers to participate in contests and work with clients
Remote and Flexible Job Boards
FlexJobs: A job board for remote and flexible jobs across various industries
SimplyHired: A job search engine that aggregates listings, including freelance and remote work opportunities
Microtasking and Survey Sites
Amazon Mechanical Turk: A microtasking platform for completing small tasks like data entry and surveys
Swagbucks: Earn points for taking surveys, watching videos, and shopping online
InboxDollars: Pays users to take surveys, watch videos, and read emails
SurveyJunkie: Earn money by participating in market research surveys
Vindale Research: Get paid for completing online surveys and participating in product testing
UserTesting: Provides payments for testing websites and apps and giving feedback
Respondent: Connects researchers with participants for studies and surveys
PineconeResearch: A survey site that offers product testing opportunities and rewards
Toluna: Earn points by taking surveys and testing products, redeemable for rewards
MyPoints: Rewards users for online activities like shopping and taking surveys
Cashback and Reward Apps
Rakuten: Provides cashback for shopping online through their portal
Ibotta: A cashback app for groceries and other purchases by scanning receipts
Dosh: Earn cashback for shopping, dining, and booking hotels
Shopkick: Earn rewards for walking into stores, scanning items, and making purchases
Honey: Save money with coupon codes and earn rewards for online shopping
Advertisements
Selling and Reselling Platforms
Poshmark: Sell new and used clothing and accessories
eBay: An online marketplace for buying and selling a wide range of items
Etsy: Marketplace for handmade, vintage, and unique goods
Decluttr: Sell old electronics, games, and DVDs with instant valuations and free shipping
Gazelle: Sell used electronics like smartphones and tablets
BookScouter: Compares prices from book buyback vendors to sell textbooks
ThredUp: An online consignment store for secondhand clothes
Print-on-Demand and Custom Products
Zazzle: Design and sell custom products like T-shirts, mugs, and phone cases
CafePress: Create and sell custom products, earning money from each purchase
Redbubble: Sell your artwork on various products, from apparel to home decor
Teespring: Create and sell custom T-shirts and other merchandise without upfront costs
Printful: A print-on-demand drop shipping service for custom products
Society6: Sell your art on custom-made products like prints and phone cases
Self-Publishing
Blurb: Tools for self-publishing and selling books, including photo books and magazines
AmazonKindle Direct Publishing: Self-publish e-books and sell them on Amazon’s Kindle Store
CreateSpace: Self-publish print books, now integrated with Kindle Direct Publishing
ACX: Create and sell audiobooks by connecting with narrators and producers
Crowdfunding and Membership Platforms
Patreon: Crowdfunding platform where creators earn money from fans through subscriptions
Kickstarter: Fund creative projects through crowdfunding, offering rewards to backers
Indiegogo: Supports a wide range of projects, from technology to arts, through crowdfunding
GoFundMe: A fundraising platform for personal causes
Content Creation Platforms
YouTube: Monetize videos through ads, sponsorships, and channel memberships
Twitch: Stream live content and earn through ads, subscriptions, and donations
TikTok: Monetize short videos through brand partnerships and the TikTok Creator Fund
Instagram: Earn money through sponsored posts, brand partnerships, and product sales
Facebook: Various monetization options, including ads, partnerships, and marketplace sales
Snapchat: Earn through Snap Ads, brand partnerships, and creating engaging content
Pinterest: Drive traffic to products and earn through affiliate links and sponsored pins
Medium: Earn money through the Partner Program by publishing articles
Quora: Monetize by asking questions and engaging in the Quora Partner Program
Online Teaching and Tutoring
Skillshare: Earn money by teaching online courses on various topics
Udemy: Create and sell online courses, earning from student enrollments
Coursera: Partner with universities to offer online courses and earn based on enrollments
Teachable: An all-in-one platform for creating, marketing, and selling online courses
Thinkific: Similar to Teachable, allows instructors to build and sell online courses
Wyzant: Tutor students online and in person, setting your own rates and schedule
Conclusion
These 60 websites provide diverse opportunities to make money online, catering to various skills, interests, and levels of commitment Whether you are a freelancer, a creative artist, a writer, or someone looking to monetize everyday activities, there is a platform to help you generate income By leveraging these resources, individuals can find flexible, remote, and often lucrative ways to supplement their income or even build full-time careers
Advertisements
ستون موقعاً لكسب المال عبر الإنترنت مصنفة حسب النوع
Advertisements
في العصر الرقمي الحالي هناك العديد من الفرص لكسب المال عبر الإنترنت تقدم هذه المقالة نظرة عامة على ستون موقعاً إلكترونياً مصنفة حسب النوع وتشرح كيف يمكن لكل منها مساعدتك في كسب المال وأنت مرتاح في منزلك
منصات العمل الحر
Upwork: منصة مستقلة متعددة الاستخدامات لخدمات مثل الكتابة والتصميم الجرافيكي والبرمجة
Fiverr: سوق لخدمات العمل الحر يبدأ من خمسة دولارات بما في ذلك التسويق الرقمي وتحرير الفيديو
Freelancer: يربط العاملين لحسابهم الخاص بالعملاء للحصول على خدمات متنوعة، بدءاً من تطوير البرمجيات وحتى الدعم الإداري
Toptal: منصة للعاملين المستقلين من الدرجة الأولى خاصة في مجال تطوير البرمجيات والتصميم والتمويل
Guru: سوق مستقل للمهنيين في العديد من الصناعات
PeoplePerHour: يربط العاملين لحسابهم الخاص مع الشركات التي تحتاج إلى عمل قائم على المشاريع، وخاصة في مجال التكنولوجيا والتصميم
99designs: منصة تركز على التصميم لمصممي الجرافيك للمشاركة في المسابقات والعمل مع العملاء
العمل عن بعد
FlexJobs: لوحة وظائف للوظائف البعيدة والمرنة في مختلف الصناعات
SimplyHired: محرك بحث عن الوظائف يجمع القوائم بما في ذلك فرص العمل المستقل والعمل عن بعد
مواقع الاستطلاعات والمهام الدقيقة
Amazon Mechanical Turk: منصة للمهام الدقيقة لاستكمال المهام الصغيرة مثل إدخال البيانات والاستطلاعات
Swagbucks: اربح نقاطاً مقابل إجراء الاستطلاعات ومشاهدة مقاطع الفيديو والتسوق عبر الإنترنت
InboxDollars: يدفع للمستخدمين مقابل إجراء الاستطلاعات ومشاهدة مقاطع الفيديو وقراءة رسائل البريد الإلكتروني
Survey Junkie: اربح المال من خلال المشاركة في استطلاعات أبحاث السوق
Vindale Research: احصل على أموال مقابل إكمال الاستبيانات عبر الإنترنت والمشاركة في اختبار المنتج
UserTesting: يوفر مدفوعات مقابل اختبار مواقع الويب والتطبيقات وتقديم التعليقات
Respondent: يربط الباحثين بالمشاركين في الدراسات والاستبيانات
Pinecone Research: موقع استقصائي يقدم فرصًا ومكافآت لاختبار المنتجات
Toluna: اربح نقاطاً عن طريق إجراء الاستطلاعات واختبار المنتجات ويمكن استبدالها بمكافآت
MyPoints: يكافئ المستخدمين على الأنشطة عبر الإنترنت مثل التسوق وإجراء الاستطلاعات
Advertisements
تطبيقات استرداد النقود والمكافآت
Rakuten: يوفر استرداد نقدي للتسوق عبر الإنترنت من خلال بوابتهم
Ibotta: تطبيق استرداد النقود للبقالة والمشتريات الأخرى عن طريق مسح الإيصالات
Dosh: احصل على استرداد نقدي للتسوق وتناول الطعام وحجز الفنادق
Shopkick: احصل على مكافآت مقابل الدخول إلى المتاجر ومسح العناصر وإجراء عمليات الشراء
Honey: وفر المال باستخدام رموز القسيمة واكسب مكافآت للتسوق عبر الإنترنت
منصات البيع وإعادة البيع
Poshmark: بيع الملابس والاكسسوارات الجديدة والمستعملة
eBay: سوق عبر الإنترنت لبيع وشراء مجموعة واسعة من العناصر
Etsy: سوق للسلع اليدوية والعتيقة والفريدة من نوعها
Gazelle: بيع الأجهزة الإلكترونية المستعملة مثل الهواتف الذكية والأجهزة اللوحية
BookScouter: يقارن الأسعار من بائعي إعادة شراء الكتب لبيع الكتب المدرسية
ThredUp: متجر شحن عبر الإنترنت للملابس المستعملة
الطباعة عند الطلب والمنتجات المخصصة
Zazzle: تصميم وبيع منتجات مخصصة مثل القمصان والأكواب وحافظات الهاتف
CafePress: إنشاء وبيع منتجات مخصصة وكسب المال من كل عملية شراء
Redbubble: قم ببيع أعمالك الفنية على منتجات مختلفة بدءًا من الملابس وحتى ديكور المنزل
Teespring: إنشاء وبيع القمصان المخصصة وغيرها من البضائع دون تكاليف مسبقة
Printful: خدمة الشحن السريع للطباعة عند الطلب للمنتجات المخصصة
Society6: قم ببيع أعمالك الفنية على منتجات مصنوعة خصيصاً مثل المطبوعات وحافظات الهاتف
النشر الذاتي
Blurb: أدوات للنشر الذاتي وبيع الكتب بما في ذلك كتب الصور والمجلات
Amazon Kindle Direct Publishing: Amazon’s Kindle نشر الكتب الإلكترونية ذاتياً وبيعها على متجر
CreateSpace: كتب مطبوعة ذاتية النشر، مدمجة الآن مع Kindle Direct Publishing
ACX: قم بإنشاء وبيع الكتب الصوتية من خلال التواصل مع الرواة والمنتجين
منصات التمويل الجماعي والعضوية
Patreon: منصة للتمويل الجماعي حيث يكسب المبدعون الأموال من المعجبين من خلال الاشتراكات
Kickstarter: قم بتمويل المشاريع الإبداعية من خلال التمويل الجماعي وتقديم مكافآت للداعمين
Indiegogo: يدعم مجموعة واسعة من المشاريع من التكنولوجيا إلى الفنون من خلال التمويل الجماعي
GoFundMe: منصة لجمع التبرعات لأسباب شخصية
منصات إنشاء المحتوى
YouTube: يمكنك تحقيق الدخل من مقاطع الفيديو من خلال الإعلانات والرعاية وعضويات القناة
Twitch: قم ببث المحتوى المباشر واكسب من خلال الإعلانات والاشتراكات والتبرعات
TikTok: تحقيق الدخل من مقاطع الفيديو القصيرة من خلال شراكات العلامات التجارية وصندوق TikTok Creator
Instagram: اكسب المال من خلال المنشورات الدعائية وشراكات العلامات التجارية ومبيعات المنتجات
Facebook: خيارات متنوعة لتحقيق الدخل بما في ذلك الإعلانات والشراكات ومبيعات السوق
Snapchat: اربح من خلال إعلانات سناب وشراكات العلامات التجارية وإنشاء محتوى جذاب
Pinterest: قم بتوجيه حركة المرور إلى المنتجات واكسب من خلال الروابط التابعة والدبابيس الدعائية
Medium: اربح المال من خلال برنامج الشركاء من خلال نشر المقالات
Quora: تحقيق الدخل من خلال طرح الأسئلة والمشاركة في المحادثات
التدريس والتدريس عبر الإنترنت
Skillshare: اربح المال عن طريق تدريس دورات عبر الإنترنت حول مواضيع مختلفة
Udemy: إنشاء الدورات التدريبية عبر الإنترنت وبيعها والربح من تسجيلات الطلاب
Coursera: شراكة مع الجامعات لتقديم دورات عبر الإنترنت وتحقيق الربح بناءً على التسجيلات
Teachable: منصة شاملة لإنشاء الدورات التدريبية عبر الإنترنت وتسويقها وبيعها
Thinkific: يسمح للمدرسين ببناء وبيع الدورات التدريبية عبر الإنترنت
Wyzant: قم بتدريس الطلاب عبر الإنترنت وشخصياً مع تحديد الأسعار والجدول الزمني الخاص بك
خاتمة
توفر هذه المواقع فرصاً متنوعة لكسب المال عبر الإنترنت وتلبي مختلف المهارات والاهتمامات ومستويات الالتزام سواء كنت مستقلاً أو فناناً مبدعاً أو كاتباً أو شخصاً يتطلع إلى تحقيق الدخل من الأنشطة اليومية فهناك منصة لمساعدتك في تحقيق الدخل ومن خلال الاستفادة من هذه الموارد يمكن للأفراد العثور على طرق مرنة ونائية ومربحة في كثير من الأحيان لتكملة دخلهم أو حتى بناء وظائف بدوام كامل
Investing $100 to potentially generate $1,000 in passive income involves strategic planning and leveraging opportunities that offer high returns with relatively low initial investment. Here are some ideas that anyone can start:
1. Dividend Stocks
Investing in dividend-paying stocks can provide a steady stream of passive income. Start by researching companies with a strong track record of dividend payments. Use your $100 to buy shares of these companies. Reinvesting dividends can compound your returns over time.
Steps:
Open a brokerage account (many have no minimum deposit requirements).
Research and select dividend-paying stocks.
Purchase shares and opt for a dividend reinvestment plan (DRIP).
2. Peer-to-Peer Lending
Peer-to-peer (P2P) lending platforms allow you to lend money to individuals or small businesses in exchange for interest payments. Your $100 can be divided among several borrowers to diversify risk.
Steps:
Sign up on a reputable P2P lending platform (e.g., LendingClub, Prosper).
Deposit your $100 and choose loans to fund.
Earn interest on repayments.
3. High-Interest Savings Accounts or CDs
While not as high-yielding as other investments, high-interest savings accounts or certificates of deposit (CDs) offer a safe way to earn interest on your money.
Steps:
Research banks offering the best interest rates.
Open an account and deposit your $100.
Let the interest compound over time.
4. Invest in a Blog or Website
Starting a blog or website can generate passive income through advertising, affiliate marketing, and selling digital products or services. Initial costs can be kept low.
Steps:
Purchase a domain name and hosting (around $50-$100 for the first year).
Create content focused on a niche.
Monetize through ads, affiliate links, or selling digital products.
5. E-books or Online Courses
If you have expertise in a particular area, you can write an e-book or create an online course. These digital products can generate passive income over time.
Steps:
Use free or low-cost platforms like Amazon Kindle Direct Publishing or Udemy.
Create and upload your content.
Market your product to drive sales.
Advertisements
6. Invest in a REIT
Real Estate Investment Trusts (REITs) allow you to invest in real estate without buying property. REITs often pay high dividends.
Steps:
Open a brokerage account.
Research and select a REIT with a strong dividend history.
Purchase shares and reinvest dividends.
7. Micro-Investing Apps
Micro-investing apps like Acorns or Stash allow you to invest small amounts of money into diversified portfolios, making it easy to start with just $100.
Steps:
Download and sign up for a micro-investing app.
Link your bank account and deposit your $100.
Choose an investment portfolio and let the app manage your investments.
8. Cryptocurrency Investments
While riskier, investing in cryptocurrencies can potentially yield high returns. Allocate a small portion of your $100 to cryptocurrencies and hold for long-term growth.
Steps:
Open an account on a cryptocurrency exchange (e.g., Coinbase, Binance).
Purchase a diversified mix of cryptocurrencies.
Hold and monitor your investment.
9. Cashback and Reward Programs
Investing $100 in purchases through cashback and reward programs can yield significant returns if you consistently leverage these programs for routine expenses.
Steps:
Sign up for cashback and reward programs.
Use the programs for routine purchases.
Reinvest the earned rewards or cashback.
Conclusion
While $100 is a modest amount, starting with small investments can teach valuable lessons in managing and growing money. Diversify your investments to spread risk and increase the potential for returns. Remember, building passive income often requires time and patience, so remain committed to your strategy.
Advertisements
الدخل السلبي
كيف تنفق مئة دولار لتكسب ألف دولار
Advertisements
إن استثمار مئة دولار أمريكي لتوليد دخل سلبي قدره ألف دولار أمريكي يتضمن تخطيطًا استراتيجيًا والاستفادة من الفرص التي توفر عوائد عالية باستثمار أولي منخفض نسبيًا
فيما يلي بعض الأفكار التي يمكن لأي شخص البدء بها
1. أرباح الأسهم
الاستثمار في الأسهم التي تدفع أرباحًا يمكن أن يوفر دفقًا ثابتًا من الدخل السلبي، ابدأ بالبحث عن الشركات التي تتمتع بسجل حافل من توزيعات الأرباح، استخدم مئة دولار لشراء أسهم هذه الشركات، يمكن أن تؤدي إعادة استثمار الأرباح إلى مضاعفة عوائدك بمرور الوقت
:خطوات
افتح حساب وساطة (العديد منهم ليس لديهم حد أدنى لمتطلبات الإيداع)
قم بالبحث واختيار الأسهم التي تدفع أرباحاً
(DRIP) قم بشراء الأسهم واختر خطة إعادة استثمار الأرباح
2. الإقراض من نظير إلى نظير
(P2P) تتيح لك منصات الإقراض من نظير إلى نظير
إقراض الأموال للأفراد أو الشركات الصغيرة مقابل دفعات الفائدة، يمكن تقسيم مبلغ مئة دولار الخاص بك بين عدة مقترضين لتنويع المخاطر
:خطوات
P2P قم بالتسجيل على منصة إقراض
(LendingClub، Prosper ذات سمعة طيبة (على سبيل المثال
قم بإيداع مبلغ مئة دولار الخاص بك واختر القروض لتمويلها.
كسب الفائدة على السداد
3. حسابات التوفير أو الأقراص المضغوطة ذات الفائدة المرتفعة
على الرغم من أنها ليست ذات عائد مرتفع مثل الاستثمارات الأخرى، إلا أن حسابات التوفير
(CDs) ذات الفائدة المرتفعة أو شهادات الإيداع
توفر طريقة آمنة لكسب الفائدة على أموالك
خطوات:
البنوك البحثية تقدم أفضل أسعار الفائدة
افتح حسابًا وأودع مئة دولار
دع الفائدة تتراكم مع مرور الوقت
4. استثمر في مدونة أو موقع ويب
يمكن أن يؤدي إنشاء مدونة أو موقع ويب إلى توليد دخل سلبي من خلال الإعلانات والتسويق التابع وبيع المنتجات أو الخدمات الرقمية، يمكن إبقاء التكاليف الأولية منخفضة
:خطوات
شراء اسم المجال والاستضافة (حوالي خمسون إلى مئة دولار للسنة الأولى)
إنشاء محتوى يركز على مكانة معينة
يمكنك تحقيق الدخل من خلال الإعلانات أو الروابط التابعة أو بيع المنتجات الرقمية
Advertisements
5. الكتب الإلكترونية أو الدورات عبر الإنترنت إذا كانت لديك خبرة في مجال معين، فيمكنك كتابة كتاب إلكتروني أو إنشاء دورة تدريبية عبر الإنترنت. يمكن لهذه المنتجات الرقمية أن تولد دخلاً سلبيًا بمرور الوقت
:خطوات
استخدم منصات مجانية أو منخفضة التكلفة مثل
Udemy أو Amazon Kindle Direct Publishing
إنشاء وتحميل المحتوى الخاص بك
قم بتسويق منتجك لزيادة المبيعات
6. استثمر في صندوق الاستثمار العقاري
(REITs) تسمح لك صناديق الاستثمار العقاري
بالاستثمار في العقارات دون شراء العقارات. غالبا ما تدفع صناديق الاستثمار العقارية أرباحا عالية
:خطوات
افتح حساب وساطة
قم بالبحث واختيار صندوق استثمار عقاري ذي تاريخ قوي في توزيع الأرباح
شراء الأسهم وإعادة استثمار الأرباح
7. تطبيقات الاستثمار الصغير
Stash أو Acorns تتيح لك تطبيقات الاستثمار الصغير مثل
استثمار مبالغ صغيرة من المال في محافظ استثمارية متنوعة، مما يجعل من السهل البدء بمبلغ مئة دولار فقط
:خطوات
قم بتنزيل تطبيق الاستثمار الصغير والاشتراك فيه
اربط حسابك البنكي وأودع 100 دولار
اختر محفظة استثمارية ودع التطبيق يدير استثماراتك
8. استثمارات العملة المشفرة
على الرغم من أن الاستثمار في العملات المشفرة أكثر خطورة، إلا أنه من الممكن أن يحقق عوائد عالية، خصص جزءًا صغيرًا من 100 دولار أمريكي للعملات المشفرة واحتفظ بها لتحقيق النمو على المدى الطويل
:خطوات
(Binance أو Coinbase افتح حسابًا في بورصة العملات المشفرة (مثل
قم بشراء مزيج متنوع من العملات المشفرة
عقد ومراقبة الاستثمار الخاص بك
9. برامج الاسترداد النقدي والمكافآت
يمكن أن يؤدي استثمار 100 دولار في عمليات الشراء من خلال برامج الاسترداد النقدي والمكافآت إلى تحقيق عوائد كبيرة إذا كنت تستخدم هذه البرامج باستمرار لتغطية النفقات الروتينية.
:خطوات
اشترك في برامج الاسترداد النقدي والمكافآت
استخدم البرامج لعمليات الشراء الروتينية
أعد استثمار المكافآت المكتسبة أو الاسترداد النقدي
خاتمة
في حين أن 100 دولار هو مبلغ متواضع، إلا أن البدء باستثمارات صغيرة يمكن أن يعلمك دروسًا قيمة في إدارة الأموال وتنميتها، قم بتنويع استثماراتك لتوزيع المخاطر وزيادة إمكانية تحقيق العوائد. تذكر أن بناء الدخل السلبي غالبًا ما يتطلب الوقت والصبر، لذا كن ملتزمًا باستراتيجيتك
In the fast-paced world of affiliate marketing, finding the right programs can be the key to unlocking quick money.
Here are seven top-tier affiliate programs renowned for their potential to deliver rapid returns:
1. Amazon Associates:
As the largest online retailer globally, Amazon Associates stands as a cornerstone in affiliate marketing. With a vast selection of products spanning numerous categories, affiliates can tap into Amazon’s immense customer base and capitalize on its trusted reputation. With competitive commission rates and a user-friendly platform, Amazon Associates offers affiliates a reliable way to earn quick money through product referrals.
2. ClickBank:
Specializing in digital products such as e-books, courses, and software, ClickBank boasts some of the highest commission rates in the industry, often exceeding 50%. This generous commission structure, coupled with ClickBank’s extensive marketplace and robust tracking system, empowers affiliates to earn substantial income from promoting digital products to their audience.
3. ShareASale:
Catering to a wide range of industries and niches, ShareASale is a popular affiliate network that connects affiliates with merchants offering diverse products and services. With its intuitive interface and comprehensive reporting tools, ShareASale provides affiliates with the resources they need to identify high-converting offers and maximize their earnings potential.
4. CJ Affiliate(formerly Commission Junction):
With a network of thousands of advertisers, CJ Affiliate offers affiliates access to a vast array of affiliate programs across various verticals. Known for its reliable tracking technology and timely payments, CJ Affiliate provides affiliates with a trusted platform to monetize their online presence and generate quick money through affiliate marketing.
Advertisements
5. Rakuten Marketing:
Formerly known as Rakuten LinkShare, Rakuten Marketing is a global affiliate network that connects affiliates with top brands and advertisers. With its extensive network of merchants and robust reporting tools, Rakuten Marketing enables affiliates to optimize their promotional efforts and maximize their earnings potential.
6. eBay Partner Network:
Leveraging the popularity of one of the world’s largest online marketplaces, the eBay Partner Network allows affiliates to earn commissions by driving traffic and sales to eBay’s vast inventory of products. With its competitive commission rates and access to real-time performance data, the eBay Partner Network offers affiliates a lucrative opportunity to monetize their audience and earn quick money through affiliate marketing.
7. Shopify Affiliate Program:
Targeting entrepreneurs and businesses, the Shopify Affiliate Program allows affiliates to earn commissions by referring merchants to Shopify’s e-commerce platform. With its user-friendly interface and robust features, Shopify provides merchants with everything they need to start and grow their online store, making it an attractive option for affiliates looking to earn quick money by promoting e-commerce solutions.
In conclusion, these seven affiliate programs represent some of the best opportunities for affiliates to make quick money through affiliate marketing. Whether it’s through established platforms like Amazon Associates and ClickBank or affiliate networks like ShareASale and CJ Affiliate, affiliates have a wealth of options at their disposal to monetize their online presence and achieve financial success in a relatively short timeframe.
Advertisements
سبعة برامج فرعية مربحة لتحقيق أرباح سريعة
Advertisements
في عالم التسويق بالعمولة سريع الخطى، يمكن أن يكون العثور على البرامج المناسبة هو المفتاح لكسب الأموال سريعاً
:فيما يلي سبعة برامج ملحقة من الدرجة الأولى تشتهر بقدرتها على تحقيق أرباح سريعة
:Amazon Associates
باعتباره أكبر بائع تجزئة عبر الإنترنت على مستوى العالم، يعتبر هذا البرنامج بمثابة حجر الزاوية في التسويق بالعمولة، ومع مجموعة واسعة من المنتجات التي تغطي العديد من الفئات يمكن للشركات الملحقة الاستفادة من قاعدة عملاء أمازون الهائلة والاستفادة من سمعتها الموثوقة. بفضل أسعار العمولة التنافسية والمنصة سهلة الاستخدام
للشركات الملحقة Amazon Associates تقدم
طريقة موثوقة لكسب المال بسرعة من خلال إحالات المنتج
:ClickBank
متخصص في المنتجات الرقمية مثل الكتب الإلكترونية والدورات والبرامج، ويفتخر هذا البرنامج ببعض أعلى معدلات العمولة في الصناعة والتي غالبًا ما تتجاوز خمسون بالمئة، يعمل هيكل العمولة السخي هذا
الواسع ClickBank إلى جانب سوق
ونظام التتبع القوي على تمكين الشركات الملحقة من كسب دخل كبير من الترويج للمنتجات الرقمية لجمهورها
:ShareASale
تقدم هذه المنصة خدماتها لمجموعة واسعة من الصناعات والتخصصات، وهي شبكة ملحقة مشهورة تربط الشركات الملحقة بالتجار الذين يقدمون منتجات وخدمات متنوعة. بفضل واجهته البديهية وأدوات إعداد التقارير الشاملة، يوفر هذا البرنامج للشركات الملحقة الموارد التي يحتاجونها لتحديد العروض عالية التحويل وزيادة إمكانات أرباحهم إلى أقصى حد
:CJ Affiliate
Commission Junction المعروفة سابقًا باسم
من خلال شبكة تضم آلاف المعلنين، توفر هذه المنصة للشركات الملحقة إمكانية الوصول إلى مجموعة واسعة من البرامج الملحقة عبر مختلف القطاعات. تشتهر هذه المنصة بتكنولوجيا التتبع الموثوقة والمدفوعات في الوقت المناسب، وتوفر للشركات الملحقة منصة موثوقة لاستثمار تواجدها عبر الإنترنت وتحقيق أموال سريعة من خلال التسويق بالعمولة
Advertisements
:Rakuten Marketing
Rakuten LinkShare كانت هذه المنصة المعروفة سابقاً باسم
عبارة عن شبكة عالمية ملحقة تربط الشركات الملحقة مع أفضل العلامات التجارية والمعلنين. بفضل شبكتها الواسعة من التجار وأدوات إعداد التقارير القوية، تمكن هذه المنصة الشركات الملحقة من تحسين جهودها الترويجية وزيادة إمكانات أرباحها إلى أقصى حد
: eBay شبكة شركاء
من خلال الاستفادة من شعبية واحدة من أكبر الأسواق عبر الإنترنت في العالم، تسمح هذه الشبكة للشركات الملحقة بكسب العمولات من خلال زيادة حركة المرور والمبيعات
الضخم eBay إلى مخزون منتجات
بفضل أسعار العمولات التنافسية وإمكانية الوصول إلى بيانات الأداء في الوقت الفعلي، توفر هذه الشبكة للشركات الملحقة فرصة مربحة لاستثمار جمهورها وكسب أموال سريعة من خلال التسويق بالعمولة
: Shopify Affiliate برنامج
يستهدف هذا البرنامج رواد الأعمال والشركات، ويسمح للشركات الملحقة بكسب العمولات عن طريق إحالة التجار
للتجارة الإلكترونية Shopify إلى منصة
Shopify بفضل واجهته سهلة الاستخدام وميزاته القوية يوفر
للتجار كل ما يحتاجونه لبدء متجرهم عبر الإنترنت وتنميته، مما يجعله خياراً جذاباً للشركات الملحقة التي تتطلع إلى كسب المال السريع من خلال الترويج لحلول التجارة الإلكترونية
ختاماً، تمثل هذه البرامج السبعة الملحقة بعضًا من أفضل الفرص للشركات الملحقة لكسب المال السريع من خلال التسويق بالعمولة. سواء كان ذلك من خلال منصات راسخة
ClickBankو Amazon Associates مثل
CJ Affiliate و ShareASale أو الشبكات الملحقة مثل
فإن الشركات الملحقة لديها ثروة من الخيارات المتاحة لها لاستثمار تواجدها عبر الإنترنت وتحقيق النجاح المالي في إطار زمني قصير نسبياً
Certainly! ChatGPT is a versatile tool that can significantly enhance productivity. Here are some compelling ways to use it:
Simplify Research: Instead of spending hours on Google, ChatGPT can summarize articles, provide insights, and help you find relevant information quickly.
Draft Emails: Need to compose an email? ChatGPT can assist by suggesting content, improving clarity, and ensuring your message is effective.
Summarize Long Documents: Whether it’s reports, research papers, or lengthy articles, ChatGPT can create concise summaries, saving you time and effort.
Marketing Materials: Generate engaging content for blogs, articles, and social media. ChatGPT crafts compelling copy that resonates with your audience.
Advertisements
Coding Snippets and Troubleshooting: ChatGPT assists with writing code, debugging, and understanding complex syntax. It’s like having a coding buddy!
Customer Service: Automate responses to common queries, freeing up your team to focus on more critical tasks.
Create Study Guides: ChatGPT can organize information into study materials, making exam preparation efficient.
Fresh Content Generation: Whether you’re a writer, marketer, or blogger, ChatGPT can spark creativity and provide fresh ideas.
Remember, while ChatGPT is powerful, always verify critical information and use it ethically. Happy productivity!
Advertisements
لإنجاز المهام اليومية؟ChatGPTكيف يمكنني استخدام
Advertisements
هي أداة متعددة الاستخدامات ChatGPT
يمكنها تحسين الإنتاجية بشكل كبير: فيما يلي بعض الطرق المقنعة لاستخدامها
: تبسيط البحث
بدلاً من قضاء ساعات على غوغل
تلخيص المقالات ChatGPT يستطيع
وتقديم رؤى ومساعدتك في العثور على المعلومات ذات الصلة بسرعة
: مسودة رسائل البريد الإلكتروني
هل تحتاج إلى إنشاء بريد إلكتروني؟
المساعدة ChatGPT يمكن لـ
من خلال اقتراح المحتوى وتحسين الوضوح والتأكد من فعالية رسالتك
: تلخيص المستندات الطويلة
سواء كانت تقارير أو أوراق بحثية أو مقالات مطولة
إنشاء ملخصات موجزة ChatGPT يمكن لـ
مما يوفر لك الوقت والجهد
: المواد التسويقية
قم بإنشاء محتوى جذاب للمدونات والمقالات ووسائل التواصل الاجتماعي
بصياغة نسخة مقنعة ChatGPT يقوم
تلقى صدى لدى جمهورك
Advertisements
: مقتطفات الترميز واستكشاف الأخطاء وإصلاحها
في كتابة التعليمات البرمجية ChatGPT يساعد
وتصحيح الأخطاء وفهم بناء الجملة المعقد، إنه مثل وجود صديق للبرمجة
: خدمة العملاء
أتمتة الاستجابات للاستفسارات الشائعة، مما يتيح لفريقك التركيز على المهام الأكثر أهمية
: إنشاء أدلة دراسية
تنظيم المعلومات في مواد دراسية ChatGPT يمكن لـ
مما يجعل التحضير للامتحانات فعالاً
: إنشاء محتوى جديد
سواء كنت كاتبًا أو مسوقًا أو مدونًا
إثارة الإبداع وتقديم أفكار جديدة ChatGPT يمكن لـ
: ختاماً
ChatGPT وعلى الرغم من أن
خيار رائع وضروري إلا أنه عليك التحقق دائماً من المعلومات المهمة واستخدمها بشكل مثالي وفي مكانها الصحيح لتحصل على أقصى فائدة
For aspiring video creators hoping to turn their passion into a career, YouTube often appears as an ideal platform. The allure of sudden fame and financial success is strong, fueled by stories of YouTubers who have made millions of dollars. However, beneath the glitter and gloss lie some harsh realities that aspiring YouTubers must confront:
Fluctuating Ad Revenue: Even after reaching the monetization thresholds, ad revenue remains highly variable. Factors like ad rates, audience engagement, and seasonality affect earnings. For most creators, it’s not a reliable income source.
Limited Revenue Streams: Relying solely on ad revenue isn’t sustainable. Diversifying income sources through affiliate marketing, merchandise sales, sponsorships, and other channels is essential.
Oversaturated Market: YouTube is flooded with content across practically every category. Standing out and building a sizable audience can be incredibly challenging when millions of creators are vying for attention.
Monetization Thresholds: To be eligible for ad revenue, a channel must meet specific requirements, including having 1,000 subscribers and 4,000 watch hours in the last 12 months. Achieving these milestones can take months or even years.
Burnout and Mental Health: The constant pressure to produce content, meet viewer expectations, and navigate the platform’s ups and downs can negatively impact creators’ mental health. Burnout is a genuine concern.
Advertisements
Fluctuating Ad Revenue: Even after reaching the monetization thresholds, ad revenue remains highly variable. Factors like ad rates, audience engagement, and seasonality affect earnings. For most creators, it’s not a reliable income source.
Time and Effort Investment: Producing high-quality content for YouTube demands significant time, effort, and attention. Contrary to popular belief, it’s often a full-time profession—from planning and filming to editing and promotion.
Competition and Copycats: Many content creators fall into the trap of imitating trends or styles to replicate successful material. Unfortunately, this lack of uniqueness adds to the intense competition and saturation.
Constant Algorithm Changes: The ever-evolving YouTube algorithm significantly impacts a channel’s reach and visibility. Adapting to these changes and staying relevant is an ongoing struggle, as what works today may not work tomorrow.
Remember, the illusion of easy money on YouTube often clashes with the complex realities faced by creators. It’s a journey filled with challenges, but for those who persevere, the rewards can be significant.
Advertisements
تحديات الربح من يوتيوب
Advertisements
بالنسبة لمنشئي الفيديو الطموحين الذين يرغبون في تحويل شغفهم إلى مهنة، غالباً ما يظهر يوتيوب كمنصة مثالية، إذ أن جاذبية الشهرة المفاجئة والنجاح المالي قوية تغذيها قصص مستخدمي يوتيوب الذين حققوا ملايين الدولارات ومع ذلك رغم هذه المغريات والمحفزات تكمن بعض الحقائق القاسية التي يجب على مستخدمي يوتيوب الطموحين مواجهتها
تقلب إيرادات الإعلانات: حتى بعد الوصول إلى حدود تحقيق الدخل، تظل إيرادات الإعلانات متغيرة إلى حد كبير، تؤثر عوامل مثل أسعار الإعلانات وتفاعل الجمهور على الأرباح، بالنسبة لمعظم منشئي المحتوى فهو ليس مصدر دخل موثوق
مصادر الإيرادات المحدودة: الاعتماد فقط على عائدات الإعلانات ليس أمراً مستداماً، ويعد تنويع مصادر الدخل من خلال التسويق بالعمولة ومبيعات البضائع والرعاية والقنوات الأخرى أمراً ضرورياً
الاكتظاظ الكثيف: يمتلئ موقع يوتيوب بالمحتوى عبر كل فئة تقريباً، يمكن أن يشكل التميز وبناء جمهور كبير تحدياً كبيراً عندما يتنافس الملايين من منشئي المحتوى على جذب الانتباه
حدود تحقيق الدخل: لكي تكون القناة مؤهلة للحصول على إيرادات الإعلانات يجب أن تستوفي متطلبات محددة، بما في ذلك أن يكون لديها ألف مشترك وأربعة آلاف ساعة مشاهدة في آخر إثني عشر شهر، قد يستغرق تحقيق هذه المعالم أشهراً أو حتى سنوات
الإرهاق وانخفاض المعنويات: الضغط المستمر لإنتاج المحتوى وتلبية توقعات المشاهدين والتنقل بين الصعود والهبوط يمكن أن يؤثر سلباً على معنويات منشئي المحتوى، الإرهاق هو مصدر قلق حقيقي
تقلب إيرادات الإعلانات: حتى بعد الوصول إلى حدود تحقيق الدخل تظل إيرادات الإعلانات متغيرة إلى حد كبير، تؤثر عوامل مثل أسعار الإعلانات وتفاعل الجمهور والموسمية على الأرباح، بالنسبة لمعظم منشئي المحتوى فهو لا يعتبر مصدر دخل موثوق
استثمار الوقت والجهد: يتطلب إنتاج محتوى عالي الجودة لموقع يوتيوب وقتاً وجهداً واهتماماً كبيراً، وخلافاً للاعتقاد السائد فهي غالباً ما تكون مهنة بدوام كامل بدءاً من التخطيط والتصوير وحتى التحرير والترويج
المنافسين والمقلدين: يقع العديد من منشئي المحتوى في فخ تقليد الاتجاهات أو الأساليب لتكرار المواد الناجحة، ولسوء الحظ فإن هذا الافتقار إلى التفرد يؤدي غالباً إلى فشل ذريع
التغييرات المستمرة في الخوارزميات: تؤثر خوارزمية يوتيوب المتطورة باستمرار بشكل كبير على مدى وصول القناة وإمكانية ظهورها، إن التكيف مع هذه التغييرات والبقاء على صلة بالواقع هو صراع مستمر لأن ما يصلح اليوم قد لا يصلح غداً
تذكر أن وهم الحصول على المال السهل على يوتيوب غالباً ما يتعارض مع الحقائق المعقدة التي يواجهها منشئو المحتوى، إنها رحلة مليئة بالتحديات ولكن بالنسبة لأولئك الذين يثابرون يمكن أن تكون المكافآت كبيرة
There is no doubt that earning huge monthly profits on YouTube is an interesting matter. These profits may reach $10,000 per month, but the most exciting thing is that you can collect these profits without spending much effort and time, and this is done by following strategies that will be discussed below.
1. Curate Creative Commons License Videos:
Find existing videos related to your niche that have a Creative Commons License. Compile and post them on your channel, giving proper attribution to the original creators. This allows you to start without creating videos from scratch.
Tips:
* Niche Down: Choose a specific topic you’re passionate about.
* Optimize SEO: Use YouTube Studio to track monthly estimated revenue and adjust your approach.
2. Channel Memberships:
Offer exclusive content and perks to paid members. This provides a consistent revenue stream.
3. Affiliate Marketing:
Promote products using affiliate links in your video descriptions. You earn commissions without producing videos.
Advertisements
4. Audio Podcasts on YouTube:
Create a podcast channel where you post audio content. Tap into the audience that prefers listening over watching.
5. Selling Merchandise:
Use your YouTube platform to sell branded merchandise directly to your viewers.
6. YouTube Premium Revenue:
Benefit from YouTube Premium subscribers who watch your content without ads.
7. YouTube Consultancy:
Share your expertise by offering YouTube strategy consultancy services.
8. Super Chat in Live Streams:
Encourage viewers to purchase Super Chat messages during your live streams for an interactive way to boost income.
Remember, you can tailor these strategies to your interests and skills. Whether you’re a budding content creator, affiliate marketer, or simply want to explore alternative content formats, there’s plenty of opportunity to turn your YouTube channel into a money-making machine!
Advertisements
استراتيجيات تحقيق أرباح شهرية ضخمة على اليوتيوب دون تصوير فيديوهات
Advertisements
لا شك أن تحقيق أرباح شهرية ضخمة على اليوتيوب أمر مثير للاهتمام قد تصل هذه الأرباح إلى عشرة آلاف دولار شهرياً، ولكن الأمر الأكثر إثارة هو أنه يمكنك تحصيل هذه الأرباح دون بذل الكثير من الجهد والوقت، أي دون الحاجة إلى أن تقوم بتصوير مقاطع فيديو خاصة بك ويتم ذلك من خلال اتباع الاستراتيجيات التي سيتم مناقشتها أدناه
: أولاً- تجميع مقاطع فيديو مرخصة للاستخدام العام
ابحث عن مقاطع الفيديو المرخصة للاستخدام التجاري ثم قم بتجميعها وانشرها على قناتك، مع إعطاء الإسناد المناسب لمنشئي المحتوى الأصليين، يتيح لك ذلك البدء دون إنشاء مقاطع فيديو من البداية
* اختيار موضوع القناة: اختر موضوعاً محدداً يثير شغفك ويلفت انتباه المشاهدين
* تحسين الظهور على محركات البحث: استخدم استوديو اليوتيوب لتتبع الإيرادات الشهرية المقدرة وضبط الأسلوب
: ثانياً- عضوية القناة
تقديم محتوى حصري وامتيازات للأعضاء المدفوعين وهذا يوفر تدفقاً ثابتاً للإيرادات
: ثالثاً- التسويق للغير
قم بالترويج للمنتجات باستخدام الروابط التابعة في أوصاف الفيديو الخاص بك فتكسب عمولات دون إنتاج مقاطع فيديو
Advertisements
: رابعاً- البودكاست الصوتي على اليوتيوب
أنشئ قناة بودكاست بحيث تنشر المحتوى الصوتي لتحقيق الاستفادة من الجمهور الذي يفضل الاستماع على المشاهدة
: خامساً- بيع البضائع
استخدم منصة يوتيوب الخاصة بك لبيع البضائع التي تحمل علامتك التجارية مباشرةً إلى مشاهديك
: سادساً- إيرادات يوتيوب بريميوم
استفد من مشتركي يوتيوب بريميوم الذين يشاهدون المحتوى الخاص بك بدون إعلانات
: سابعاً- استشارات يوتيوب
شارك خبراتك من خلال تقديم خدمات استشارية حول إستراتيجية سوبر تشات في مجموعات البث المباشر، شجع المشاهدين على شراء رسائل سوبر تشات أثناء البث المباشر الخاص بك للحصول على طريقة تفاعلية لزيادة الدخل
تذكر أنه يمكنك تصميم هذه الاستراتيجيات بما يتناسب مع اهتماماتك ومهاراتك، سواء كنت منشئ محتوى ناشئ أو مسوق للغير، أو ترغب ببساطة في استكشاف تنسيقات محتوى بديلة، فهناك الكثير من الفرص لتحويل قناتك على يوتيوب إلى آلة لكسب المال!
Starting and growing a YouTube channel on a low budget is an exciting venture.
Let’s dive into the details of how you can achieve this:
1. Start with an Idea
Before anything else, define your niche. What topics or content are you passionate about? Consider your interests, skills, and what you can offer to your potential audience. Having a clear idea will guide your content creation.
2. Value Content Over Equipment
Remember that audiences tune in for what you have to say, not the fancy equipment. While good production quality matters, it’s not the sole determinant of success. Use what you have and focus on creating engaging, valuable content.
3. Don’t Overthink the Results
Don’t get caught up in perfectionism. Start creating, even if you don’t have top-tier gear. Your early videos might not be flawless, but consistency matters more. Learn and improve along the way.
Advertisements
4. Keep Records of Your Spending
Even on a budget, some expenses are necessary. Prioritize wisely. Here are some essentials:
Camera Options:
Your Smartphone: Most smartphones have decent cameras. Experiment with features like slow motion and 4K recording.
Webcam: While not ideal, webcams can work for basic videos.
Audio Equipment:
Lavalier Microphone: Affordable and effective for clear audio.
Desktop USB Microphone: A step up from built-in laptop mics.
Lighting:
Natural Light: Position yourself near a window during daylight hours.
Affordable Lighting Options: Consider inexpensive studio lights or use your computer monitor.
5. Be Authentic
Your personality is your biggest asset. Connect with your audience by being genuine and relatable. Authenticity builds loyal subscribers.
Remember, YouTube success isn’t solely about equipment; it’s about delivering captivating content. So, start today, create consistently, and enjoy the journey!
Advertisements
إنشاء قناة على يوتيوب وتنميتها بميزانية منخفضة
Advertisements
يعد إنشاء قناة على يوتيوب وتنميتها بميزانية منخفضة بمثابة مشروع مثير للاهتمام خاصة بالنسبة للأشخاص يمتلكون كاريزما الظهور والتحدث أمام الكاميرات أو حتى للمهتمين بتجميع المقاطع ومعالجتها لتشكيل محتوى متميز
لنتعمق في تفاصيل كيفية تحقيق ذلك
انطلق من فكرة
قبل أي شيء آخر حدد الهدف من القناة، ما هي المواضيع أو المحتوى الذي أنت متحمس له، فكر في اهتماماتك ومهاراتك وما يمكنك تقديمه لجمهورك المحتمل، إن وجود فكرة واضحة سيوجه عملية إنشاء المحتوى الخاص بك بشكل أكثر دقة وفاعلية
المحتوى القيم أهم من المعدات والديكور
لا شك أن المعدات الجيدة والديكور الجذاب هي من عوامل لفت انتباه المشاهد ولكن الأهم من ذلك هو جودة المحتوى إذ أن عليك أن تتذكر أن الجمهور يستمع إلى ما تريد قوله وليس إلى مشاهدة المعدات الفاخرة، كما وتجنب التكرار أو التقليد وانفرد بمحتوى متميز خاص بك تفرض به أسلوبك ويميزك عن الآخرين
الاستمرارية
لابد لك من أن تبقى على اتصال دائم مع جمهورك وتجنب الابتعاد عنهم لفترات طويلة، حافظ على الاستمرارية فهي طريقك للحفاظ على متابعيك بل وتوسيع دائرة مجتمعك الخاص على يوتيوب
تصرف على طبيعتك
شخصيتك هي رصيدك لمحبة الناس لك، تواصل مع جمهورك من خلال أن تكون صادقاً وابق على اتصال دائم معهم وتبادل معهم الآراء والأفكار وتفاعل مع تعليقاتهم وتقبل النقد البناء، بذلك تبنى علاقة متينة معهم وتكسب احترامهم ومحبتهم
لا تبالغ في التفكير في النتائج
العدو الأكبر لبداية ناجحة في هذا المشروع هو التسرع والمبالغة في استعجال النتائج، قد لا تخلو مقاطع الفيديو المبكرة الخاصة بك من الأخطاء، ولكن ما يجعلك تستدرك تلك العيوب وتعمل على إصلاحها هو التنسيق والتنظيم
Advertisements
حدد الميزانية وفق الأولويات
ستتضمن ميزانية مشروع مثل إنشاء قناة يوتيوب قائمة بمعدات أساسية ضرورية لا غني عنها تتحدد حسب الأولويات نخص منها بالذكر
خيارات الكاميرا
هاتفك الذكي : تحتوي معظم الهواتف الذكية على كاميرات جيدة قم بتجربة ميزات مثل الحركة البطيئة *
4K والتسجيل بدقة
كاميرا الويب: على الرغم من أن كاميرات الويب ليست مثالية، إلا أنها يمكن أن تعمل مع مقاطع الفيديو الأساسية *
معدات الصوت
قليل التكلفة وفعال للحصول على صوت واضح : Lavalierميكروفون *
يعتبر الميكروفون المدمج خيار جيد للكمبيوتر المحمول : USBميكروفون *
الإضاءة
الضوء الطبيعي : ضع نفسك بالقرب من النافذة أثناء ساعات النهار
خيارات الإضاءة بأسعار معقولة : فكر في استخدام مصابيح الاستوديو غير المكلفة أو استخدم شاشة الكمبيوتر
وفي النهاية، تذكر أن نجاح قناة يوتيوب لا يقتصر على المعدات فقط بل يتعلق الأمر بتقديم محتوى جذاب، لذا ابدأ اليوم وابتكر باستمرار واستمتع بالرحلة فهي تستحق التجربة
Descript uses AI to transcribe, edit, and mix both audio and video content. It’s particularly useful for podcast conversions and streamlining content creation.
VidIQ is a comprehensive toolset designed to help creators, brands, and marketers understand their audience, navigate the YouTube algorithm, and grow their channels. Key features include:
Keyword Research: Find the most searched keywords in your niche to optimize video metadata.
Competitor Analysis: Analyze successful strategies used by competitors.
Trend Alerts: Stay informed about trending topics in your niche.
Video SEO Score: Get an SEO score for your videos and suggestions for improvement.
Channel Audit Tool: Receive a detailed report on your channel’s performance.
Productivity Tools: Bulk edit video descriptions, tags, annotations, and more.
AI Tools: Features like Daily Video Ideas, Title Generator, Description Generator, and YouTube Channel Name Generator leverage AI to enhance content creation.
TubeBuddy is a popular browser extension and mobile app that integrates directly with YouTube’s website. It offers various automation features, including topic ideas, trends, title and tag generation, and more. It’s a valuable tool for optimizing your channels and videos.
HeyGen is an AI-powered video generator that allows you to create studio-quality videos using AI-generated avatars and voices. Whether you’re a professional or a beginner, HeyGen makes video creation effortless and efficient. Here’s how it works:
Choose an Avatar:
Select from over 100+ AI avatars representing various ethnicities, ages, and styles.
You can even create your own custom avatar if you prefer.
Select a Voice:
HeyGen offers 300+ voices in different styles and languages.
These voices are generated by AI, infusing human-like intonation and inflections with exceptional accuracy.
Start with a Template or Create from Scratch:
Pick from an extensive array of ready-to-use templates for various scenarios.
Alternatively, begin with a clean slate and create your video from scratch.
Record Your Script or Use AI-Generated Text:
Type, speak, copy and paste, or use HeyGen’s AI to generate your script.
Effortlessly produce personalized outreach videos, content marketing videos, product marketing videos, and more.
Features for Scale:
Video Translator: Translate your videos seamlessly into other languages while maintaining your natural speaking style.
API Integration: Integrate HeyGen’s powerful AI capabilities into your product programmatically.
Veed is an AI-powered video editor that simplifies video editing directly in your browser. It offers features like auto-generated subtitles, text formatting, stock library access, screen recording, voice translations, and avatar creation.
it is a revolutionary AI-powered tool designed to simplify and streamline the content organization process for YouTube creators. By generating timestamped chapters automatically, the tool aims to enhance viewer experience, increase watch time, and drive channel growth. Creators can simply paste the YouTube URL for the video they want chapters created for, and the tool generates the chapters. It’s like having your very own virtual assistant for video editing!
Pikzels is the world’s first AI thumbnail generator that instantly transforms your ideas into stunning YouTube thumbnails. With Pikzels, you can create eye-catching thumbnails in under 30 seconds. Here’s how it works:
FaceSwap: Upload a picture of yourself, and watch as our AI smoothly swaps out the original face with yours, ensuring your audience instantly recognizes you.
Instant Thumbnails: Transform your ideas into captivating thumbnails within seconds.
Powered by AI: Experience fully automated thumbnail designs with Pikzels AI.
Generate from Links: Simply paste a link to a video’s thumbnail you like, and our AI recreates it.
Upcoming Features: Subscribers get early access to features like AI ideation and adding text to thumbnails.
Remember that while these tools can be incredibly helpful, creating engaging and valuable content remains essential for long-term channel growth. Happy YouTubing!
Advertisements
سبع أدوات للذكاء الاصطناعي يمكن أن تساعدك على تطوير قناتك على يوتيوب
Advertisements
قد يكون تطوير قناة على يوتيوب أمراً صعباً، ولكن هناك العديد من الأدوات التي تعمل بالذكاء الاصطناعي والتي يمكن أن تساعد المبدعين في تحسين محتواهم وتحسين قابلية الاكتشاف وتعزيز أداء القناة بشكل عام
فيما يلي بعض أدوات الذكاء الاصطناعي البارزة لمنشئي مقاطع اليوتيوب 1. Scrip AI
تستخدم هذه الأداة الذكاء الاصطناعي لنسخ وتحرير ومزج كل من محتوى الصوت والفيديو، إنه مفيد بشكل خاص لتحويلات البودكاست وتبسيط إنشاء المحتوى
2. VidIQ
هي مجموعة أدوات شاملة مصممة لمساعدة المبدعين والعلامات التجارية والمسوقين على فهم جمهورهم والتنقل في خوارزمية يوتيوب وتنمية قنواتهم، تشمل الميزات الرئيسية ما يلي الكلمات المفتاحية: ابحث عن الكلمات الرئيسية الأكثر بحثاً في محتوى قناتك لتحسين البيانات الوصفية للفيديو تحليل المنافسين: تحليل الاستراتيجيات الناجحة التي يستخدمها المنافسون تنبيهات التشابه: ابق على اطلاع بالموضوعات الشائعة الموازية لمحتوى قناتك
:بالفيديو SEO درجة
SEO احصل على درجة
لمقاطع الفيديو والاقتراحات الخاصة بك للتحسين محركات البحث
أداة تدقيق القناة: احصل على تقرير مفصل عن أداء قناتك أدوات الإنتاجية: تحرير واسع لأوصاف الفيديو والعلامات والتعليقات التوضيحية والمزيد أدوات الذكاء الاصطناعي: ميزات مثل أفكار الفيديو اليومية، ومولد العنوان، ومولد الوصف، ومولد اسم القناة على يوتيوب تستفيد من الذكاء الاصطناعي لتعزيز إنشاء المحتوى
3. TubeBuddy
وهو امتداد متصفح وتطبيق جوال شائع يتكامل مباشرة مع موقع يوتيوب، يقدم ميزات أتمتة مختلفة، بما في ذلك أفكار الموضوع والاتجاهات والعنوان وتوليد العلامات والمزيد، إنها أداة قيمة لتحسين قنواتك ومقاطع الفيديو الخاصة بك
4. HeyGen
وهو مولد فيديو يعمل بالذكاء الاصطناعي ويسمح لك بإنشاء مقاطع فيديو بجودة الاستوديو باستخدام الصور الرمزية والأصوات التي تم إنشاؤها بواسطة الذكاء الاصطناعي، سواء كنت محترفًا أو مبتدئًا، فإن هذه الأداة تجعل إنشاء الفيديو سهلاً وفعالًا، وإليك كيفية عملها
أ- اختر الأفتار
• اختر من بين أكثر من 100 صورة أفتار للذكاء الاصطناعي تمثل مختلف الأعراق والأعمار والأنماط
• يمكنك حتى إنشاء أفتار مخصص خاص بك إذا كنت تفضل ذلك
ب- اختر صوت
• تقدم هذه الأداة أكثر من 300 صوت بأنماط ولغات مختلفة
• يتم إنشاء هذه الأصوات بواسطة الذكاء الاصطناعي، مما يغرس التجويد والانعطافات الشبيهة بالإنسان بدقة استثنائية
ج- ابدأ بقالب أو أنشئ من الصفر
• اختر من بين مجموعة واسعة من القوالب الجاهزة للاستخدام لسيناريوهات مختلفة
• بدلاً من ذلك، ابدأ بسجل فارغ وقم بإنشاء مقطع فيديو من الصفر
د- سجل نصك أو استخدم النص الذي تم إنشاؤه بواسطة الذكاء الاصطناعي
• اكتب وتحدث وانسخ والصق أو استخدم الذكاء الاصطناعي لـ HeyGen لإنشاء نصك
• مترجم الفيديو: ترجمة مقاطع الفيديو الخاصة بك بسلاسة إلى لغات أخرى مع الحفاظ على أسلوب التحدث الطبيعي
• تكامل واجهة برمجة التطبيقات: دمج قدرات هذه الأداة في منتجك بشكل برمجي
Advertisements
5. Veed
وهو محرر فيديو يعمل بالذكاء الاصطناعي يبسط تحرير الفيديو مباشرة في متصفحك، يقدم ميزات مثل الترجمات التي تم إنشاؤها تلقائيًا، وتنسيق النصوص، والوصول إلى مكتبة المخزون، وتسجيل الشاشة، والترجمات الصوتية، وإنشاء الأفتار
6. Instant Chapters
إنها أداة ثورية تعمل بالذكاء الاصطناعي مصممة لتبسيط عملية تنظيم المحتوى لمنشئي محتوى يوتيوب من خلال إنشاء فصول مخططة زمنيًا تلقائيًا، تهدف الأداة إلى تعزيز تجربة المشاهد وزيادة وقت المشاهدة ودفع نمو القناة،
URL كما ويمكن للمنشئين ببساطة لصق عنوان
على يوتيوب للفيديو المراد إنشاء فصول له، ثم تتولى هذه الأداة توليد الفصول، إنه مثل امتلاك مساعدك الافتراضي الخاص لتحرير الفيديو
Pikzels7.
وهو أول مولد مصغر للذكاء الاصطناعي في العالم يحول أفكارك على الفور إلى صور مصغرة مذهلة على يوتيوب، باستخدام هذه الأداة يمكنك إنشاء صور مصغرة لافتة للنظر في أقل من 30 ثانية
إليك كيفية عملها
• تحويل الوجه: قم بتحميل صورتك الشخصية وشاهد بينما يقوم الذكاء الاصطناعي الخاص بنا بتبديل وجهك الأصلي بسلاسة مما يضمن التعرف عليك على الفور
• الصور المصغرة الفورية: حوّل أفكارك إلى صور مصغرة جذابة في غضون ثوانٍ
• مدعوم بالذكاء الاصطناعي: تجربة تصميمات الصور المصغرة الآلية بالكامل
• أنشئ من الروابط: ما عليك سوى لصق رابط إلى الصورة المصغرة التي تحبها للفيديو ويعيد الذكاء الاصطناعي الخاص بنا إنشائه
• الميزات القادمة: يحصل المشتركون على وصول مبكر إلى ميزات مثل التفكير في الذكاء الاصطناعي وإضافة نص إلى الصور المصغرة
تذكر أنه في حين أن هذه الأدوات يمكن أن تكون مفيدة بشكل لا يصدق فهي تختصر كثيراً من الوقت والجهد ولاسيما إنشاء محتوى جذاب وقيم يظل ضرورياً لنمو القناة على المدى الطويل
Stepping into the entrepreneurial arena, you’re armed with dreams and the drive to make them a reality. Yet, the landscape of small business ownership is fraught with unexpected challenges that test your resilience. Being prepared is not just advantageous; it’s crucial for navigating through these trials and emerging stronger. In this article, we will explore essential strategies to construct a resilient safety net that bolsters your small business’s stability and growth.
Laying the Financial Foundation
The journey to financial resilience begins with crafting a meticulous budget. This foundational step is vital for a thorough understanding of your financial inflows and outflows, enabling effective management of cash flow and resource allocation. Adherence to this budget fosters a discipline that is indispensable in avoiding financial missteps and ensuring your business remains on solid ground.
Building a Buffer with an Emergency Fund
An emergency fund acts as a financial lifeline during unforeseen circumstances. By setting aside a reserve to cover unexpected expenses or to provide support during revenue downturns, you afford your business a buffer against financial shocks. This strategic reserve not only offers peace of mind but also ensures the continuity of your operations, regardless of the challenges encountered.
Enhancing Protection with a Home Warranty
For entrepreneurs operating from home, adding a home warranty to your insurance coverage provides an additional safety layer. This warranty covers the repair or replacement costs of critical systems and appliances, mitigating the financial impact of unexpected failures. Get started now with integrating a home warranty into your business plan so you can ensure uninterrupted operations, safeguarding your livelihood against unforeseen disruptions.
Financial Goal Setting
Setting specific financial goals is a critical step toward securing your business’s future. Whether aiming to expand your offerings, grow your market presence, or hit specific revenue targets, having concrete objectives provides direction and motivation. Developing a strategic plan to achieve these goals is instrumental in driving your business forward, ensuring each step taken is aligned with your overarching vision.
Advertisements
Prudent Use of Company Credit
Company credit cards, when used judiciously, serve as a powerful tool in managing your business’s finances. They facilitate timely expense management and offer an opportunity to build a positive credit history. However, the discipline to pay off balances promptly each month is crucial to avoid the pitfalls of debt accumulation, ensuring credit remains an asset rather than a liability.
Keeping Informed About Tax Regulations
Staying informed about tax regulations is imperative for minimizing liabilities and maximizing potential savings. A deep understanding of tax laws allows you to navigate the complex tax landscape effectively, ensuring you leverage every opportunity to benefit your business financially. Engaging with tax professionals or utilizing online resources are proactive steps in staying ahead of tax obligations and optimizing your financial strategy.
Ensuring Financial Integrity through Audits
Regular financial audits are essential for protecting your business’s financial well-being, providing valuable insights into inefficiencies, risks, and areas for improvement. These audits enable timely adjustments to financial strategies, ensuring alignment with business goals and objectives. Despite the initial apprehension that auditing may provoke, it serves as a crucial practice for upholding transparency and accountability in financial operations. By embracing regular audits, businesses can proactively identify and address potential issues before they escalate, fostering long-term stability and growth. In essence, conducting financial audits is a proactive approach to safeguarding the financial health and integrity of your business.
Fortifying your small business with a comprehensive safety net is a proactive approach to securing its longevity and prosperity. By implementing the strategies outlined above, you equip your business to withstand the vicissitudes of the entrepreneurial world, ensuring it not only survives but thrives. Take the initiative today to reinforce your business’s defenses, laying the groundwork for a resilient and successful future.
Discover how Data World Consulting Group can transform your data science journey and digital marketing strategies.
Advertisements
حماية المشاريع الصغيرة – بناء شبكة أمان قوية
Advertisements
عند دخولك في مجال ريادة الأعمال ستكون مسلحاً بالأحلام والدافع لتحقيقها ومع ذلك فإن مشهد ملكية الأعمال الصغيرة محفوف بالتحديات غير المتوقعة التي تختبر حسن تعاملك مع هذه التحديات
إن الاستعداد ليس مفيدًا فحسب؛ بل إنه أمر بالغ الأهمية للانتقال عبر هذه التجارب والخروج بشكل أقوى
في هذه المقالة سوف نستكشف الاستراتيجيات الأساسية لبناء شبكة أمان مرنة تعزز استقرار ونمو أعمالك الصغيرة
وضع الأساس المالي
تبدأ الرحلة إلى المرونة المالية بصياغة ميزانية دقيقة، تعد هذه الخطوة التأسيسية أمراً حيوياً لفهم التدفقات المالية الداخلة والخارجة بشكل شامل مما يتيح الإدارة الفعالة للتدفقات النقدية وتخصيص الموارد، إن الالتزام بهذه الميزانية يعزز الانضباط الذي لا غنى عنه لتجنب الأخطاء المالية وضمان بقاء عملك على أرض صلبة
اتخاذ خطوات احترازية مع صندوق الطوارئ
يعمل صندوق الطوارئ بمثابة شريان الحياة المالي خلال الظروف غير المتوقعة من خلال تخصيص احتياطي لتغطية النفقات غير المتوقعة أو لتقديم الدعم أثناء فترات تراجع الإيرادات فإنك توفر لشركتك حاجزاً ضد الصدمات المالية، لا يوفر هذا الاحتياطي الاستراتيجي راحة البال فحسب بل يضمن أيضاً استمرارية عملياتك بغض النظر عن التحديات التي تواجهها.
تعزيز الحماية من خلال ضمان المنزل
بالنسبة لأصحاب المشاريع الذين يعملون من المنزل فإن إضافة ضمان المنزل إلى التغطية التأمينية الخاصة بك يوفر طبقة أمان إضافية، يغطي هذا الضمان تكاليف إصلاح أو استبدال الأنظمة والأجهزة المهمة مما يخفف من التأثير المالي للأعطال غير المتوقعة، ابدأ الآن بدمج ضمان المنزل في خطة عملك حتى تتمكن من ضمان عدم انقطاع العمليات وحماية مصدر رزقك من الاضطرابات غير المتوقعة
تحديد الأهداف المالية
يعد تحديد أهداف مالية محددة خطوة حاسمة نحو تأمين مستقبل عملك سواء كنت تهدف إلى توسيع عروضك أو تنمية تواجدك في السوق أو تحقيق أهداف إيرادات محددة فإن وجود أهداف ملموسة يوفر التوجيه والتحفيز، يعد تطوير خطة استراتيجية لتحقيق هذه الأهداف أمراً أساسياً في دفع أعمالك إلى الأمام مما يضمن أن كل خطوة يتم اتخاذها تتماشى مع رؤيتك الشاملة
Advertisements
الاستخدام الحكيم لائتمان الشركة
تعمل بطاقات الائتمان الخاصة بالشركة عند استخدامها بحكمة كأداة قوية في إدارة الشؤون المالية لشركتك، إنها تسهل إدارة النفقات في الوقت المناسب وتوفر فرصة لبناء سجل ائتماني إيجابي، ومع ذلك فإن الانضباط لسداد الأرصدة على الفور كل شهر أمر بالغ الأهمية لتجنب مخاطر تراكم الديون وضمان أن يظل الائتمان أصلاً وليس التزاماً
البقاء على علم باللوائح الضريبية
يعد البقاء على اطلاع باللوائح الضريبية أمراً ضرورياً لتقليل الالتزامات وتعظيم المدخرات المحتملة، يتيح لك الفهم العميق لقوانين الضرائب التنقل في المشهد الضريبي المعقد بفعالية مما يضمن الاستفادة من كل فرصة لإفادة عملك مالياً، يعد التعامل مع متخصصي الضرائب أو استخدام الموارد عبر الإنترنت خطوات استباقية في استباق الالتزامات الضريبية وتحسين إستراتيجيتك المالية
ضمان النزاهة المالية من خلال عمليات التدقيق
تعد عمليات التدقيق المالي المنتظمة ضرورية لحماية الرفاهية المالية لشركتك وتوفير رؤى قيمة حول أوجه القصور والمخاطر ومجالات التحسين، تتيح عمليات التدقيق هذه إجراء تعديلات في الوقت المناسب على الاستراتيجيات المالية مما يضمن التوافق مع أهداف وغايات العمل، على الرغم من المخاوف الأولية التي قد تثيرها عملية التدقيق إلا أنها بمثابة ممارسة حاسمة لدعم الشفافية والمساءلة في العمليات المالية، ومن خلال تبني عمليات تدقيق منتظمة يمكن للشركات تحديد المشكلات المحتملة ومعالجتها بشكل استباقي قبل تفاقمها مما يعزز الاستقرار والنمو على المدى الطويل، في جوهر الأمر يعد إجراء عمليات التدقيق المالي نهجاً استباقياً لحماية السلامة المالية لشركتك وسلامتها
يعد تعزيز أعمالك الصغيرة بشبكة أمان شاملة بمثابة نهج استباقي لضمان استمراريتها وازدهارها، من خلال تنفيذ الاستراتيجيات الموضحة أعلاه فإنك تقوم بتجهيز عملك لتحمل تقلبات عالم ريادة الأعمال مما يضمن ليس فقط بقائه على قيد الحياة ولكن أيضاً ازدهاره، خذ زمام المبادرة اليوم لتعزيز دفاعات عملك ووضع الأساس لمستقبل مرن وناجح
اكتشف كيف يمكن لمجموعة
Data World Consulting Group
تحويل رحلة علم البيانات واستراتيجيات التسويق الرقمي الخاصة بك
There is no doubt that creating a professional intro for YouTube clips has a major role in the overall success of the video, given what it leaves the viewer with as a first impression, and through it you will be able to retain viewers and make them quickly learn about your brand and the services you provide.
Here are six steps to help you create an effective intro:
Preparing the content by writing the script: Plan your intro in advance. Write a concise script that introduces your channel, topic, and what viewers can expect. A well-prepared script ensures a smooth delivery.
Get used to appearing in front of the camera relaxed: Practice makes perfect! Familiarize yourself with your camera or recording device. Relax, be natural, and avoid appearing stiff. Authenticity resonates with viewers.
Interest in video editing: Basic video editing skills are essential. Learn how to trim clips, add transitions, and incorporate text overlays. Tools like Placeit, InVideo, or VideoHive can simplify this process.
The effects and transitions that are added to the video play an effective role in attracting attention and enjoying watching the video, and even help greatly in conveying the idea to be conveyed to the recipient easily and simply.
Advertisements
Beautiful, spontaneous scene: Your intro should set the tone for your video. Use captivating visuals, such as eye-catching graphics or footage related to your content. Consider using tools like Canva to create visually appealing elements.
The spontaneity of the scene and the absence of artificiality is a main reason for attracting viewers, and this helps maintain followers of the channel
Make sure the sound is clear: Don’t underestimate the importance of audio! Clear and crisp sound enhances the overall quality of your video. Invest in a decent microphone and ensure your voice or background music is well-balanced.
You must be well aware that no matter how beautiful the content and the great performance in the video are, it will be of no use if the sound is poor. Integration between sound and image quality is a fundamental reason for the success of the video.
Choose the appropriate music for the content: Background music sets the mood. Choose music that aligns with your content—whether it’s upbeat, dramatic, or calming. Remember to use royalty-free tracks to avoid copyright issues.
In conclusion: Remember, your intro should be concise (usually under 10 seconds) and leave viewers eager to see more!
Advertisements
ما أهمية إنشاء فيديو احترافي من أجل بداية مثالية لقناتك على يوتيوب
Advertisements
لا شك أن إنشاء مقدمة احترافية لمقاطع اليوتيوب لها دور كبير في نجاح الفيديو بشكل عام، نظرا لما تتركه عند المشاهد كانطباع أولي، ومن خلاله ستتمكن من الاحتفاظ بالمشاهدين وجذب آخرين بشكل سريع فتمكنهم من التعرف على علامتك التجارية والخدمات التي تقدمها
فيما يلي ست خطوات تساعدك على إنشاء مقدمة احترافية وفعالة
إعداد المحتوى عن طريق كتابة السيناريو: قم بالتخطيط للإنترو الخاص بك مسبقاً، اكتب نصاً موجزاً يقدم قناتك وموضوعك وما يمكن أن يتوقعه المشاهدون
اعتد على الظهور أمام الكاميرا بأريحية: التدريب يرفع من ثقة المرء بنفسه، تعرف على الكاميرا أو جهاز التسجيل الخاص بك، استرخي وكن طبيعياً وتجنب الظهور بمظهر المتصلب، الاحترافية والثقة تترك صدى إيجابي لدى المشاهدين
الاهتمام بمونتاج الفيديو: مهارات مونتاج الفيديو الأساسية ضرورية، تعرف على كيفية قص المقاطع وإضافة انتقالات ودمج تراكبات النص، يمكن لأدوات مثل Placeit أو InVideo أو VideoHive تبسيط هذه العملية
المؤثرات والانتقالات التي تضاف للفيديو تلعب دوراً فعالاً في جذب الانتباه والاستمتاع بمشاهدة الفيديو، بل وتساعد بشكل كبير في إيصال الفكرة إلى المتلقي بسهولة وبساطة
Advertisements
مشهد جميل وعفوي: يجب أن تحدد المقدمة نغمة الفيديو الخاص بك، استخدم عناصر مرئية جذابة، مثل الرسومات الجذابة أو اللقطات المرتبطة بالمحتوى الخاص بك، فكر في استخدام أدوات مثل كانفا لإنشاء عناصر جذابة بصرياً
عفوية المشهد وغياب التصنع سبب رئيسي في جذب المشاهدين وهذا يساعد في الحفاظ على متابعين القناة
تأكد من صفاء الصوت ووضوحه: لا تقلل من أهمية الصوت، يعمل الصوت النقي والواضح على تحسين الجودة الإجمالية للفيديو الخاص بك، استعمل ميكروفون عالي الجودة وتأكد من توازن صوتك وموسيقى الخلفية بشكل جيد
يجب أن تدرك جيداً أنه مهما كان المحتوى جميلاً والأداء الرائع في الفيديو، فلن يكون له أي فائدة إذا كان الصوت ضعيفاً، التكامل بين جودة الصوت والصورة هو سبب أساسي لنجاح الفيديو
اختر الموسيقى المناسبة للمحتوى: موسيقى الخلفية تحدد الحالة المزاجية، اختر الموسيقى التي تتوافق مع المحتوى الخاص بك، سواء كانت مبهجة أو درامية أو مهدئة، تذكر استخدام الوسائط الخالية من حقوق الملكية لتجنب مشكلات حقوق الطبع والنشر.
في الختام: تذكر أن المقدمة يجب أن تكون موجزة (عادةً أقل من 10 ثوانٍ) وتترك المشاهدين متشوقين لرؤية المزيد
When digital data reigns supreme, small business owners must confront the significant challenge of safeguarding sensitive customer information. This responsibility, crucial for sustaining trust and profitability, requires a well-thought-out strategy and proactive measures. This guide from Data World Consulting Group delves into actionable steps aimed at strengthening data security, providing a solid defense against the constantly changing landscape of cyber threats.
Digital File Management and Robust Password Practices
Transitioning to digital files not only modernizes your data storage but also enhances security. It’s imperative to safeguard these digital assets with strong, complex passwords. Creating unique passwords for different files and regularly updating them can significantly reduce the risk of unauthorized access. This practice serves as a first line of defense, ensuring that sensitive information remains protected from potential breaches.
Invest in Advanced IT Education
Grasping the intricacies of information technology, encompassing key areas such as logic, architecture, data structures, and artificial intelligence, is crucial for navigating today’s digital landscape. Enhancing your expertise in these domains, perhaps through the process of an online degree in computer science, empowers you to devise and execute robust data security protocols. This deepened understanding not only allows you to foresee and mitigate potential vulnerabilities but also equips you to develop adaptive strategies that safeguard your data against the ever-evolving nature of cyber threats.
Advertisements
Implement Essential Cybersecurity Tools
Firewall and antivirus software act as fundamental barriers against cyber threats. These tools monitor and control incoming and outgoing network traffic based on predetermined security rules, offering a primary defense against unauthorized access. Regular updates and maintenance of these systems are crucial in ensuring they remain effective against the latest cyber threats.
Establish a Dedicated IT Department
Having a specialized IT department brings focused expertise to the management and security of your digital assets. These professionals stay abreast of the latest cybersecurity trends and threats, ensuring that your business’s data is protected with the most current and effective strategies. Their expertise is invaluable in both preventing data breaches and responding effectively if one occurs.
Prioritize Trustworthy Staff Recruitment
Employees are a critical factor in upholding a secure data environment. Recruiting individuals who demonstrate high levels of integrity and responsibility is key to ensuring that your data is managed with the highest level of attention and care. Enhanced security measures, such as comprehensive background checks and consistent training in data security, elevate the trustworthiness and capability of your team in protecting sensitive information. Additionally, fostering a culture of security awareness among staff contributes to a vigilant and proactive approach to data protection.
Develop an Efficient Filing System
Maintaining a meticulously structured filing system plays a pivotal role in reducing risks tied to data management. Such a system enhances the efficiency of retrieving information while simultaneously diminishing the likelihood of inadvertent data breaches.
Through careful labeling and secure storage of data, you guarantee that sensitive information remains within the reach of only those who are authorized, thus strengthening your data security framework. This methodical organization also aids in tracking data access and modifications, providing an additional layer of security and oversight.
The path to robust data security for small business owners is an ongoing and challenging endeavor. By integrating digital solutions, investing in IT education, utilizing strategic cybersecurity tools, and focusing on the recruitment of trustworthy staff, you establish a formidable shield against data breaches. This comprehensive approach does more than just protect your customers’ information; it lays a solid foundation for the long-term success and reputation of your business.
Advertisements
الحماية الفعالة للبيانات : الاستراتيجيات الرئيسية للشركات الصغيرة
Advertisements
عندما تشكل البيانات العصب الأساسي لبنية الأعمال عندها يجب على أصحاب الأعمال الصغيرة مواجهة التحدي الكبير المتمثل في حماية معلومات العملاء الحساسة، وتتطلب هذه المسؤولية البالغة الأهمية للحفاظ على الثقة والربحية استراتيجية مدروسة جيدا وتدابير استباقية
الخطوات القابلة للتنفيذ والتي تهدف إلى تعزيز أمن البيانات، وتوفير دفاع قوي ضد المشهد المتغير باستمرار للتهديدات الإلكترونية
إدارة الملفات الرقمية ومدى فاعلية كلمة المرور القوية
لا يؤدي الانتقال إلى الملفات الرقمية إلى تحديث تخزين البيانات فحسب بل يعزز الأمان أيضًا فمن الضروري حماية هذه الأصول الرقمية بكلمات مرور قوية ومعقدة، يمكن أن يؤدي إنشاء كلمات مرور فريدة لملفات مختلفة وتحديثها بانتظام إلى تقليل مخاطر الوصول غير المصرح به بشكل كبير إذ يتولى هذا الإجراء دور خط دفاع أول مما يضمن بقاء المعلومات الحساسة محمية من الانتهاكات المحتملة
استثمر في التعليم المتقدم لتكنولوجيا المعلومات
يعد استيعاب تعقيدات تكنولوجيا المعلومات التي تشمل المجالات الرئيسية مثل المنطق والهندسة المعمارية وهياكل البيانات والذكاء الاصطناعي أمراً بالغ الأهمية للتنقل في المشهد الرقمي اليوم حيث إن تعزيز خبرتك في هذه المجالات ربما من خلال عملية الحصول على درجة علمية عبر الإنترنت في علوم الكمبيوتر يمكّنك من ابتكار وتنفيذ بروتوكولات قوية لأمن البيانات، فلا يسمح لك هذا الفهم العميق بالتنبؤ بنقاط الضعف المحتملة والتخفيف منها فحسب بل يجهزك أيضاً لتطوير استراتيجيات تكيفية تحمي بياناتك من الطبيعة المتطورة باستمرار للتهديدات الإلكترونية
تنفيذ أدوات الأمن السيبراني الأساسية
يعمل برنامج جدار الحماية ومكافحة الفيروسات كحاجز أساسي ضد التهديدات الإلكترونية بحيث يراقب حركة المرور القادمة والصادرة للشبكة ويتحكم فيها بناءً على قواعد أمنية محددة مسبقاً مما يوفر دفاعاً أولياً ضد الوصول غير المصرح به، تعد التحديثات المنتظمة لهذه الأنظمة وصيانتها أمراً بالغ الأهمية لضمان بقائها فعالة في مواجهة أحدث التهديدات الإلكترونية
إنشاء إدارة مخصصة لتكنولوجيا المعلومات
يوفر وجود قسم متخصص لتكنولوجيا المعلومات خبرة مركزة لإدارة وأمن قواعد البيانات الرقمية فيظل هؤلاء المحترفون على اطلاع بأحدث اتجاهات وتهديدات الأمن السيبراني مما يضمن حماية بيانات عملك بأحدث الاستراتيجيات وأكثرها فعالية فخبرتهم لا تقدر بثمن في منع انتهاكات البيانات والاستجابة بفعالية إذا حدث ذلك
Advertisements
إعطاء الأولوية لتعيين موظفين جديرين بالثقة
يعتبر الموظفون عاملاً حاسماً في الحفاظ على بيئة بيانات آمنة بحيث يُعد تعيين الأفراد الذين يظهرون مستويات عالية من النزاهة والمسؤولية أمراً أساسياً لضمان إدارة بياناتك بأعلى مستوى من الاهتمام والرعاية، فترفع التدابير الأمنية المعززة مثل الفحص الشامل للخلفية والتدريب المتسق في أمن البيانات من مصداقية وقدرة فريقك على حماية المعلومات الحساسة وبالإضافة إلى ذلك فإن تعزيز ثقافة الوعي الأمني بين الموظفين يسهم في اتباع نهج يقظ واستباقي لحماية البيانات
تطوير نظام ملفات فعال
يلعب الحفاظ على نظام ملفات منظم بدقة دوراً محورياً في تقليل المخاطر المرتبطة بإدارة البيانات ويعزز هذا النظام كفاءة استرجاع المعلومات مع التقليل في الوقت نفسه من احتمال حدوث انتهاكات غير مقصودة للبيانات
من خلال وضع العلامات الدقيقة والتخزين الآمن للبيانات فإنك تضمن أن المعلومات الحساسة تظل في متناول أولئك المصرح لهم فقط وبالتالي تعزيز إطار أمن البيانات الخاص بك وتساعد هذه المنظمة المنهجية أيضا في تتبع الوصول إلى البيانات والتعديلات مما يوفر طبقة إضافية من الأمن والرقابة
يعد الطريق إلى أمن بيانات قوي لأصحاب الأعمال الصغيرة مسعى مستمراً وصعباً من خلال دمج الحلول الرقمية والاستثمار في تعليم تكنولوجيا المعلومات والاستفادة من أدوات الأمن السيبراني الاستراتيجية والتركيز على تعيين موظفين جديرين بالثقة فإنك تنشئ درعًا هائلاً ضد انتهاكات البيانات هذا النهج الشامل يفعل أكثر من مجرد حماية معلومات عملائك بل إنه يضع أساساً صلباً لنجاح وسمعة عملك على المدى الطويل
Technology has revolutionized the way that businesses operate, but it has also made them more susceptible to data breaches and other risks. Data governance is one way that companies can protect their data and ensure that it is being used properly.
This article shared by Data World Consulting Group will provide an overview of what data governance is and how it can benefit small businesses. Implementing effective data governance practices can not only safeguard sensitive information but also enhance trust with customers and comply with regulatory requirements.
Define Its Role and Importance
Data governance is the process of establishing policies, procedures, and standards for managing data within an organization. It involves defining who has access to certain types of data, as well as how it should be collected, stored, and used. Data governance helps organizations ensure that their data is secure and up-to-date, while also protecting them from potential liabilities associated with improper use or storage of customer information.
Impact of Data on Risk Mitigation
Data governance helps reduce the risk profile of a business by ensuring that sensitive information is protected and stored properly. It also helps to reduce the chances of a data breach occurring by limiting who has access to certain types of data and requiring security controls such as encryption and regular backups. By implementing data governance policies, businesses can be sure that they are protecting their customer’s information as well as their own assets. Additionally, effective data governance enhances transparency and accountability, building trust with stakeholders.
The Role of Digital CRM Tools
Data governance empowers businesses to gain deeper insights into their customers using advanced digital tools like CRM (Customer Relationship Management) software and options related to customer data management. By leveraging this software, businesses can effortlessly monitor customer interactions, leading to more personalized marketing campaigns and enhanced communication. Moreover, this software enables businesses to analyze customer behavior, facilitating informed decision-making for future strategies.
Advertisements
Guiding the Construction of Business Strategies
Data governance not only aids businesses in gaining a deeper understanding of their customers but also offers invaluable insights into constructing strategies that optimize efficiency and profitability. By analyzing customer behavior patterns through various methods like surveys or A/B testing, businesses can devise more effective strategies for targeting specific audiences and launching new products or services. With the right data governance framework in place, companies can ensure the privacy and security of customer data, fostering trust and loyalty among their clientele.
Advancing Stakeholder Awareness and Consent
Data governance helps improve understanding between stakeholders by providing clear guidelines on how different departments should handle various types of information within the organization. This level of understanding leads to increased acceptance among stakeholders, which ultimately leads to greater collaboration between teams when tackling problems or developing new strategies together. In addition, effective data governance enhances data security and mitigates risks associated with data breaches.
Upsides of Enhanced Departmental Collaboration
When stakeholders have a greater understanding of each other’s roles within the organization through proper data governance practices, they are able to collaborate more effectively on projects involving multiple departments. This collaboration not only increases efficiency but also allows departments to leverage each other’s strengths to produce higher-quality results. By working together, they can drive innovation and achieve shared objectives, fostering a culture of success within the organization.
Data governance is an important tool for small businesses looking for ways to protect themselves from potential liabilities associated with improper use or storage of customer info while also improving collaboration among various departments within the organization for maximum efficiency gains & profitability increases in long-term projects & initiatives alike — making it essential for modern-day success rate amongst aspiring entrepreneurs!
Advertisements
مفاتيح نمو المشاريع الصغيرة وحمايتها
Advertisements
لقد أحدثت التكنولوجيا ثورة في الطريقة التي تعمل بها الشركات ولكنها جعلتها أيضًا أكثر عرضة لانتهاكات البيانات والمخاطر الأخرى، تعد حوكمة البيانات إحدى الطرق التي يمكن للشركات من خلالها حماية بياناتها والتأكد من استخدامها بشكل صحيح
نظرة عامة حول ماهية إدارة البيانات وكيف يمكن أن تفيد الشركات الصغيرة
لا يؤدي تطبيق ممارسات حوكمة البيانات الفعالة إلى حماية المعلومات الحساسة فحسب، بل يعزز أيضًا الثقة مع العملاء والامتثال للمتطلبات التنظيمية
تحديد دورها وأهميتها
حوكمة البيانات هي عملية وضع السياسات والإجراءات والمعايير لإدارة البيانات داخل المؤسسة ويتضمن تحديد من يمكنه الوصول إلى أنواع معينة من البيانات بالإضافة إلى كيفية جمعها وتخزينها واستخدامها
تساعد حوكمة البيانات المؤسسات على ضمان أن بياناتها آمنة وحديثة مع حمايتها أيضًا من الالتزامات المحتملة المرتبطة بالاستخدام غير السليم أو تخزين معلومات العملاء
تأثير البيانات على تخفيف المخاطر
تساعد حوكمة البيانات على تقليل المخاطر التي تتعرض لها الأعمال من خلال ضمان حماية المعلومات الحساسة وتخزينها بشكل صحيح، كما أنه يساعد على تقليل فرص حدوث خرق للبيانات عن طريق تحديد من يمكنه الوصول إلى أنواع معينة من البيانات وطلب ضوابط أمنية مثل التشفير والنسخ الاحتياطي المنتظم، ومن خلال تنفيذ سياسات إدارة البيانات يمكن للشركات التأكد من أنها تحمي معلومات عملائها بالإضافة إلى أصولها الخاصة بالإضافة إلى ذلك تعمل الإدارة الفعالة للبيانات على تعزيز الشفافية والمساءلة وبناء الثقة مع أصحاب المصلحة
دور أدوات إدارة علاقات العملاء الرقمية
تُمكّن حوكمة البيانات الشركات من الحصول على رؤى أعمق حول عملائها باستخدام أدوات رقمية متقدمة
(إدارة علاقات العملاء) CRM مثل برنامج
والخيارات المتعلقة بإدارة بيانات العملاء، ومن خلال الاستفادة من هذا البرنامج يمكن للشركات مراقبة تفاعلات العملاء دون عناء مما يؤدي إلى حملات تسويقية أكثر تخصيصًا وتعزيز الاتصالات
علاوة على ذلك يمكّن هذا البرنامج الشركات من تحليل سلوك العملاء وتسهيل اتخاذ القرارات المستنيرة للاستراتيجيات المستقبلية
Advertisements
توجيه بناء استراتيجيات الأعمال
لا تساعد حوكمة البيانات الشركات في اكتساب فهم أعمق لعملائها فحسب بل توفر أيضًا رؤى لا تقدر بثمن في بناء الاستراتيجيات التي تعمل على تحسين الكفاءة والربحية
من خلال تحليل أنماط سلوك العملاء من خلال أساليب مختلفة مثل الدراسات الاستقصائية أو اختبار أ/ب، يمكن للشركات وضع استراتيجيات أكثر فعالية لاستهداف جماهير محددة وإطلاق منتجات أو خدمات جديدة ومع وجود الإطار الصحيح لإدارة البيانات يمكن للشركات ضمان خصوصية وأمن بيانات العملاء وتعزيز الثقة والولاء بين عملائها
تعزيز وعي وموافقة أصحاب المصلحة
تساعد حوكمة البيانات على تحسين التفاهم بين أصحاب المصلحة من خلال توفير إرشادات واضحة حول كيفية تعامل الأقسام المختلفة مع أنواع مختلفة من المعلومات داخل المنظمة
يؤدي هذا المستوى من الفهم إلى زيادة القبول بين أصحاب المصلحة مما يؤدي في النهاية إلى تعاون أكبر بين الفرق عند معالجة المشكلات أو تطوير استراتيجيات جديدة معًا، بالإضافة إلى ذلك تعمل حوكمة البيانات الفعالة على تعزيز أمن البيانات وتخفيف المخاطر المرتبطة بانتهاكات البيانات
إيجابيات تعزيز التعاون بين الإدارات
عندما يكون لدى أصحاب المصلحة فهم أكبر لأدوار بعضهم البعض داخل المنظمة من خلال ممارسات إدارة البيانات المناسبة فإنهم يكونون قادرين على التعاون بشكل أكثر فعالية في المشاريع التي تشمل أقسام متعددة ولا يؤدي هذا التعاون إلى زيادة الكفاءة فحسب بل يسمح أيضًا للإدارات بالاستفادة من نقاط القوة لدى بعضها البعض لتحقيق نتائج ذات جودة أعلى ومن خلال العمل معًا يمكنهم دفع الابتكار وتحقيق الأهداف المشتركة وتعزيز ثقافة النجاح داخل المنظمة
تعد حوكمة البيانات أداة مهمة للشركات الصغيرة التي تبحث عن طرق لحماية نفسها من المسؤوليات المحتملة المرتبطة بالاستخدام غير السليم أو تخزين معلومات العملاء مع تحسين التعاون بين الأقسام المختلفة داخل المؤسسة لتحقيق أقصى قدر من مكاسب الكفاءة وزيادة الربحية في المشاريع طويلة الأجل المبادرات على حد سواء مما يجعلها ضرورية لمعدل النجاح في العصر الحديث بين رواد الأعمال الطموحين
The rise of e-commerce in recent years has been nothing short of astounding. With more and more people using digital platforms to shop, business owners are racing to keep up with the demand. But what separates the successful ones from the rest? It’s the ability to adapt and leverage technology to their advantage. In this article, we’ll explore how you can revolutionize your e-commerce operations through digital technology.
From artificial intelligence to blockchain, the Data World Consulting Group covers the top strategies for staying ahead of the game.
Harness the Power of AI to Increase Efficiency
AI has been a buzzword in the tech industry for a while now and with good reason. By training algorithms to identify patterns and behaviors, companies can gain insights into their customers’ preferences and deliver personalized experiences.
For e-commerce businesses, this can mean anything from recommending products based on previous purchases to using chatbots for customer service. By investing in AI, you can not only improve your customers’ experience but also increase your sales and revenue. As you search for a robust automation and AI solution, you should take a look at this generative AI tool.
Add Augmented Reality (AR)
Harvard Business Review notes that augmented reality (AR) is another technology that’s gaining traction in the e-commerce space. AR allows customers to visualize products more interactively, giving them a sense of what they’re purchasing before they hit “buy”. Think of it as a virtual try-on for clothing or a 3D model of furniture in your living room. This not only enhances the customer experience but also reduces the chances of returns and increases customer satisfaction.
Enhance Your Customers’ Mobile Experience
With more than 50% of internet traffic coming from mobile devices, it’s essential to optimize your e-commerce site for mobile users. This means ensuring that your site is mobile-friendly, easy to navigate, and fast to load. You should also consider investing in mobile apps to provide a more seamless experience for your customers. Apps can allow for push notifications, personalized recommendations, and an easy checkout process.
Invest in a 3D Design Tool
Bringing new products to the market can be a costly and time-consuming process. Investing in a 3D design tool is an affordable option for businesses looking to bring new products to market efficiently. With the help of a 3D design software, companies can easily create and visualize their product ideas in a digital space before moving on to the manufacturing process. This allows for faster iteration and prototyping, ultimately leading to a faster time to market. The cost of a 3D design tool is often outweighed by the benefits it provides in terms of increased efficiency and speed.
Advertisements
Achieve Optimal Supply Chain Efficiency
Optimizing your supply chain can be a game-changer for your e-commerce business. By using automated systems and data analytics, you can reduce costs, save time, and improve efficiency. This could include using sensors to track inventory levels, using predictive analytics to forecast demand, or using automated drones to deliver products.
Use Chatbots to Improve Customer Service
Chatbots have become increasingly popular in recent years, with many e-commerce businesses using them to improve customer service. By using natural language processing and AI, chatbots can provide personalized recommendations, answer customer questions, and resolve issues. This not only improves the customer experience but also frees up your staff to focus on higher-level tasks.
Capitalize in Blockchain Technology
Finally, as Business News Daily points out, blockchain technology is another area that e-commerce businesses should consider investing in. Blockchain provides a tamper-proof and transparent ledger of transactions, making it ideal for managing supply chains and tracking product authenticity. This technology can also be used for secure payments and protecting customer privacy.
There are many ways that e-commerce businesses can revolutionize their operations through digital technology. By embracing AI, AR, mobile, 3D design, supply chain optimization, chatbots, and blockchain, you can enhance the customer experience, reduce costs, and stay ahead of the competition.
However, it’s important to remember that technology is not a silver bullet – it should be used strategically and in conjunction with a strong business strategy. By leveraging the power of technology, e-commerce businesses can thrive in the digital age and build a loyal customer base.
The Data World Consulting Group offers solutions related to data issues and digital marketing. Contact us today to learn more!
Advertisements
قم بتطوير أعمال التجارة الإلكترونية الخاصة بك باستخدام أحدث التقنيات
Advertisements
كان صعود التجارة الإلكترونية في السنوات الأخيرة أمراً مذهلاً مع تزايد عدد الأشخاص الذين يستخدمون المنصات الرقمية للتسوق، يتسابق أصحاب الأعمال لمواكبة الطلب ولكن ما الذي يميز الناجحين عن الباقي؟ إنها القدرة على التكيف والاستفادة من التكنولوجيا لصالحهم
في هذه المقالة سنستكشف كيف يمكنك إحداث ثورة في عمليات التجارة الإلكترونية الخاصة بك من خلال التكنولوجيا الرقمية
blockchain من الذكاء الاصطناعي إلى تقنية
Data World Consulting Group تغطي مجموعة
أهم الاستراتيجيات للبقاء في صدارة اللعبة
تسخير قوة الذكاء الاصطناعي لزيادة الكفاءة
لقد كان الذكاء الاصطناعي كلمة طنانة في صناعة التكنولوجيا منذ فترة ولسبب وجيه ومن خلال تدريب الخوارزميات على تحديد الأنماط والسلوكيات، يمكن للشركات الحصول على نظرة ثاقبة لتفضيلات عملائها وتقديم تجارب مخصصة لهم
بالنسبة لشركات التجارة الإلكترونية، يمكن أن يعني هذا أي شيء بدءاً من التوصية بالمنتجات بناءً على عمليات الشراء السابقة وحتى استخدام برامج الدردشة الآلية لخدمة العملاء
من خلال الاستثمار في الذكاء الاصطناعي، لا يمكنك تحسين تجربة عملائك فحسب، بل يمكنك أيضًا زيادة مبيعاتك وإيراداتك
أثناء بحثك عن حل قوي للأتمتة والذكاء الاصطناعي، يجب عليك إلقاء نظرة على أداة الذكاء الاصطناعي التوليدية هذه
(AR)إضافة الواقع المعزز
وتشير مجلة هارفارد بيزنس ريفيو
(AR) إلى أن الواقع المعزز
هو تقنية أخرى تكتسب زخمًا في مجال التجارة الإلكترونية، يتيح الواقع المعزز للعملاء تصور المنتجات بشكل أكثر تفاعلية، مما يمنحهم فكرة عما يشترونه قبل النقر على زر “شراء
فكِّر في الأمر على أنه تجربة افتراضية للملابس أو نموذج ثلاثي الأبعاد للأثاث في غرفة المعيشة الخاصة بك، وهذا لا يعزز تجربة العملاء فحسب، بل يقلل أيضًا من فرص الإرجاع ويزيد من رضا العملاء
تعزيز تجربة الهاتف المحمول لعملائك
نظرًا لأن أكثر من خمسون بالمئة من حركة المرور على الإنترنت تأتي من الأجهزة المحمولة، فمن الضروري تحسين موقع التجارة الإلكترونية الخاص بك لمستخدمي الأجهزة المحمولة، وهذا يعني التأكد من أن موقعك متوافق مع الجوّال وسهل التنقل فيه وسريع التحميل
يجب عليك أيضًا التفكير في الاستثمار في تطبيقات الأجهزة المحمولة لتوفير تجربة أكثر سلاسة لعملائك
يمكن أن تسمح التطبيقات بإرسال الإشعارات والتوصيات الشخصية وعملية الدفع السهلة
Advertisements
استثمر في أداة تصميم ثلاثية الأبعاد
قد يكون طرح منتجات جديدة في السوق عملية مكلفة وتستغرق وقتًا طويلاً، يعد الاستثمار في أداة التصميم ثلاثي الأبعاد خيارًا ميسور التكلفة للشركات التي تتطلع إلى جلب منتجات جديدة إلى السوق بكفاءة
بمساعدة برنامج التصميم ثلاثي الأبعاد، يمكن للشركات بسهولة إنشاء أفكار منتجاتها وتصورها في مساحة رقمية قبل الانتقال إلى عملية التصنيع وهذا يسمح بالتكرار والنماذج الأولية بشكل أسرع، مما يؤدي في النهاية إلى وقت أسرع للتسويق
غالبًا ما تفوق تكلفة أداة التصميم ثلاثي الأبعاد الفوائد التي توفرها من حيث زيادة الكفاءة والسرعة
تحقيق الكفاءة المثلى لسلسلة التوريد
يمكن أن يؤدي تحسين سلسلة التوريد الخاصة بك إلى تغيير قواعد اللعبة بالنسبة لأعمال التجارة الإلكترونية الخاصة بك
باستخدام الأنظمة الآلية وتحليلات البيانات، يمكنك تقليل التكاليف وتوفير الوقت وتحسين الكفاءة، يمكن أن يشمل ذلك استخدام أجهزة الاستشعار لتتبع مستويات المخزون أو استخدام التحليلات التنبؤية للتنبؤ بالطلب أو استخدام طائرات بدون طيار آلية لتوصيل المنتجات
لتحسين خدمة العملاءChatbotsاستخدم
ذات شعبية متزايدة في السنوات الأخيرة Chatbots أصبحت
حيث تستخدمها العديد من شركات التجارة الإلكترونية لتحسين خدمة العملاء باستخدام معالجة اللغة الطبيعية والذكاء الاصطناعي يمكن لروبوتات الدردشة تقديم توصيات مخصصة والإجابة على أسئلة العملاء وحل المشكلات وهذا لا يؤدي إلى تحسين تجربة العملاء فحسب بل يحرر موظفيك أيضًا للتركيز على المهام ذات المستوى الأعلى
Blockchainالاستفادة من تكنولوجيا
وأخيراً وكما تشير بيزنس نيوز ديلي فإن تكنولوجيا سلسلة الكتل هي مجال آخر يجب على شركات التجارة الإلكترونية أن تفكر في الاستثمار فيه
توفر تقنية سلسلة الكتل سجلا شفافا ومقاوما للتلاعب للمعاملات مما يجعلها مثالية لإدارة سلاسل التوريد وتتبع أصالة المنتج ويمكن أيضًا استخدام هذه التقنية للمدفوعات الآمنة وحماية خصوصية العملاء
هناك العديد من الطرق التي يمكن لشركات التجارة الإلكترونية من خلالها إحداث ثورة في عملياتها من خلال التكنولوجيا الرقمية من خلال تبني الذكاء الاصطناعي والواقع المعزز والهواتف المحمولة والتصميم ثلاثي الأبعاد
blockchain وتحسين سلسلة التوريد وروبوتات الدردشة وتقنية
يمكنك تحسين تجربة العملاء وتقليل التكاليف والبقاء في صدارة المنافسة
ومع ذلك من المهم أن نتذكر أن التكنولوجيا ليست الحل السحري بل يجب استخدامها بشكل استراتيجي وبالتزامن مع استراتيجية عمل قوية، ومن خلال الاستفادة من قوة التكنولوجيا يمكن لشركات التجارة الإلكترونية أن تزدهر في العصر الرقمي وأن تبني قاعدة عملاء دائمين
The data set in our project represents hotel reservation information in the city
This reservation information includes the time of reservation, the duration of stay, the number of people who wish to reserve, classified according to (adults – children – babies) and the number of garages available for parking
* The stage of importing and reading data packages
At this point we have to import packages and libraries for data analysis and visualization
We can now read the data set
To show us the data as follows
*The data Preparation stage includes the following steps:
1. Handling Missing Values:
It appears to us that there are four columns whose values are empty, and in order to deal with them, we must understand the context of the data, and this is done by doing what is shown in the following figure:
2. Convert column values:
We have to replace the random values by further analysis
3. Change Data Styles:
Now we need to modify some columns that are still in the string types
4. Handling duplicates:
We have to remove the duplicate rows and to find out the number of duplicate rows we will run the following code
5. Create new columns by combining other columns:
6. Drop unnecessary columns
We do this because we used it to create new columns
* Descriptive analysis and correlations:
We can implement this function to return the description of the data in the DataFrame
We will use this data to perform the statistical analysis
Correlation heatmap
We will now construct the relationship between the image of the strength of the relationships between the numerical variables
We’ll touch on using this map for EDA later
* Exploratory data analysis:
As for the EDA procedure, and in order to stay on the right path, it is preferable that we follow the following steps:
After the data preparation process, we export the file to csv and then import it into Tableau to perform visualization later
By looking at the previous map, we have several inquiries about the relationships between features
We will use the previous map and visualizations to formulate the following inquiries:
From the data set, we selected three main elements: Booking, hotel, and customer
Booking:
1. What is the big picture for booking rooms throughout the year and month?
2. What are the best booking channels?
3. Will the reservation requester include meals with the reservation menu?
hotel:
4. Which hotels are the most popular and how many bookings do they have during the year?
5. Compare those hotels in the customer group.
6. Compare those hotels on customer type.
customers:
7. What are the types of customer requests when staying in different room types?
8. Knowing the highest frequency of guests and the highest length of stay.
9. What is the impact of the presence of children on the parents’ decision to order meals and the length of stay?
10. For children and babies, what is their preferred type of room?
Advertisements
*Visualization and conclusion stage:
It is the visualization stage using Tableau
1. What is the big picture for booking rooms throughout the year and month?
We’ll look at a three-year period in our next scenario
Check-out is observed in a large number of rooms, in return, a large percentage of the rooms are cancelled
The number of rooms that were booked, but the customers did not show up, was very large
Room reservations are classified by months:
We will notice that bookings in 2016 were at their peak, especially between the months of April and July
2. What are the best booking channels?
It shows us that direct channel is prevalent over hotel booking channels
While it shows us the reservation channels over time, it did not appear effective in hotel reservations, as is the case in the GDS channel
3. Will the reservation requester include meals with the reservation menu?
It is expected that the number of meals will increase with the increase in the number of reservation days, so we note that the months of July and August witness a large number of meals and booked rooms, then the numbers take a rapid decline after that
4. Which hotels are the most popular and how many bookings do they have during the year?
We are processing reservations for two hotels, City Hotel and Resort Hotel
Both hotels started booking around 2015
In comparison, we find that the City Hotel had approximately 19,000 reservations in 2016.
On the other hand, we find that the Resort Hotel had 12,200 reservations in the same year
5. Compare those hotels in the customer group.
The proportion of reservations among adults is ten times higher than the children’s group and thirty times higher than the infant group
This rate is also fixed at the Resort Hotel
6. Compare those hotels on customer type.
The main client type is Transient, followed by the Transient-Party client type, and then the contract client type
In the result, we see that the Resort hotel has a higher percentage of the contract customer type, with a total of 8182
City Hotel scored only 2,390
Omitting the Group customer type
7. What are the types of customer requests when staying in different room types?
The percentage of requests for parking spaces is directly proportional to the percentage of special requests submitted by customers, so it increases with its increase
We notice an increase in the number of guests in rooms D and A
Considering that these two rooms are the most common, this means that there is a high demand for requests
8. Knowing the highest frequency of guests and the highest length of stay.
The following chart shows data on the number of repeat guests and total stays aggregated by market movement
The number of repeat visitors within the corporate sector reached 1,445 visitors, and in return 579 visitors made reservations at the hotel again via the Internet, with a total length of stay of 103,554 nights.
The corporate segment has the highest number of repeat guests at 1,445, but their total number of nights is very low. Meanwhile, 579 online guests booked the hotel again, with a total stay of 103,554 nights.
9. What is the impact of the presence of children on the parents’ decision to order meals and the length of stay?
It is clear that the presence of children has a direct impact on the parents’ decision to choose to order meals and the duration of stay. Families with children tend to request additional meals but less stay, as we can see in the figure
10. For children and babies, what is their preferred type of room?
Considering that
G, F, A are common rooms for children
G, D, A are common rooms for babies
We conclude that rooms G and A are most suitable for visitors with children and babies
Excluding rooms H, E, and B from the preferred rooms for the same clients
Thus, we have completed our project and learned about the most important points that must be taken into account when undertaking any project of this kind
Advertisements
مشروع حجز الفنادق – تحليل البيانات الاستكشافية
Advertisements
نبدأ بالخطوات التالية:
مجوعة البيانات وسياقها *
تمثل مجموعة البيانات في مشروعنا معلومات الحجز بالفنادق المتواجدة في المدينة
معلومات الحجز هذه تشمل وقت الحجز ومدة الإقامة وعدد الأشخاص الراغبين بالحجز مصنفين حسب (البالغين – الأطفال – الرضع ) وعدد الكراجات المتاحة لوقوف السيارات
: مرحلة استيراد حزم البيانات وقراءتها *
علينا في هذه المرحلة أن نقوم باستيراد الحزم والمكتبات لتحليل البيانات وتصورها
يمكننا الآن قراءة مجموعة البيانات
لتظهر لنا البيانات على الشكل التالي
: مرحلة تجهيز البيانات وتتضمن الخطوات التالية*
1. معالجة القيم المفقودة:
يظهر لنا أن هناك أربعة أعمدة قيمها فارغة، وللتعامل معها ينبغي علينا فهم سياق البيانات ويتم ذلك بإجراء ما هو موضح في الرسم التالي
2. تحويل قيم الأعمدة:
علينا استبدال القيم العشوائية بواسطة مزيد من التحليل
3. تغيير أنماط البيانات:
نحتاج الآن إلى تعديل بعض الأعمدة التي لا تزال في أنواع السلاسل
4. معالجة التكرارات:
علينا إزالة الصفوف المكررة ولمعرفة عدد الصفوف المكررة سنقوم بتشغيل الكود التالي
5. إنشاء أعمدة جديدة عن طريق الجمع بين الأعمدة الأخرى:
6. إسقاط الأعمدة غير الضرورية
نقوم بهذا الإجراء لأننا استعملناها لإنشاء أعمدة جديدة
* التحليل الوصفي والارتباطات:
يمكننا تنفيذ هذه الوظيفة من إرجاع
DataFrame وصف البيانات في
سنستخدم هذه البيانات لإجراء التحليل الإحصائي
Correlation heatmap
سنبني الآن العلاقة بين صورة قوة العلاقات بين المتغيرات العددية
EDA سنتطرق لاحقاً لاستخدام هذه الخريطة لـ
: تحليل البيانات الاستكشافية *
ولكي نبقى في الطريق الصحيح يُفضَّل أن نقوم باتباع الخطوات التالية
بعد عملية تحضير البيانات نقوم
Tableau ثم الاستيراد إلى csv بتصدير الملف إلى
لإجراء التصور فيما بعد
من خلال النظر في الخارطة السابقة يتكون لدينا عدة استفسارات عن العلاقات بين السمات
:سنستعين بالخارطة السابقة وبالتصورات لتكوين الاستفسارات التالية:
من مجموعة البيانات قمنا باختيار ثلاثة عناصر أساسية هي: الحجز، الفندق، العميل
الحجز
1. ما هي الصورة الكبيرة لحجز الغرف طيلة العام والشهر؟
2. ما هي قنوات الحجز الأفضل؟
3. هل سيُدرِج طالب الحجز وجبات الطعام مع قائمة الحجز؟
الفندق
4. أي الفنادق تعتبر الأكثر شعبية وكم عدد الحجوزات لديها خلال العام؟
5. مقارنة تلك الفنادق في مجموعة العملاء.
6. مقارنة تلك الفنادق على نوع العملاء.
العملاء
7. ما هي نوعية طلبات العملاء عند إقامتهم في أنواع الغرف المختلفة؟
8. معرفة أعلى معدل تكرار للنزلاء وأعلى مدة إقامة.
9. ما مدى تأثير وجود الأطفال على قرار الأهل بطلب وجبات الطعام ومدة الإقامة؟
10. بالنسبة لوجود الأطفال والرضع ما هي نوعية الغرف المفضلة لديهم؟
Advertisements
: مرحلة التصور والاستنتاج *
Tableauوهي مرحلة التصور باستخدام
1. ما هي الصورة الكبيرة لحجز الغرف طيلة العام والشهر؟
سنتناول فترة ثلاث سنوات في تصورنا التالي
لوحظ تسجيل مغادرة في عدد كبير من الغرف، بالمقابل يتم إلغاء نسبة كبيرة من الغرف
عدد الغرف التي تم حجزها ولكن العملاء لم يحضروا إليها كان كبيراً جداً
:حجوزات الغرف مصنفة حسب الأشهر
سنلاحظ أن الحجوزات عام 2016 كانت في أوجها وخصوصاً بين شهري نيسان وتموز
2. ما هي قنوات الحجز الأفضل؟
يظهر لنا أن القناة المباشرة هي السائدة على قنوات حجز الفنادق
في حين يظهر لنا قنوات الحجز بمرور الوقت لم تظهر فعالية في عمليات الجحز الفندقي كما هو الحال في قناة GDS
3. هل سيُدرِج طالب الحجز وجبات الطعام مع قائمة الحجز؟
من المتوقع أن عدد وجبات الطعام ستزداد مع زيادة عدد أيام الحجز، فنلاحظ أن شهري تموز وآب يشهدان عدداً كبيراً في الوجبات والغرف المحجوزة ثم تأخذ الأرقام بالانحدار بشكل سريع بعد ذلك
4. أي الفنادق تعتبر الأكثر شعبية وكم عدد الحجوزات لديها خلال العام؟
نقوم بدراسة حجوزات لاثنين من الفنادق هما City Hotel و Resort Hotel
كلا الفندقين بدأ حجوزاتهما في 2015 تقريباً
وبالمقارنة نجد أن فندق City Hotel بلغ عدد حجوزاته 19000 حجز تقريباً في العام 2016
بالمقابل نجد أن فندق Resort Hotel بلغ عدد حجوزاته 12200 حجز في نفس العام
5. مقارنة تلك الفنادق في مجوعة العملاء.
نسبة الحجوزات بين البالغين هي أعلى بعشر مرات من مجوعة الأطفال وأعلى بثلاثون مرة من مجموعة الرُّضَّع
هذه النسبة ثابتة أيضاً في Resort Hotel
6. مقارنة تلك الفنادق على نوع العملاء.
Transient نوع العميل الرئيسي هو
Transient-Party يليه نوع عميل
contract ثم نوع عميل
Resort نرى في النتيجة أن فندق
بمجموع 8182 contract يسجل نسبة أعلى من نوع عميل
مجموع 2390 فقط City بينما سجل فندق
7. ما هي نوعية طلبات العملاء عند إقامتهم في أنواع الغرف المختلفة؟
تتناسب نسبة طلبات أماكن وقوف السيارات طرداً مع نسبة الطلب الخاص المقدم من قبل العملاء فتزداد بازدياده
D , A نلاحظ ارتفاع عدد نزلاء الغرفتين
وباعتبار أن هاتين الغرفتين هما الأكثر شيوعاً هذا يعني يؤدي إلى ارتفاع الطلب على الطلبات
8. معرفة أعلى معدل تكرار للنزلاء وأعلى مدة إقامة.
يوضح لنا المخطط التالي بيانات حول عدد الضيوف المتكررين وإجمالي الإقامة المجمعة حسب حركة السوق
بلغ عدد الزوار المتكررين ضمن قطاع الشركات 1445 زائر، وبالمقابل قام 579 زائراً بالحجز في الفندق مرة أخرى عن طريق الإنترنت وبلغ إجمالي مدة الإقامة 103554 ليلة
يحتوي قطاع الشركات على أكبر عدد من الضيوف المتكررين وهو 1445 ضيفًا ، ولكن إجمالي عدد لياليهم منخفض جدًا. وفي الوقت نفسه ، حجز 579 ضيفًا على الإنترنت في الفندق مرة أخرى ، وبلغ إجمالي مدة الإقامة 103554 ليلة.
9. ما مدى تأثير وجود الأطفال على قرار الأهل بطلب وجبات الطعام ومدة الإقامة؟
يتضح أن وجود الأطفال له تأثير مباشر على قرار الأهل في اختيار طلب وجبات الطعام ومدة الإقامة، فالأسرة التي لديها أطفال تميل لطلب وجبات إضافية ولكن إقامة أقل كما نلاحظ في الشكل
10. بالنسبة لوجود الأطفال والرضع ما هي نوعية الغرف المفضلة لديهم؟
على اعتبار أن
هي غرف شائعة للأطفال G, F, A
هي غرف شائعة للرضع G, D, A
G , A نستنتج أن الغرف
هي الأنسب للزوار الذي لديهم أطفال ورضع
من الغرف المفضلة للنفس العملاء H , E , B مع استبعاد الغرف
وبهذا نكون قد أتممنا مشروعنا وتعرفنا على أبرز النقاط الواجب مراعاتها عند القيام بأي مشروع من هذا النوع
Product improvement process requires knowing the right strategy to follow to achieve this goal
In our research, we will discuss the Spotify application as a full explanation of these strategies
What is Spotify?
It is an application that provides audio content lovers with easy access to digital music, digital books, and podcasts on demand and in high quality, and it has several advantages such as providing suggestions that suit the interests of the listener and creating collections of music and podcasts
This application relies on several techniques such as data analysis to provide the best services to users and to continuously create a good view of preferred content, which helps to continuously provide appropriate suggestions, in addition to building a huge music library
This application also allows artists to develop their level so that it works to encourage them and provide them with support. Thus, with the development of their performance, their popular base increases, and this is the basic foundation for starting a sound strategy for the process of product growth.
It is noticeable that the use of this application has increased on a large scale, and to study the strategy of this growth, we must clarify several points
* Custom recommendations:
This point focuses on knowing user behavior and defining search queries by taking advantage of machine learning algorithms to analyze listening patterns, so the user generates a motive for repeated use
* Social features:
The social communication process is an important way to share playlists and follow friends on the platform, which contributes to increasing the user’s participation through interaction with his peers
* Gamification:
This system organizes lists of distinguished people, challenges, and badges. Introducing this system to the platform leads to creating a spirit of competition, which leads them to be present for longer periods on the application, and thus increase the participation of users.
* Exclusive offers:
This application is keen to avoid boring content, which users are accustomed to appearing on other platforms, and is unique in offering what is new to attract users more.
* Flexibility in use
This application has provided an easy to control interface for the users and this also contributes to the motivation of the users to spend more time and increase participation
* Collaboration with celebrities
This procedure helps to reach a wider audience and increase user participation due to the great popularity of celebrities, especially the most present on social media.
Advertisements
* Podcast summary feature
This feature allows users to refer to future podcast content after the broadcast has ended with a notable summary in PDF format so they don’t have to listen to the entire podcast
* Enhance post-broadcast interaction
The user can interact after the broadcast by making inquiries or comments, which also contributes to the expansion of participation on the application
These strategies contribute to the growth of this application, and with its continuity, it is expected that the growth will increase at a good rate in the near future
By projecting these strategies on any product, we conclude that the basic factors of development and growth intersect at key issues, the most important of which is the improvement and development of services to attract the largest possible number of users who form the strong base upon which the producer relies for the spread of his product.
Advertisements
Spotify إضاءة على استراتيجية نمو
كمثال على استراتيجيات تحسين المنتجات
Advertisements
تتطلب عملية تحسين المنتج معرفة الاستراتيجية الصحيحة التي يجب اتباعها لتحقيق هذا الهدف
Spotify وسنتناول في بحثنا هذا تطبيق
كشرحٍ وافٍ لهذه الاستراتيجيات
؟ Spotifyما هو
هو تطبيق يتيح لعشاق المحتوى الصوتي الوصول السهل إلى الموسيقى الرقمية والكتب الرقمية والبودكاست عند الطلب وبجودة عالية ويتمتع بعدة مزايا كتقديم اقتراحات تلائم اهتمامات المستمع وإنشاء مجموعات من الموسيقى وملفات البودكاست
يعتمد هذا التطبيق على عدة تقنيات كتحليل البيانات لتوفير أفضل خدمات للمستخدمين وتكوين رؤية جيدة عن المحتوى المفضل بشكل مستمر فيساعد ذلك على تقديم الاقتراحات المناسبة بشكل مستمر، بالإضافة إلى بناء مكتبة موسيقى ضخمة
كما ويتيح هذا التطبيق للفنانين تطوير مستواهم بحيث يعمل على تشجيعهم وتقديم الدعم لهم وبالتالي ومع تطور أدائهم تزداد قاعدتهم الشعبية اتساعاً وهذه هي الركيزة الأساسية لبداية استراتيجية صحيحة لعملية نمو المنتج
من الملاحظ ازدياد رقعة استخدام هذا التطبيق على نطاق واسع ولدراسة استراتيجية هذا النمو يجب علينا توضيح عدة نقاط
* التوصيات المخصصة
تركز هذه النقطة على معرفة سلوك المستخدم وتحديد استعلامات البحث عن طريق الاستفادة من خوارزميات التعلم الآلي لتحليل نماذج الاستماع فيتولد عند المستخدم دافع الاستخدام المتكرر
* الميزات الاجتماعية
تعتبر عملية الاتصالات الاجتماعية وسيلة هامة لمشاركة قوائم التشغيل ومتابعة الأصدقاء على المنصة مما يساهم في زيادة مشاركة المستخدم من خلال التفاعل مع أقرانه
* Gamification
يعمل هذا النظام على تنظيم قوائم بالمتميزين وبالتحديات والشارات، فإدخال هذا النظام إلى النظام الأساسي ويؤدي إلى خلق روح المنافسة مما يدفع بهم إلى تواجدهم لفترات أطول على التطبيق وبالتالي ازدياد مشاركة المستخدمين
* العروض الحصرية
يحرص هذا التطبيق على تجنب المحتوى الممل والذي ألِف المستخدمون ظهوره في منصات أخرى والتفرد في طرح ما هو جديد لجذب المستخدمين بشكل أكبر
Advertisements
* المرونة في الاستخدام
وفر هذا التطبيق واجهة سهلة التحكم بالنسبة للمستخدمين وهذا أيضاً يساهم في خلف الدافع لدى المستخدمين لإمضاء وقت أكثر وزيادة المشاركة
* التعاون مع المشاهير
يساعد هذا الإجراء على الوصول إلى جمهور أوسع وزيادة مشاركة المستخدمين نظراً لما يتمتع به المشاهير من شعبية كبيرة وخصوصاً الأكثر حضوراً على وسائل التواصل الاجتماعي
* ميزة ملخص البودكاست
تتيح هذه الميزة للمستخدمين الرجوع إلى محتوى بودكاست في المستقبل بعد انتهاء البث
PDF عن طريق ملخص مدوَّن بصيغة
وبذلك ليسوا مضطرين للاستماع إلى بودكاست كاملاً
* تعزيز التفاعل بعد البث
يستطيع المستخدم التفاعل بعد البث عن طريق إبداء الاستفسارات أو التعليقات مما يساهم أيضاً في اتساع رقعة المشاركة على التطبيق
هذه الاستراتيجيات تساهم في نمو هذا التطبيق ومع استمراريتها يتوقع تزايد النمو بنسبة جيدة في المستقبل القريب
وبإسقاط هذه الاستراتيجيات على أي منتج نستنتج أن العوامل الأساسية للتطور والنمو تتقاطع عند أمور رئيسية أهمها تحسين الخدمات وتطويرها لجذب أكبر قدر ممكن من المستخدمين الذين يشكلون القاعدة القوية التي يستند عليها المُنتِج لانتشار منتجه
With the rapid scientific progress, learning frameworks have become more expanded and diverse, given that continuous learning is an essential cornerstone for the learner to develop himself and increase his skills that he needs for the growth of his work.
Therefore, professional development is one of the pillars of advancement for any work or profession, whether at the level of the individual or the institution, all the way to companies at all levels.
The aforementioned can be applied to data science and all the sciences and specializations that derive from it. The data scientist’s development of his skills and experiences, and thus his keeping pace with continuous developments and updates, raises his value and scientific level.
Experience and skill in data science and its analysis can be gained from several sources, including training courses, but on the other hand, the sources of these training courses must be reliable in terms of correct information and high efficiency, so we will present a list of free virtual training courses provided by the best data science companies with special registration links with it
* KPMG Data Analytics Internship
This company is considered a member of the family of major accounting companies that provide valuable scientific content, focusing in its educational program on simplifying the concept of dealing with big data and how to optimally deal with effective data analyzes,
It is a global management consulting company with offices in many countries of the world and its headquarters is located in Boston, and it is known as one of the highest-level consulting companies in the world. It is famous for creating many management analysis methods, including the growth and participation matrix, the effects of the experience curve, and others.
The TATA Group includes many companies that provide energy, engineering and information systems services, in addition to training programs related to data science, especially with regard to solving problems and dealing with them to reach the best results.
This course will enable you to learn about the day-to-day work of the Data Science team at British Airways. You will learn how they extract data from customer reviews and create predictive models.
Similar to the previous company, during this course, you will be allowed to enter the daily work world of the American company Cognizant, allowing you to virtually complete the tasks of the artificial intelligence team and gain experience and skill
This training program allows you to learn about the ability of data to penetrate individuals and organizations. This program is provided by Quantium, a leading company in data science and technology, by creating decision support tools, generating insights, and developing data sets
From what we have seen, these courses are an opportunity to get acquainted with the mechanism of dealing with important companies with data science and various analysis techniques, so that they allow you to work with them virtually to increase your experience and expand your skills.
Advertisements
مجموعة دورات تدريبية مجانية افتراضية بعلوم البيانات مقدمة من أفضل الشركات
Advertisements
مع التقدم العلمي المتسارع أصبحت أطر التعلم أكثر توسعاً وتنوعاً، ونظراً لاعتبار التعلم المستمر هو ركن أساسي بالنسبة للمتعلم ليطور من نفسه ويزيد مهاراته التي يحتاجها لنمو عمله
لذا فالتطوير المهني هو من دعائم التقدم لأي عمل أو مهنة سواء على مستوى الفرد أو المؤسسة وصولاً إلى الشركات بكافة مستوياتها
ويمكن إسقاط ما سلف ذكره على علوم البيانات وكل ما يتفرع عنها من علوم واختصاصات، فتطوير عالِم البيانات لمهاراته وخبراته وبالتالي مواكبته للتطورات والتحديثات المستمرة يرفع من قيمته ومستواه العلمي
يمكن اكتساب الخبرة والمهارة في علم البيانات وتحليلاتها من عدة مصادر منها الدورات التدريبية، لكن بالمقابل يجب أن تكون مصادر هذه الدورات التدريبية موثوقة من حيث المعلومة الصحيحة والكفاءة العالية، لذا سنقدم قائمة بدورات تدريبية افتراضية مجانية مقدمة من أفضل الشركات المختصة بعلم البيانات مع روابط التسجيل الخاصة بها
* KPMG Data Analytics Internship
تعتبر هذه الشركة فرد من عائلة شركات محاسبة كبرى تقدم محتوى علمي قيّم، تركز في برنامجها التعليمي على تبسيط مفهوم التعامل مع البيانات الضخمة وكيفية التعامل الأمثل مع التحليلات الفعالة للبيانات
هي شركة استشارات إدارية عالمية لها مكاتب في العديد من دول العالم ويقع مقرها الرئيسي في بوسطن، وتعرف على أنها واحدة من أرفع الشركات الاستشارية مستوى في العالم. تشتهر بابتكار العديد من أساليب التحليل الإداري ومنها مصفوفة النمو والمشاركة، وتأثيرات منحني الخبرة وغيرها.
التي تقدم خدمات الطاقة والهندسة وأنظمة المعلومات إضافة إلى البرامج التدريبية المتعلقة بعلوم البيانات وخاصة فيما يتعلق بحل المشكلات والتعامل معها للوصول إلى أفضل النتائج
تتميز هذه الدورة بأنها ستمكنك من التعرف على العمل اليومي الذي يقوم به فريق علوم البيانات في الخطوط الجوية البريطانية ستتعرف على كيفية استخراجهم لبيانات مراجعات العملاء وإنشاء النماذج التنبؤية
من خلال ما رأينا تعتبر هذه الدورات بمثابة فرصة للتعرف على آلية تعامل الشركات المهمة مع علم البيانات وتقنيات التحليل المتنوعة بحيث تتيح لك العمل معها بشكل افتراضي لتزيد خبراتك وتتوسع مهاراتك
We have already noted in previous articles that a job in data science is the dream of many in recent times, and this matter requires effort to obtain great experience and knowledge due to the high level of competition to obtain this job.
And the most important pillars of the required expertise is not only knowing the tools and dealing with them, but it is necessary for the data scientist to have a comprehensive idea of the main concepts and techniques and use them later according to the requirements of the work to be accomplished.
In this article, we will provide a comprehensive guide for beginners who are about to learn data science
Let’s first learn about the concept of data science
Data science in a simplified way is the integration of a group of sciences such as mathematics, statistics and programming that work together to obtain useful insights when dealing with data.
Many related sciences branch out from data science, and the following sciences are the most common, including:
Machine learning, data analysis, business intelligence, statistics, mathematics and other sciences whose prevalence is no longer a secret
Data science is utilized according to previous features and technologies in several areas, including:
Language translation and text analytics, image sorting, remote sensing and health services management
The three most common tasks in data science
Data Analyst: Analyze data to generate better insights for business decisions
Data Scientist: Extracting useful information from big data
Data architecture: dealing with data pipelines
What are the best ways to learn data work?
Learning data science is distinguished by the fact that the deeper you study it, the more knowledge horizons will increase in front of you, and you will feel that you still have a lot to learn. Through this plan, diversify learning sources, such as using online training courses, viewing certificates, and choosing the appropriate ones. There are other means that we will discuss later.
* Know the basic concepts
Knowing the necessary tools and software used by a data scientist as well as the main techniques is one of the most important necessities to learn
Learning a programming language is the most important pillar necessary to start the journey of learning as the Python language (or any language of your choice), you must learn it to the point of proficiency, and reading articles related to the basics of programming and learning how to write code helps you to enable and consolidate the information you receive
* learning through the implementation of projects
This method is the best for learning, as it will introduce you to the work environment in data science. As you implement projects, you will have clear visions, and you will have your own style in deducing options and exploring appropriate solutions.
The implementation of projects requires conducting many searches and carrying out relevant studies. It is advised to start with simple projects that suit your level as a beginner, and with continuous repetition and good follow-up, you will find yourself starting to learn broader concepts to move on to implementing more complex projects, thus increasing your experience and skills.
What are the most important points that a beginner data scientist should learn?
You must choose a field in which you specialize in data science, and accordingly we mention several concepts that you must learn and master
1. Comprehensive knowledge
You must realize the real world around you by following the news that benefits you in your field of learning and keeping abreast of all updates and technologies. By employing the events around you in your studies in a field of data science, you can get the maximum benefit from the course of events around you.
2. Mathematics and Statistics
mathematics
* Linear Algebra: It is a branch that is useful in machine learning because it relies on the formation of matrices, which is a basic pillar of machine learning, so that the matrix represents the data set
Probability: This branch of mathematics is useful in predicting the unknown outcomes of a particular event
* Calculus: They are useful in collecting small differences to determine the derivatives and integrals of functions, and this appears in deep learning and machine learning
Statistics
Descriptive statistics: includes (average, median, cut statistics, and weighted statistics). This is considered the beginning of the stages of analyzing quantitative data formed in the form of charts and graphs.
Inferential statistics: includes determining working measures A and B tests and creating hypothesis tests, probability value, and alpha values for analyzing the collected data
3. Dealing with databases
When talking about data engineering, we should mention the intersection between a data scientist and a data engineer, where pipelines are created for all data from several sources and stored in a single data warehouse.
As a beginner it is recommended to learn SQL and then move to One RDBMS such as
MySQL and One NoSQL
Advertisements
4. Python and its libraries
It is the most widely used programming language for later use in data analytics due to its simplicity in terms of building code and organizing sentences, and it has many libraries such as NumPy, Pandas, Matplotlib, and Scikit-Learn.
This allows the data scientist to use data more effectively
There are courses for beginners in Python on Udemy or Coursera that can be used to learn the principles of Python
5. Data cleaning
It is a time-consuming task for beginners, but it must be implemented in order to obtain good data analysis resulting from clean data.
For a detailed explanation of data cleaning, you can read a comprehensive article through this link Click here
6. Exploratory data analysis
This type of analysis is meant to detect anomalies in the data and test hypotheses with the help of statistics and graphs
As a beginner, you can use Python to perform EDA according to the following steps
Data collection: It involves gathering, measuring, and analyzing accurate data from multiple sources in order to find a solution to a specific problem
Data cleaning: Troubleshoot incorrect data
Univariate analysis: It is an analysis process based on a single change without addressing complex relationships and aims to describe the data and identify existing patterns
Bivariate Analysis: This process compares two variables to determine how the features affect each other to perform the analysis and determine the causes
7. Visualization
One of the most important pillars of all data analysis projects, visualization is a technique that makes seeing data clear and effective in the end, and reaching effective results in visualization depends on having the right set of visualizations for different types of data
Types of perceptions:
HISTOGRAM
bar chart
BUBBLE CHART
RADAR CHART
WATERFALL CHART
PIE CHART
LINE CHART
AREA CHART
TREE MAP
SCATTERPLOT
BOX PLOT
The most important visualization tools:
Tableau: This is the most popular tool for data visualization due to its reliance on scientific research, which improves analysis results with the required speed
BI Bower: An interactive program developed by Microsoft that is often used in business intelligence
Google Chart: It is widely used by the analyst community due to its provision of graphical visualizations
JupiterR: This web-based application features the convenience of creating and sharing documents with visualizations
So we conclude from the above that visualization is the process of showing data in a visual way without having to plan all the information
I hope that I have been successful in identifying the most important points that help a beginner in data science to stand on his feet and prove himself as a data scientist seeking to develop himself and refine his skills
It is certain that many of you, dear readers, have knowledge of other important points that I did not mention. Share them with us in the comments, Thank you.
Advertisements
إضاءة شاملة على ما يجب أن يتعلمه المبتدئ في علم البيانات
Advertisements
سبق وأن نوهنا في مقالات سابقة أن الوظيفة في علم البيانات هي حلم الكثيرين في الآونة الأخيرة، وأصبح هذا الأمر يتطلب مجهوداً في الحصول على خبرة ومعرفة كبيرين بسبب ارتفاع مستوى المنافسة للحصول على هذه الوظيفة
وأهم ركائز الخبرة المطلوبة ليس فقط معرفة الأدوات والتعامل معها بل من الضروري أن يمتلك عالِم البيانات فكرة شاملة عن المفاهيم والتقنيات الرئيسية واستخدامها فيما بعد وفق متطلبات العمل المراد إنجازه
في هذا المقال سنتقدم دليلاً إرشادياً شاملاً للمبتدئين المقبلين على تعلم علم البيانات
لنتعرف في البداية على مفهوم علم البيانات
علم البيانات بشكل مبسط هو تكامل مجموعة علوم كالرياضيات والإحصاء والبرمجة تؤدي عملها مع بعضها للحصول على رؤى مفيدة عند التعامل مع البيانات
:يتفرع عن علم البيانات العديد من العلوم ذات الصلة وتعد العلوم الآتية هي الأكثر شيوعاً نذكر منها
التعلم الآلي وتحليل البيانات وذكاء الأعمال والإحصائيات والرياضيات وغيرها من العلوم التي لم يعد انتشارها يخفى على أحد
:يُستفاد من علم البيانات وفق الميزات والتقنيات السابقة في عدة مجالات نذكر منها
ترجمة اللغة وتحليلات النص، فرز الصور، الاستشعار عن بعد وإدارة الخدمات الصحية
المهام الثلاث الأكثر شيوعاً في علم البيانات
محلل البيانات: تحليل البيانات لتكوين رؤى أفضل لقرارات العمل
عالِم البيانات: استخراج المعلومات المفيدة من البيانات الضخمة
مهندس بيانات: التعامل مع خطوط أنابيب البيانات
ما هي الطرق الأمثل لتعلم عمل البيانات؟
يتميز تعلم علم البيانات بأنه كلما تعمقت في دراسته أكثر كلما ازدادت الأفق المعرفية أمامك أكثر وستشعر بأن ما زال أمامك الكثير لتتعلمه، وبإمكانك كمتعلم مبتدئ أن تضع لنفسك خطة تدريبية تعينك على التعلم بمرونة وسهولة لتتجنب الوقوع في فخ الملل ثم اليأس كما يحصل مع الكثيرين ويمكنك من خلال هذه الخطة تنويع مصادر التعلم كالاستعانة بالدورات التدريبية عبر الإنترنت والاطلاع على الشهادات واختيار المناسب منها وهناك وسائل أخرى سنتطرق إليها لاحقاً
التعرف على المفاهيم الأساسية *
التعرف على الأدوات والبرامج اللازمة التي يستخدمها عالِم البيانات إضافة إلى التقنيات الرئيسية هي من أهم الضرورات التي يجب تعلمها
فتعلم لغة برمجة هو أهم الركائز الضرورية لبدء رحلة التعلم كلغة بايثون (أو أي لغة تختارها)، يجب عليك تعلمها إلى درجة الإتقان كما وأن قراءة المقالات المتعلقة بأساسيات البرمجة وتعلم كيفية كتابة الكودات البرمجية يساعدك على تمكين وترسيخ المعلومات التي تتلقاها
طريقة التعلم عن طريق تنفيذ المشاريع *
تعتبر هذه الطريقة هي الأفضل للتعلم فهي ستدخلك في بيئة العمل في علم البيانات فقيامك بتنفيذ المشاريع ستتشكل لديك الرؤى الواضحة وسيتكون عندك أسلوباً خاصاً بك في استنتاج الخيارات واستكشاف الحلول المناسبة
يتطلب تنفيذ المشاريع إجراء العديد من عمليات البحث وتنفيذ الدراسات ذات الصلة وينصح بالبدء بمشاريع بسيطة تناسب مستواك كمبتدئ، ومع التكرار المستمر والمتابعة الجيدة ستجد نفسك بدأت تتعلم مفاهيم أوسع لتنتقل إلى تنفيذ مشاريع أكثر تعقيداً فتزداد خبرتك ومهاراتك
ما هي أبرز النقاط التي يجب على عالِم البيانات المبتدئ أن يتعلمها؟
يجب عليك اختيار مجال تختص فيه في علم البيانات وبناءً عليه نذكر لك عدة مفاهيم يجب أن تتعلمها وتتقنها
1. المعرفة الشاملة
عليك أدراك العالم الواقعي من حولك عن طريق متابعة الأخبار التي تفيدك في مجال تعلمك ومواكبة كافة التحديثات والتقنيات، فمن خلال توظيف الأحداث من حولك في دراستك في مجال من مجالات علم البيانات يمكنك تحصيل الاستفادة القصوى من مجريات الأحداث من حولك
2. الرياضيات والإحصاء
الرياضيات
الجبر الخطي: هو فرع يفيد في التعلم الآلي لاعتماده على تشكيل المصفوفات التي هي ركيزة أساسية في التعلم الآلي، بحيث تمثل المصفوفة مجموعة البيانات
* الاحتمالات: يفيد هذا الفرع من الرياضيات في التنبؤ بالنتائج الجهولة لحدث معين
التفاضل والتكامل: يفيدان في جمع الفروق الصغيرة لتحديد مشتقات وتكاملات الوظائف وهذا يظهر في التعلم العميق والتعلم الآلي
الإحصاء
الإحصاء الوصفي: يشمل (المتوسط والوسيط والإحصاءات المقطوعة والإحصاءات الموزونة) وتعتبر هذه بداية مراحل تحليل البيانات الكمية المتشكلة على هيئة مخططات ورسوم بيانية
الإحصاء الاستدلالي: تشمل تحديد مقاييس العمل اختبارات أ وَ ب وإنشاء اختبارات الفرضيات والقيمة الاحتمالية وقيم ألفا لتحليل البيانات المجمعة
3. التعامل مع قواعد البيانات
عند التطرق إلى الحديث عن هندسة البيانات فيجدر بنا التنويه إلى التقاطع بين عالم البيانات ومهندس البيانات، بحيث يتم إنشاء خطوط أنابيب لجميع البيانات من عدة مصادر وتخزينها في مستودع بيانات واحد
SQL وكمبتدئ ينصح بتعلم
One RDBMS ومن ثم الانتقال إلى نظام
One NoSQL و MySQL مثل
Advertisements
4. لغة بايثون والتعرف على مكتباتها
وهي اللغة الأكثر استخداماً في البرمجة للاستخدام اللاحق في تحليلات البيانات نظراً لبساطتها من حيث بناء الكودات وتنظيم الجُمل
وهي تمتلك العديد من المكتبات
NumPy و Pandas و Matplotlib و Scikit-Learn مثل
ما يتيح لعالِم البيانات باستخدام البيانات بفاعلية أكبر
يوجد دورات تدريبية للمبتدئين في بايثون
Coursera أو Udemy على
يمكن الاستفادة منها في تعلم مبادئ بايثون
5. تنظيف البيانات
وهي مَهمة تستهلك بالنسبة للمبتدئين كثيراً من الوقت لكن لابد من تنفيذها وذلك من أجل الحصول على تحليل بيانات جيد ناتج عن بيانات نظيفة
وللتوضيح بشكل تفصيلي عن تنظيف البيانات يمكنك قراءة مقال شامل من خلال هذا الرابط
6. تحليل البيانات الاستكشافية
يقصد بهذا النوع من التحليل اكتشاف حالات الشذوذ في البيانات واختبار الفرضيات بمساعدة الإحصاءات والرسوم البيانية
كمبتدئ يمكنك استخدام بايثون
وفق الخطوات التالية EDA لإجراء
جمع البيانات: تتضمن جمع البيانات الدقيقة من مصادر متعددة وقياسها وتحليلها بغية إيجاد حل لمشكلة معينة
تنظيف البيانات: استكشاف البيانات غير الصحيحة وإصلاحها
التحليل أحادي المتغير: وهي عملية تحليل تعتمد على تغير واحد دون التطرق إلى العلاقات المعقدة والهدف منها وصف البيانات وتحديد الأنماط الموجودة
التحليل الثنائي المتغير: تجري هذه العملية مقارنة بين متغيرين لتحديد كيفية تأثير الميزات على بعضها البعض لإجراء التحليل وتحديد الأسباب
7. التصور
أحد أهم الدعائم الأساسية لكافة مشاريع تحليل البيانات، فالتصور هو تقنية تجعل من رؤية البيانات بشكل واضح وفعال في النهاية، والوصول إلى نتائج فعالة في التصور يعتمد على امتلاك المجموعة الصحيحة من التصورات لأنواع البيانات المختلفة
:أنواع التصورات
HISTOGRAM
BAR CHART
BUBBLE CHART
RADAR CHART
WATERFALL CHART
PIE CHART
LINE CHART
AREA CHART
TREE MAP
SCATTERPLOT
BOX PLOT
:أهم أدوات التصور
:Tableau
تعد هذه الأداة الأكثر شيوعاً في تصور البيانات لاعتمادها على البحث العلمي مما يحسن نتائج التحليل بالسرعة المطلوبة
:Bower BI
برنامج تفاعلي مطوَّر من قِبَل شركة مايكروسوفت يستخدم غالباً في ذكاء الأعمال
:Google Chart
يستخدم بكثرة عند مجتمع المحللين نظراً لما يوفره من إنتاج التصورات الرسومية
:JupiterR
يعتمد هذا التطبيق على الويب ويتميز بأنه يتيح إنشاء المستندات التي تتضمن التصورات ومشاركتها بكل أريحية
إذاً نستنتج مما سبق أن التصور هو عملية إظهار البيانات بشكل مصوَّر مرئي دون الحاجة إلى تخطيط جميع المعلومات
أرجو أن أكون قد وُفِّقت في تحديد أكثر النقاط أهمية والتي تعين المبتدئ في علم البيانات على الوقوف على قدميه وإثبات نفسه كعالِم بيانات يسعى إلى تطوير ذاته وصقل مهاراته
من المؤكد أن كثيراً منكم أعزاءي القراء لديهم المعرفة بنقاط هامة أخرى لم أقم بذكرها شاركونا بها في التعليقات ولكم الشكر
Data sets often contain errors or inconsistencies, especially when collected from multiple sources. In these cases, it is necessary to organize that data, correct errors, remove redundant entries, work to organize and format data, and exclude outliers. These procedures are called data cleaning.
The purpose of data cleaning
This process aims to detect any defect in the data and deal with it from the beginning, thus avoiding wasting time spent on arriving at incorrect results
In other words, early detection and fixing of errors leads to correct results
This fully applies to data analysis. Going with clean and formatted data enables analysts to save time and get the best results.
Here is an example showing the stages of data cleaning:
In this example we used Jupyter Notebook to run Python code inside Visual Studio Code
This stage aims to identify the data structure in terms of type and distribution in order to detect errors and imbalances in the data
This process will print the first and last 10 entries of the dataset and thus determine the applicable dataset type so that you choose the first or last entry according to the desired purpose and then output using df.head(10)
We notice some NaN entries in the Choice_description column
and a dollar sign in the item_price column
B. Data types of columns
You must now determine what type of data is in each column
In the following code, we define the column names and data types in an organized and coordinated manner
The output is:
Advertisements
The third stage: data cleaning
a. Change the data type
If the work requires converting data types, this is done while monitoring the data
In our example item_price includes a dollar sign, we can remove it and replace it with float64 because it contains a decimal number
B. Missing or empty values
The stage of searching for missing values in the data set comes:
The output is:
We notice from the output result above that the null value is represented by True, while False does not represent null values We’ll have to find the number of null entries in the table using the sum because we won’t be able to see all the real values in the table
This procedure indicates to us the columns that contain null values and the number of them is empty. We can also note that the “option_description” column is the column that contains empty entries and 1246 of them are empty
We can also determine the presence of null values for each column and find the number as in the following image
We then proceed to find the missing values for each column
In our example, we notice that only one column contains null values
It should be noted here that it is necessary to calculate the percentage of the values in each column because, especially in the case of large data, it is possible that there will be empty values within several columns.
The output is:
We find here that the description column contains missing values by 27%, and this percentage does not necessitate deleting the entire column because it did not exceed 70%, which is the percentage of missing values that if found in a column, it is preferable to get rid of it
Another approach to dealing with missing values when cleaning data is to depend on the type of data and the defect to be addressed
To further clarify we have the column “choice_description” and to understand what the problem is we check the unique entries in this column to get more solutions
Now we make sure how many choice_description contains choice_description
Considering that the missing values are for the customer’s choice, they can be replaced on the assumption that these customers did not give details of their requests, so we replace the missing values with “Regular”.
And replace the null values with “Regular Order”
The output is:
Now let’s make sure that there are null values
By replacing null values with their descriptions, we got rid of all the missing values and began to improve our data
B. Remove redundancy
Now we will check the number of duplicate entries and then get rid of them and this deletion is not done if at least one of the entries is different from row to row as duplicate entries mean that all rows are exactly the same as the other row
We can check by running the code
The output is:
We will now delete duplicate entries
As a precautionary step we will make sure that there are no duplicate entries again
c. Delete extra spaces
That is, getting rid of spaces, extra spaces that are useless between letters and words
This task can be carried out by them:
String processing functions
regular expressions
Data cleaning tools
Fourth stage: data export
This step involves exporting the clean data keeping in mind that in our example we are working on a narrow and simplified scale
This code writes the cleaned data to a new CSV file named cleaned_data.csv
In the same path as our Python script with the ability to modify the file name and path as required
The argument index = False indicates that pandas does not include row index numbers in the exported data.
Fifth stage: data visualization using Tableau
We have reached the end of the data filtering journey with the clean data which we will export to visualization and now ready for easy analysis
Advertisements
ما هو مفهوم تنظيف البيانات؟
Advertisements
تنظيف البيانات
غالباً ما تحتوي مجموعات البيانات على أخطاء أو تناقضات وخصوصاً عند تجميعها من مصادر متعددة ففي هذه الحالات من الضروري تنظيم تلك البيانات وتصحيح الأخطاء وإزالة الإدخالات المتكررة والعمل على تنظيم وتنسيق البيانات واستبعاد القيم المتطرفة، هذه الإجراءات تسمى تنظيف البيانات
الهدف من تنظيف البيانات
تهدف هذه العملية إلى اكتشاف أي خلل في البيانات والتعامل معه منذ البداية مما يجنِّب هدر الوقت المستهلك في الوصل إلى نتائج غير صحيحة
وبمعنى آخر، اكتشاف الأخطاء وإصلاحها في وقت مبكر يوصلنا إلى نتائج صحيحة بشكل مؤكد
وهذا ينطبق تماماً على تحليل البيانات فالمضي ببيانات نظيفة ومنسقة يمكِّن المحللين من توفير الوقت والحصول على أفضل النتائج
تهدف هذه المرحلة إلى التعرف على بنية البيانات من حيث النوع والتوزيع بغية اكتشاف الأخطاء والخلل في البيانات
بهذه العملية سيتم طباعة الإدخالات العشرة الأولى والأخيرة من مجموعة البيانات وبالتالي تحديد نوع مجموعة البيانات المعمول بها بحيث تختار الإدخال الأول أو الأخير وفق الغرض المطلوب
df.head(10) ثم الناتج باستخدام
NaN نلاحظ بعض إدخالات
Choice_description في عمود
item_price وعلامة الدولار في عمود
ب. أنواع بيانات الأعمدة
لابد الآن من تحديد نوع البيانات الموجودة في كل عمود
في الكود التالي يتحدد لدينا أسماء الأعمدة وأنواع البيانات بأسلوب منظم ومنسق
: النتيجة
Advertisements
المرحلة الثالثة: تنظيف البيانات
أ. تغيير نوع البيانات
إذا تطلب العمل تحويل أنواع البيانات فيتم ذلك أثناء مراقبة البيانات
علامة الدولار item_price وفي مثالنا يتضمن
float64 نستطيع إزالته واستبداله بـ
لاحتوائه على رقم عشري
ب. القيم المفقودة أو الفارغة
تأتي مرحلة البحث عن القيم المفقودة في مجموعة البيانات
النتيجة
نلاحظ من نتيجة الإخراج أعلاه
True أن القيمة الخالية متمثلة بـ
False بينما لا يمثل
قيماً خالية سنضطر إلى البحث عن عدد الإدخالات الخالية في الجدول باستخدام المجموع لأننا لن نستطيع رؤية كل القيم الحقيقية الموجودة في الجدول
يدلنا هذا الإجراء على الأعمدة التي تتضمن قيم خالية وعددها فارغ ويمكن أن نلاحظ أيضاً
“option_description” أن العمود
هو العمود الذي يحوي إدخالات فارغة و1246 منها خالية
كما ويمكننا تحديد وجود القيم الخالية لكل عمود مع إيجاد الرقم كما في الصورة التالية
ثم نتوجه إلى العثور على القيم المفقودة لكل عمود
وفي مثالنا نلاحظ أن عمود واحد فقط يتضمن قيم فارغة
يجدر التنويه هنا إلى أنه من الضروري حساب النسبة المئوية للقيم الموجودة في كل عمود لأنه وخصوصاً في حالة وجود بيانات ضخمة فمن المحتمل وجود قيم فارغة ضمن عدة أعمدة
النتيجة
description نجد هنا أن عمود
يحوي قيم مفقودة بنسبة 27% وهذه النسبة لا تستوجب حذف العمود بأكمله لأنها لم تتجاوز 70% وهي نسبة القيم المفقودة التي إن وجدت في عمود فيفضل التخلص منه ومن الطرق الأخرى المتبعة في التعامل مع القيم المفقودة عند تنظيف البيانات الاعتماد على نوع البيانات والخلل المطلوب معالجته
“choice_description”ولمزيد من التوضيح لدينا العمود
ولفهم ماهية المشكلة نتحقق من الإدخالات الفريدة في هذا العمود لنحصل على مزيد من الحلول
choice_description نتأكد الآن من عدد
choice_description الذي يتضمن
على اعتبار أن القيم المفقودة مخصصة لاختيار العميل فيمكن استبدالها على فرض أن هؤلاء العملاء لم يعطوا تفصيلاً عن طلباتهم
” Regular” فنستبدل القيم المفقودة بـ
” Regular Order” ونستبدل القيم الخالية بـ
النتيجة
ولنتأكد الآن من وجود قيم خالية
وعن طريق استبدال القيم الخالية بالأوصاف الخاصة بها تخلصنا من جميع القيم المفقودة وهكذا بدأنا بتحسين بياناتنا
ب. إزالة التكرار
سنتحقق الآن من عدد الإدخالات المكررة لنقوم بعد ذلك بالتخلص منها وعملية الحذف هذه لا تتم إذا كان أحد الإدخالات على الأقل مختلفاً من صف إلى آخر حيث أن الإدخالات المتكررة تعني أن جميع الصفوف متطابقة تماماً مع الصف الآخر
يمكننا التحقق من خلال تشغيل الكود
النتيجة
سنقوم الآن بحذف الإدخالات المتكررة
كخطوة احترازية سنتأكد من عدم وجود إدخالات مكررة مرة أخرى
ج. حذف المسافات الزائدة
أي التخلص من المسافات الفراغات الإضافية التي لا فائدة منها بين الأحرف والكلمات
ويمكن أن تنفذ هذه المهمة منها
وظائف معالجة السلاسل
التعبيرات العادية
الأدوات المخصصة لتنظيف البيانات
المرحلة الرابعة: تصدير البيانات
هذه الخطوة تتضمن تصدير البيانات النظيفة مع الأخذ بعين الاعتبار أننا في مثالنا نعمل على نطاق ضيق ومبسط
يعمل هذا الكود على كتابية البيانات المنظفة
cleaned_data.csv جديد اسمه CSV إلى ملف
في نفس المسار مثل نص بايثون الخاص بنا مع إمكانية تعديل اسم الملف والمسار حسب المطلوب
index = False تدل الوسيطة
أن “باندا” لا تقوم بتضمين أرقام فهرس الصفوف في البيانات المصدرة
المرحلة الخامسة: تصور البيانات باستخدام تابلو
وصلنا إلى نهاية رحلة تصفية البيانات بحصولنا على البيانات النظيفة والتي سنصدرها إلى التصور فهي الآن جاهزة لإجراء عملية التحليل بسهولة
The data science employee in his first appointment period often suffers from some difficulties that are embodied in some chaos, instability, lack of organization, and perhaps difficulty in adapting and confusion, especially in the early days, at the very least, but the new employee must overcome these obstacles, which, in my opinion, are a normal condition. His first steps towards success and development
What we will discuss in this article is how to create the right conditions for building a successful team in the data science job
Co-workers are the environment that helps each person in this group to progress and develop at their various levels, and as a junior employee, your colleague, who was hired a short time ago, will help you answer beginners’ questions, and soon you will have an idea of the basics of the work system for the job, and as your activity grows and develops Your level You can start the stage of receiving ideas about a group of experiences and skills from those older than you in the job with experience and competence at work until you find in yourself that experienced employee who can discuss with his manager on deeper and more accurate topics, as the manager in general tends to the employee who offers suggestions and initiates To the effective discussion by expressing valuable opinions and providing feasible solutions.
You must agree with me that if we look at any successful functional community, whether it is a company, an institution, or even within the private sector, we see that the basis for success lies in the spirit of cooperation and love among the team members at different levels and degrees.
At the beginning of talking about the incorporation stages, especially in the first month of the job, we recommend asking a lot of questions, as it is an ideal period for receiving information, setting priorities and learning vocabulary, by following the following instructions:
1. Be sure to join the guidance units provided by your company, which are dedicated to guiding new employees, as they are capable of informing you of the company’s policy and approach in terms of privacy, security and ethics, and you will also be able to request comprehensive guides for what you need.
2. Always seek information about the team’s work so that you can keep up with the work with them, through continuous communication with your manager and try to make suggestions that contribute to the progress of the company’s work, and try to know the type of challenges that the company faces to start building a successful plan based on your skills and method to overcome problems and face the challenges.
3. Take advantage of the opportunity when there are no internal repositories to publish analytics suites, collect examples and create one so that these repositories become very important to the team and future employees, and do not miss out on getting to know the previous work or project of the company – that is, before your appointment period – to have an idea of how it works Upcoming projects.
4. Try to stay abreast of current issues in the company by joining e-mail subscriptions and other chat platforms. Joining these channels, getting to know their users, and sharing ideas and experiences with them helps you gain more experience.
5. Make sure to introduce yourself in front of your manager and your colleagues through the meetings, and try briefly to present some of your work and projects that you have undertaken and the solutions that you presented during the implementation of the projects. It will increase their confidence in you.
We have already explained in a previous article how to build a business portfolio in the field of data science. For information, click here
6. It is necessary to know the main contacts in the company so you should request a list of contacts from your manager or colleagues
Advertisements
Start building your own data science ecosystem
1. The first step is to prepare your computer with login and remote access information, download the necessary software for your business, get technical support, and don’t forget the necessary equipment and devices
2. It is very important that you obtain the information as soon as possible after your appointment, as the processing takes some time and the time factor here is very important. You should take the initiative directly to ask your manager and those in charge of the work about the data sets that you need to communicate with them and ask for a list of websites that you may need in your business
3. Definitely don’t forget to download the software that your team relies on to work continuously, such as programming languages and data visualization tools
4. Understanding (domain): It is very necessary to help you ensure that the data is interpreted correctly when doing analysis or using a machine learning model The proficiency stage After completing the correct preparation and preparation stage, you must establish yourself and
prove your competence by following these steps:
1. Start your career journey by getting to know your colleagues and introducing yourself to them, such as asking your manager to work with them by appointing you to the team. Share your opinions and experiences with them, even if they are modest. This will help them determine the level of interaction with you and will help build a spirit of cooperation and participation among team members.
2. The first impression is the effect that will be imprinted on your colleagues from the first meeting, whether it is at the level of your morals or your scientific level. In terms of ethics and dealing, people generally tend towards a humble, loving and tolerant person, and they rush to gain his friendship to be close to him. As for the scientific level, when your colleagues find you A person who loves to cooperate and share ideas and experiences will be an ideal person and a model for an efficient employee
3. Let others know about the nature of your work and your main mission in the company, and keep them up to date with your work style and achievements, such as placing links in newsletters and presenting them to the team
Finally..
I believe that by following these steps it is possible to overcome the most difficult period in the appointment stage for a new job, and this is what came to my mind regarding the matters that necessitated that.
My friends If you, think that there are things that we did not mention that may help in establishing a successful work team, then share them with us in the comments so that we can apply what we have previously read on the ground and build a small team whose members exchange information and experiences between the publisher and the recipient .. Thank you.
Advertisements
مراحل التجهيز لبناء فريق عمل ناجح في علم البيانات
Advertisements
غالباً ما يعاني موظف علم البيانات في فترة تعيينه الأولى من بعض الصعوبات التي تتجسد ببعض الفوضى وعدم الاستقرار وقلة التنظيم ولربما صعوبة التأقلم والارتباك خصوصاً في الأيام الأولى على أقل تقدير، ولكن لابد للموظف الجديد أن يتجاوز هذه العراقيل التي هي باعتقادي حالة طبيعية فتجاوز هذه المرحلة يعتبر أولى خطواته نحو النجاح والتطور
وما سنتناوله في مقالتنا هذه هو كيفية تهيئة الظروف المناسبة لبناء فريق عمل ناجح في وظيفة علم البيانات
يعتبر زملاء العمل هم البيئة التي تساعد كل شخص في هذه المجموعة على التقدم والتطور وعلى مختلف مستوياتهم، وكونك موظف مبتدئ ليعينك زميلك الذي تم تعيينه منذ فترة وجيزة على الإجابة عن أسئلة المبتدئين وسرعان ما تتشكل لديك فكرة عن أساسيات منظومة العمل للوظيفة، ومع نمو نشاطك وتتطور مستواك يمكن أن تبدأ مرحلة تلقي أفكار حول مجموعة خبرات ومهارات ممن هم أقدم منك في الوظيفة من ذوي الخبرة والكفاءة في العمل إلى أن تجد في نفسك ذلك الموظف المتمرس الذي بإمكانه مناقشة مديره في مواضيع أعمق وأدق، فالمدير بشكل عام يميل إلى الموظف الذي يقدم الاقتراحات ويبادر إلى المناقشة الفعالة عن طريق إبداء الآراء القيمة وتقديم الحلول المجدية
ولابد أنكم تتفقون معي بأننا إذا نظرنا إلى أي مجتمع وظيفي ناجح شركة كانت أم مؤسسة أو حتى ضمن القطاع الخاص نرى أن أساس النجاح يكمن روح التعاون والمحبة بين أعضاء الفريق على اختلاف على مستوياتهم وشهاداتهم
وفي مستهل الحديث عن مراحل التأسيس وخصوصاً في الشهر الأول من الوظيفة ننصح بالإكثار من الأسئلة فهي فترة مثالية لتلقي المعلومات وتحديد الأولويات وتعلم المفردات وذلك من خلال اتباع الإرشادات التالية
احرص على الانضمام إلى الوحدات الإرشادية التي تقدمها شركتك وهي مخصصة لتوجيه الموظفين الجدد فهي كفيلة بإطلاعِك على سياسة الشركة ونهج عملها من ناحية الخصوصية والأمن والأخلاق، كما وسيكون بإمكانك طلب أدلة إرشادية شاملة بما تحتاجه
اسعى دائماً للحصول على معلومات تخص عمل الفريق لكي تتمكن من مواكبة العمل معهم وذلك عن طريق التواصل المستمر مع مديرك ومحاولة تقديم اقتراحات تسهم في تقدُّم عمل الشركة، وحاول معرفة نوع التحديات التي تواجهها الشركة لتبدأ ببناء خطة ناجحة معتمداً على مهاراتك وأسلوبك للتغلب على المشاكل ومواجهة التحديات
اغتنم الفرصة في حال عدم وجود مستودعات داخلية لنشر مجموعات التحليلات وقم بجمع الأمثلة وإنشاء واحدة بحيث تصبح هذه المستودعات مهمة جداً للفريق والموظفين المستقبليين ولا تفوت على نفسك التعرف على العمل أو المشروع السابق للشركة – أي قبل فترة تعيينك – لتتكون لديك فكرة عن آلية عمل المشاريع القادمة
حاول البقاء على اطلاع مستمر على المواضيع الحالية في الشركة وذلك عن طريق الانضمام إلى اشتراكات البريد الإلكتروني ومنصات الدردشة الأخرى فانضمامك لهذه القنوات والتعرف على روداها ومشاركتهم الأفكار والخبرات يساعدك اكتساب مزيد من الخبرة
احرص على تقديم نفسك أمام مديرك وزملائك من خلال الاجتماعات وحاول بإيجاز طرح بعض أعمالك ومشاريعك التي قمت بها والحلول التي قدمتها خلال قيامك بالمشاريع أي باختصار أعطِ نظرة مبسطة عن إنجازاتك كتلك التي تحدثت عنها أثناء المقابلة، فاطلاع مديرك وزملائك على محفظة أعمالك سيرفع رصيدك العملي وسيزيد ثقتهم بك
وقد كنا قدر شرحنا في مقال سابق كيفية بناء محفظة أعمال في مجال علم البيانات للاطلاع اضغط هنا
من الضروري التعرُّف على جهات الاتصال الرئيسية في الشركة لذا يجب عليك طلب قائمة بجهات الاتصال من مديرك أو زملائك
Advertisements
ابدأ بتجهيز منظومة عملك الخاصة بعلوم البيانات
الخطوة الأولى هي إعداد الكمبيوتر الخاص بك ورفده بمعلومات تسجيل الدخول والوصول عن بعد، قم بتنزيل البرامج اللازمة لعملك واحصل على الدعم الفني ولا تنسى المعدات والأجهزة اللازمة
من المهم جداً أن تحصل على المعلومات في أسرع وقت ممكن بعد تعيينك إذ أن المعالجة تحتاج لبعض الوقت وعامل الوقت هنا مهم جداً، عليك المبادرة مباشرةً بسؤال مديرك والقائمين على العمل عن مجموعات البيانات التي تلزمك للتواصل معهم واطلب قائمة بمواقع الويب التي قد تحتاجها في عملك
بالتأكيد لا تنس تحميل البرامج التي يعتمد عليها فريقك في العمل بشكل مستمر كلغات البرمجة وأدوات تصور البيانات
فهم (الدومين): فهو أمر ضروري جداً يعينك على ضمان تفسير البيانات بشكل صحيح عند القيام بعمليات التحليل أو استخدام نموذج التعلم الآلي
مرحلة إثبات الكفاءة
بعد إتمامك لمرحلة التجهيز والإعداد الصحيحين يتوجب عليك تثبيت نفسك وإثبات كفاءتك وذلك باتباع الخطوات التالية
ابدأ رحلتك الوظيفية بالتعرف على زملائك وعرفهم عن نفسك كأن تطلب من مديرك أن يعملهم بتعيينك معهم في الفريق شاركهم آراءك وخبراتك ولو كانت متواضعة فهذا سيساعدهم على تحديد مستوى التفاعل معك وسيساعد في بناء روح التعاون والمشاركة بين أعضاء الفريق
الانطباع الأول هو الأثر الذي سينطبع عند زملائك منذ اللقاء الأول سواء كان على مستوى أخلاقك أو مستواك العلمي، فمن ناحية الأخلاق والتعامل يميل الناس بشكل عام نحو الشخص المتواضع والمحب والمتسامح ويسارعون لاكتساب صداقته ليكونوا مقربين منه، أما على المستوى العلمي فعندما يجد زملاؤك فيك الشخص المحب للتعاون وتشارك الأفكار والخبرات فستكون بنظرهم شخصاً مثالياً ونموذجاً للموظف الكفؤ
دع الآخرين يتعرفون على طبيعة عملك ومهمتك الأساسية في الشركة وابقهم على اطلاع دائم بأسلوب عملك وإنجازاتك كأن تضع روابط في الرسائل الإخبارية وتقدمها إلى الفريق
أخيراً.. أعتقد أنه باتباع هذه الخطوات يمكن تجاوز الفترة الأصعب في مرحلة التعيين في وظيفة جديدة، وهذا ما وصل إلى ذهني من أمور تعين على ذلك
إن كنتم أصدقائي ترون أن هناك أمور لم نتطرق إلى ذكرها قد تساعد على تأسيس فريق عمل ناجح فشاركونا فيها في التعليقات لنطبق ما قرآناه سابقاً على أرض الواقع ونبني فريقاً مصغراً يتبادل أعضاؤه المعلومات والخبرات بين الناشر والمتلقي .. وشكراً
This term stands for a process of statistical analysis to test the relationship between two continuous variables, the first is independent and the second is one dependent
This type of statistics is used to find the best line through a set of data points that in turn will reveal the best future predictions
The simple linear regression equation is as follows:
y = b0 + b1*x
y is the dependent variable
x represents the independent variable
b0 represents the y-intercept (the point of intersection of the y-axis with the line)
b1 represents the slope of the line
And by the method of least squares, we can get the most appropriate line, that is, the line that reduces the sum of the square differences between the actual and expected values of the value of y
We can also customize the work of linear regression to expand it to several independent variables, then it is called multiple linear regression, whose equation is as follows:
y = b0 + b1x1 + b2x2 +… + bn * xn
x1, x2, …, xn represent the independent variables
b1, b2, …, bn represent the corresponding variables
As mentioned above, linear regression is useful for obtaining future predictions, as is the case when predicting stock prices or determining future sales of a specific product, and this is done by making predictions about the dependent variable
However, there are cases in which the regression model is not very accurate, in the event that there are extreme values that do not take the direction of the data in general
In order to show the optimal treatment in linear regression in the presence of extreme values, the following figure is given
– Neutralizing outliers from the data set before training the model
– Minimize the effect of outliers by applying a transform as taking a data log
Use powerful regression methods such as RANSAC or Theil-Sen because they mitigate the negative impact of outliers more effectively than traditional linear regression.
However, it cannot be denied that linear regression is an effective and commonly used statistical method
2. Logistic regression
It is a statistical method used to obtain predictions for options that bear two options, i.e. binary outcome, by relying on one or more independent variables, and this regression has a role in classification and sorting functions, such as predicting customer behavior and other tasks.
The work of logistic regression is based on a sigmoid function that sets the input variables to a probability between 0 and 1, and then comes the role of the prediction to get the possible outcome
Logistic regression is represented by the following equation:
P(y = 1|x) represents the probability that the outcome of y is 1 compared to the input variables x
b0 represents the intercept
b1, b2, …, bn represent the coefficients of the input variables x1, x2, …, xn
By training the model on a data set and using the optimization algorithm, the coefficients are determined and then used to make predictions by entering new data and calculating the probability that the result is 1
In the following diagram we see the logistic regression model
By examining the previous diagram , we find that the input variables x1 and x2 were used to predict the result y that has two options.
This regression is tasked with assigning the input variables to a probability that will determine in the future the shape of the expectation of the outcome
The coefficients b1 and b2 are determined by training the model on a data set and setting the threshold to 0.5.
3. Support Vector Machines (SVMs)
SVM is a powerful algorithm for both classification and regression. It divides data points into different categories by finding the optimal level with maximum margin. SVMs have been successfully applied in various fields, including image recognition, text classification, and bioinformatics.
The cases where SVMs are used are when the data cannot be separated by a straight line, this channel can distribute the data over a high-dimensional swath to facilitate the detection of nonlinear boundaries
SVMs have proven memory utilization, they focus on storing only the support vectors without the entire data set, and they are highly efficient in high-dimensional spaces even if the number of features is greater than the number of samples
This technique is strong against outliers due to its dependence on support vectors
However, one of the drawbacks of this technique is that it is sensitive to kernel function selection, and it is not effective for large data sets, as its training time is often very long.
4. Decision Trees:
Decision trees are multi-pronged algorithms that build a tree-like model of decisions and their possible outcomes. By asking a series of questions, decision trees classify data into categories or predict continuous values. They are common in areas such as finance, customer segmentation, and manufacturing
So, it is a tree-like diagram, where each internal set forms a decision point, while the leaf node expresses prediction
To explain how the decision tree works:
The process of building the tree begins with selecting the root node so that it is easy to sort the data into different categories, then the data is iteratively divided into subgroups based on the values of the input features in order to find a classification formula that facilitates the sorting of the different data or required values
The decision tree diagram is easy to understand as it enables the user to create a well-defined visualization that allows the correct and beneficial decision-making
However, it should be known that the deeper the decision tree and the greater the number of its leaves, the greater the probability of neglecting the data, and this is one of the negative aspects of the decision tree.
If we want to talk about other negative aspects, it must be noted that the decision tree is often sensitive to the order of the input features, and this leads to different tree diagrams, and on the other hand, the final tree may not give the best result.
5. Random Forest:
The random forest is a group learning method that combines many decision trees to improve prediction accuracy. Each tree is built on a random subset of the training data and features. Random forests are effective for classification and regression tasks, finding applications in areas such as finance, healthcare, and bioinformatics.
Random forests are used if the data in a single decision tree is subject to overfitting, thus improving the model with greater accuracy
This forest is formed using the Bootstrapping technique which generates multiple decision trees
It is a statistical method based on randomly selecting data points and replacing them with the original data set. As a result, multiple data sets are formed that include a different set of data points that are later used to train individual decision trees.
Random forest allows to improve overall model performance by reducing the correlation between trees within a random forest because it relies on using a random subset of features for each tree and this method is called “random subspace”.
One of the drawbacks of a random forest is the higher computational cost of training and predictions as the number of trees in a forest increases
In addition to its lower interpretability compared to a single decision tree, it is superior to a single decision tree by being less prone to overfitting and having a higher ability to handle high-dimensional datasets.
Advertisements
6. Naive Bayes
Naive Bayes is a probability algorithm based on Bayes’ theory with the assumption of independence between features. Despite its simplicity, Naive Bayes performs well in many real-world applications, such as spam filtering, sentiment analysis, and document classification.
Based on Bayes’ theorem, the probability of a particular class is calculated according to the values of the input features
There are different types of probability distributions when implementing the Naive Bayes algorithm, depending on the type of data
Among them:
Gaussian: for continuous data
Multinomial: for discrete data
Bernoulli: for binary data
Turning to the advantages of using this algorithm, we can say that it enjoys its simplicity and quality in terms of its need for less training data compared to other algorithms, and it is also characterized by the ability to deal with missing data.
But if we want to talk about the negatives, we will collide with their dependence on the assumption of independence between features, which often contradicts real-world data.
In addition, it is negatively affected by the presence of features different from the data set, so the level of performance decreases and the required efficiency decreases with it
7. KNN
KNN is a non-parametric algorithm that classifies new data points based on their proximity to the seeded examples on the training set. It is widely used in pattern recognition and recommendation systems
KNN can handle classification and regression tasks.
That is, it relies on assigning similarity to similar data points
After choosing the k value, the value closest to the prediction, the data is sorted into training and test sets to make a prediction for a new input by calculating the distance between the entry and each data point in the training set, then choosing the k nearest data points to set the prediction later using the closest set of data points
8. K-means
The working principle of this algorithm is based on the random selection of k centroids
So that k represents the number of clusters we want to create and then each data point is mapped to the cluster that was closest to the central point
So it is an algorithm that relies on grouping similar data points together and it is based on distance so that distances are calculated to assign a point to a group
This algorithm is used in many market segmentation, image compression and many other widely used applications
The downside of this algorithm is that its assumptions for data sets often do not match the real world
9. Dimensional reduction algorithms
This algorithm aims to reduce the number of features in the data set while preserving the necessary information. This technique is called “Dimensional Reduction”.
Like many dimension reduction algorithms, this algorithm makes data visualization easy and simple.
As in Principal Components Analysis (PCA)
and linear discriminant analysis (LDA)
Distributed Random Neighborhood Modulation (t-SNE)
We will come to explain each one separately
* Principal Component Analysis (PCA): It is a linear pattern of dimension reduction. Principal components can be defined as a set of correlated variables that have been orthogonally transformed into uncorrelated linear variables. Its aim is to identify patterns in the data and reduce its dimensions while preserving the necessary information.
* Linear Discrimination Analysis (LDA): is a supervised dimensionality reduction pattern used to obtain the most discriminating features of the sorting and classifying function
It is a well-proven nonlinear dimension reduction technique for visualizing high-dimensional data in order to obtain a low-dimensional representation that prevents loss of data structure.
The downside of the dimension reduction technique is that some necessary information may be lost during the dimension reduction process
It is also necessary to know the type of data and the task to be performed in order to choose the dimension reduction technique, so the process of determining the appropriate number of dimensions to keep may be somewhat difficult.
10. Gradient boosting algorithm and AdaBoosting algorithm
They are two algorithms used in classification and regression functions and they are widely used in machine learning
The working principle of these two algorithms is based on forming an effective model by collecting several weak models
Gradient enhancement:
It depends on building a pattern in a progressive manner according to multiple stages, starting from installing a simple model on the data (such as a decision tree, for example) and then correcting the errors made by the previous models by adding additional models. Thus, each added model obtains agreement with the negative gradient of the loss function in terms of the predictions of the previous model.
In this way, the final output of the model is the result of assembling the individual models
AdaBoost:
It is an acronym for Adaptive Boosting. This algorithm is similar to its predecessor in terms of its mechanism of action by relying on creating a pattern for the forward staging method and differs from the gradient boosting algorithm by focusing on improving the performance of weak models by adjusting the weights of the training data in each iteration, i.e. it depends on the wrong training models according to the previous model. It then adjusts the weights for the erroneous models so that they have a higher probability of being selected in the next iteration until finally arriving at a model weighted for all individual models. These two algorithms are characterized by their ability to deal with wide types of numerical and categorical data, and they are also characterized by their strength in dealing with the extreme value and with data with missing values, so they are used in many practical applications
Advertisements
أشهر عشرة خوارزميات التعلم الآلي للعام 2024
Advertisements
1. الانحدار الخطي
يرمز هذا المصطلح إلى عملية تحليل إحصائي لاختبار العلاقة بين متغيرين مستمرين الأول مستقل والثاني تابع واحد
يستخدم هذا النوع من الإحصاء لإيجاد الخط الأفضل عن طريق مجموعة من نقاط البيانات التي بدورها ستكشف لنا التنبؤات المستقبلية الأفضل
:تتمثل معادلة الانحدار الخطي البسيط بالشكل التالي
y = b0 + b1*x
متغير التابع y يمثل
المتغير المستقل x يمثل
y تقاطع b0 يمثل
(مع الخط y نقطة تقاطع المحور)
ميل الخط b1 يمثل
وبطريقة المربعات الصغرى نستطيع الحصول على الخط الأنسب أي الخط الذي يقلل من مجموع الفروق المربعة بين القيم الفعلية
y والمتوقعة للقيمة
كما وأننا نستطيع تخصيص عمل الانحدار الخطي ليتوسع إلى عدة متغيرات مستقلة فيسمى عندها الانحدار الخطي المتعدد والذي تتمثل معادلته بالشكل التالي
y = b0 + b1x1 + b2x2 +… + bn * xn
المتغيرات المستقلة x1 ، x2 ، … ، xn تمثل
المتغيرات المقابلة b1 ، b2 ، … ، bn وتمثل
وكما ذكرنا آنفاً يفيد الانحدار الخطي للحصول على التنبؤات المستقبلية، كما هو الحال عند التنبؤ بأسعار الأسهم أو تحديد مبيعات مستقبلية لمنتج معين ويتم ذلك بإجراء تنبؤات حول المتغير التابع
إلا أنه يوجد حالات لا يكون فيها نموذج الانحدار دقيق جداً وذلك في حال وجود قيم متطرفة لا تأخذ اتجاه البيانات بشكل عام
ولتبيان التعامل الأمثل في الانحدار الخطي بوجود القيم المتطرفة على الشكل التالي
تحييد القيم المتطرفة وإبعادها من مجموعة البيانات قبل تدريب النموذج *
تقليل تأثير القيم المتطرفة عن طريق تطبيق تحويل كأخذ سجل البيانات *
Theil-Senأو RANSAC استخدام طرق الانحدار القوية مثل *
لأنها تخفف من التأثير السلبي للقيم المتطرفة بفعالية أكبر من الانحدار الخطي التقليدي
ومع ذلك لا يمكن إنكار أن الانحدار الخطي يعتبر طريقة إحصاء فعالة وشائعة الاستخدام
2. الانحدار اللوجستي
وهو طريقة إحصاء تستخدم للحصول على تنبؤات للخيارات التي تحتمل خيارين أي ثنائية النتيجة وذلك بالاعتماد على مغير مستقل أو أكثر كما وأن لهذا الانحدار دور في وظائف التصنيف والفرز كأن يتنبأ بسلوك العملاء وغيرها من المهام الأخرى
يعتمد عمل الانحدار اللوجستي على دالة سينية تقوم بتعيين متغيرات الإدخال
ومن خلال تدريب النموذج على مجموعة بيانات والاستعانة بخوارزمية التحسين يتم تحديد المعاملات ثم يتم استخدامه في إجراء التنبؤات عن طريق إدخال بيانات جديدة
1 وحساب احتمالية أن تكون النتيجة
في الشكل التالي نلاحظ نموذج الانحدار اللوجستي
وبدراسة الشكل السابق نجد أنه استُخدمت
y للتنبؤ بالنتيجة x2و x1 متغيرات الإدخال
التي تحتمل خيارين
يتولى هذا الانحدار مهمة تعيين متغيرات الإدخال إلى احتمالية والتي ستحدد مستقبلاً شكل التوقع للنتيجة
b2و b1 أما المعامِلان
فيتحددان من خلال تدريب النموذج على مجموعة بيانات
0.5 وتعيين الحد على
3. (SVMs)دعم آلات المتجهات
خوارزمية قوية لكل من التصنيف والانحدار SVM يعد
يقسم نقاط البيانات إلى فئات مختلفة من خلال إيجاد المستوى الأمثل مع الحد الأقصى للهامش
بنجاح في مجالات مختلفةSVMs تم تطبيق
بما في ذلك التعرف على الصور وتصنيف النص والمعلوماتية الحيوية
SVMs تعتبر الحالات التي تستخدم فيها
هي التي لا يمكن فيها فصل البيانات بخط مستقيم، فبإمكان هذه القنية أن توزع البيانات على رقعة عالية الأبعاد لتسهيل اكتشاف حدود غير خطية
قدرتها على استخدام الذاكرة SVMs أثبتت أجهزة
فهي تركز على تخزين متجهات الدعم فقط دون الحاجة إلى مجموعة البيانات كلها، كما وأنها تتمتع بكفاءة عالية في المساحات عالية الأبعاد حتى لو كان عدد الميزات أكبر من عدد العينات
تعتبر هذه التقنية قوية ضد القيم المتطرفة نظراً لاعتمادها على ناقلات الدعم
إلا أن أحد سلبيات هذه التقنية هو أنها
kernel حساسة لاختيار وظيفة
كما أنها غير فعالة لمجموعات البيانات الضخمة كونها وقت التدريب فيها طويل جداً على الأغلب
4. أشجار القرار
أشجار القرار هي خوارزميات متعددة الجوانب تبني نموذجًا شبيهًا بالشجرة من القرارات ونتائجها المحتملة. من خلال طرح سلسلة من الأسئلة، تصنف أشجار القرار البيانات إلى فئات أو تتنبأ بقيم مستمرة. وهي شائعة في مجالات مثل التمويل وتجزئة العملاء والتصنيع
إذاً هي مخطط يشبه الشجرة بحيث تشكل كل عدة داخلية نقطة قرار أما العقدة الورقية فتعبر عن التنبؤ
:ولشرح عمل شجرة القرار
تبدأ عملية بناء الشجرة باختيار عقدة الجذر بحيث يسهل فرز البيانات إلى فئات مختلفة، ثم يتم تقسيم البيانات إلى مجموعات فرعية بشكل متكرر بالاعتماد على قيم ميزات الإدخال بغية إيجاد صيغة تصنيفية تسهل فرز البيانات المختلفة أو القيم المطلوبة
مخطط شجرة القرار سهل الفهم فهو يمكن المستخدم من إنشاء تصور واضح المعالم يتيح اتخاذ القرار الصائب والمفيد
إلا يجب معرفة أنه كلما كانت شجرة القرار عميقة أكثر وكان عدد أوراقها أكبر كلما زاد احتمال التفريط في البيانات وهذا أحد الجوانب السلبية في شجرة القرار
وإذا أردنا التحدث عن جوانب سلبية أخرى فلابد من التنويه إلى أن شجرة القرار غالباً ما تكون حساسة لترتيب ميزات الإدخال وهذا يؤدي إلى مخططات شجرية مختلفة والمقابل قد لا تعطي الشجرة النهائية النتيجة الأفضل
Advertisements
5. الغابة العشوائية
الغابة العشوائية هي طريقة تعلم جماعية تجمع بين العديد من أشجار القرار لتحسين دقة التنبؤ، كل شجرة مبنية على مجموعة فرعية عشوائية من بيانات التدريب والميزات، تعتبر الغابات العشوائية فعالة في مهام التصنيف والانحدار وإيجاد تطبيقات في مجالات مثل التمويل والرعاية الصحية والمعلوماتية الحيوية
ويتم استخدام الغابات العشوائية في حال كانت البيانات في شجرة قرار واحدة معرضة للإفراط في التجهيز وبالتالي تحسين النموذج بدقة أكبر
Bootstrapping يتم تشكيل هذه الغابة باستخدام تقنية
التي تقوم بإنشاء أشجار قرارات متعددة
وهي طريقة إحصائية تعتمد على اختيار عشوائي لنقاط بيانات واستبدالها مع مجموعة البيانات الأصلية فتتشكل بالنتيجة مجموعات بيانات متعددة تتضمن مجموعة مختلفة من نقاط البيانات المستخدمة لاحقاً لتدريب أشجار القرار الفردية
تتيح الغابة العشوائية تحسين أداء النموذج بشكل عام عن طريق تقليل الارتباط بين الأشجار ضمن الغابة العشوائية لأنها تعتمد على استخدام مجموعة فرعية عشوائية من الميزات لكل شجرة وهذه الطريقة تسمى “الفضاء الجزئي العشوائي”
أحد سلبيات الغابة العشوائية يكمن في ارتفاع التكلفة الحسابية للتدريب والتنبؤات كلما زاد عدد الأشجار في الغابة علاوة على انخفاض قابلية التفسير مقارنة بشجرة قرار واحدة إلا أنها تتفوق على شجرة القرار الواحدة بكونها أقل عرضة للإفراط في التجهيز وقدرتها العالية على التعامل مع مجموعات بيانات عالية الأبعاد
6. Naive Bayes
هي خوارزمية احتمالية تعتمد على نظرية بايز مع افتراض الاستقلال بين الميزات
Naive Bayes على الرغم من بساطته فإن
يعمل بشكل جيد في العديد من تطبيقات العالم الحقيقي، مثل تصفية البريد العشوائي، وتحليل المشاعر، وتصنيف المستندات
بالاعتماد على نظرية بايز يتم حساب احتمالية فئة معينة وفق قيم ميزات الإدخال ويوجد أنواع مختلفة من التوزيعات الاحتمالية
تستخدم حسب نمط البيانات Naive Bayes عند تنفيذ خوارزمية
:نذكر منها
للبيانات المستمرة :Gaussian
للبيانات المنفصلة :Multinomial
للبيانات الثنائية :Bernoulli
وبالتطرق إلى إيجابيات استخدام هذه الخوارزمية فيمكننا القول أنها تتمتع ببساطتها وجودتها من حيث حاجتها لبيانات تدريب أقل مقارنة بالخوارزميات الأخرى وتتميز أيضاً بإمكانية التعامل مع البيانات المفقودة
أما إذا أردنا التحدث عن السلبيات فسنصطدم باعتمادها على افتراض الاستقلال بين الميزات والذي غالباً ما يتعارض مع بيانات العالم الواقعي
إضافة إلى أنها تتأثر سلباً بوجود ميزات مختلفة عن مجوعة البيانات فينخفض مستوى الأداء وتقل معها الكفاءة المطلوبة
7. KNN
هي خوارزمية غير معلمية تصنف نقاط البيانات الجديدة بناءً على قربها من الأمثلة المصنفة في مجموعة التدريب، يستخدم على نطاق واسع في التعرف على الأنماط وأنظمة التوصية
التعامل مع مهام التصنيف والانحدار KNN يمكن لـ
أي أنها تعتمد على إضفاء صفة التشابه على نقاط البيانات المتشابهة
القيمة الأقرب للتنبؤ k بعد اختيار قيمة
يتم فرز البيانات إلى مجموعات تدريب واختبار لعمل تنبؤ لمدخل جديد عن طريق حساب المسافة بين الإدخال وكل نقطة بيانات في مجموعة التدريب
أقرب نقاط البيانات k ثم تختار
ليتم تعيين التنبؤ لاحقاً باستخدام المجموعة الأكثر قرباً لنقاط البيانات
8. K-means
يعتمد مبدأ عمل هذه الخوارزمية
k centroids على الاختيار العشوائي لـ
عدد المجموعات التي نريد إنشاءها k بحيث تمثل
ثم يتم تحديد كل نقطة بيانات إلى المجموعة التي تم أقرب نقطة مركزية
إذاً هي خوارزمية تعتمد على تجميع نقاط البيانات المتشابهة معاً وهي قائمة على المسافة بحيث تُحسب المسافات لتعيين نقطة إلى مجموعة
تستخدم هذه الخوارزمية في كثير من تطبيقات تجزئة السوق وضغط الصور وغيرها العديد من التطبيقات الواسعة الاستخدام
يتمثل الجانب السلبي لهذه الخوارزمية هو أن افتراضاتها لمجموعات البيانات لا تطابق الواقع الحقيقي في أغلب حيان
9. خوارزميات تقليل الأبعاد
تهدف هذه الخوارزمية إلى تقليل عدد الميزات في مجموعة البيانات مع المحافظة على المعلومات الضرورية، تسمى هذه التقنية تقليل الأبعاد
تسهم هذه الخوارزمية في جعل تصور البيانات أمراً سهلاً وبسيطاً شأنها شأن كثير من خوارزميات تقليل الأبعاد
(PCA) كما في تحليل المكونات الرئيسية
(LDA) والتحليل التمييزي الخطي
(t-SNE) والتضمين المتجاور العشوائي الموزع
وسنأتي على شرح كل واحدة منها على حدا
: (PCA) تحليل المكون الرئيسي *
هو نمط خطي لتقليل الأبعاد، ويمكن تعريف المكونات الأساسية بأنها مجموعة من المتغيرات المرتبطة تم تحويلها تحويلاً متعامداً إلى متغيرات خطية غير مترابطة، الهدف منه تحديد الأنماط في البيانات وتقليل أبعادها مع المحافظة على المعلومات الضرورية
: (LDA) تحليل التمييز الخطي *
هو نمط تقليل الأبعاد خاضع للإشراف يستخدم بغية الحصول على السمات الأكثر تمييزاً لوظيفة الفرز والتصنيف
وهي تقنية لتقليل الأبعاد غير الخطية أثبتت جدارتها لتصور البيانات عالية الأبعاد بغية الحصول على تمثيل منخفض الأبعاد يَحُول دون فقدان بنية البيانات
تتمثل سلبيات تقنية تقليل الأبعاد هو أنه بعض المعلومات الضرورية قد تتعرض الفقدان أثناء عملية تقليل الأبعاد
كما وأنه من الضروري معرفة نوع البيانات والمهمة المطلوب تنفيذها لاختيار تقنية تقليل الأبعاد لذا قد تكون عملية تحديد العدد الأنسب للأبعاد للاحتفاظ بها صعبة نوعاً ما
10. AdaBoosting خوارزمية تعزيز التدرج وخوارزمية
وهما خوارزميتان تستخدمان في وظائف التصنيف والانحدار وهما تستخدمان على نطاق واسع في التعلم الآلي
يعتمد مبدأ عمل هاتين الخوارزميتين على تشكيل نموذج فعال من خلال جمع عدة نماذج ضعيفة
:تعزيز التدرج
تعتمد على بناء نمط بأسلوب تقدمي وفق مراحل متعددة انطلاقاً من تركيب نموذج بسيط على البيانات (كشجرة القرار مثلاً) ثم تصحيح الأخطاء التي ارتكبتها النماذج السابقة وذلك بإضافة نماذج إضافية وبذلك يحصل كل نموذج مضاف على توافق مع التدرج السلبي لوظيفة الخسارة من حيث تنبؤات النموذج السابق
وعلى هذا النحو يكون الناتج النهائي للنموذج هو حصيلة تجميع النماذج الفردية
:AdaBoost
Adaptive Boosting وهي اختصار لـ
تشبه هذه الخوارزمية سابقتها من حيث آلية عملها باعتمادها على إنشاء نمط لأسلوب المرحلي للأمام وتختلف عن خوارزمية تعزيز التدرج بتركيزها على تحسين أداء النماذج الضعيفة من خلال تعديل أوزان بيانات التدريب في كل تكرار أي أنها تعتمد على نماذج التدريب الخاطئة حسب النموذج السابق وثم تثوم بتعديل الأوزان النماذج الخاطئة بحيث يصبح لديها احتمال أكبر للاختيار في التكرار الذي يليه حتى الوصول في النهاية إلى نموذج مرجح لجميع النماذج الفردية
تمتاز هاتان الخوارزميتان إلى بقدرتهما على التعامل مع أنماط واسعة من البيانات الرقمية منها والفئوية وتمتازان أيضاً بقوتهما بالتعامل مع القيمة المتطرفة ومع البيانات ذات القيم المفقودة لذا تستخدمان في العديد من التطبيقات العملية
Structured Query Language (SQL) is the standard query language for relational databases. This language is simple and easy to understand, but moving to an advanced level in data analysis requires mastering the advanced techniques of this language.
And when we talk about the techniques that need to be learned to move to an advanced level, we are talking about a system of functions and features that allow you to perform complex tasks on data such as joining, aggregation, subqueries, window functions, and other functions that can deal with big data to obtain effective and accurate results.
Some vivid examples of using advanced SQL techniques
* Window functions
With this technique you can perform arithmetic operations across multiple rows related to the specified row
For example, if we have a table with the following columns:
order_id, customer_id, order_date and order_amount
It is required to calculate the current total sales for each individual customer sorted by order date
SUM can be used to perform this task
To calculate the current total for each individual customer, the SUM function must be applied to the order_amount column and divided by the customer_id column.
ORDER BY indicates that the rows are ordered according to the order dates in each section
Phrase:
ROWS BETWEEN UNBOUNDED PRECEDING AND CURRENT ROW
Indicates that the calculation is within the window between the rows at the beginning of the section up to the current row
The result of the query will come in the form of a table consisting of the same columns as the orders table, in addition to a column called run_total, which indicates the current total sales for each customer, and as we mentioned, arranged according to the dates of orders
* Common Table Phrases (CTEs)
CTEs allow you to get a set of results that can be used in SQL statements at a later time
For example: We have a table, let’s call it the Employees table, composed of the following columns:
employee_id, employee_name, department_id and salary
What is required is to calculate the average salary for each department, then search for employees with a higher salary than the average salary of the department to which they belong.
CTE can be used to perform two queries, the first to calculate the average salary of each department and the second to search for employees with higher salaries than the average salary of the department
We note here that the task has been divided into two phases to facilitate the query
The first stage is the salary calculation for each department
The second stage is to find the employees whose salary is higher than the average salary of the department to which they belong
In the first query, CTE, called department_avg_salary, which is assigned to calculate the salary for each department, using the AVG function and the GROUP BY statement, which sorts the employees according to the department to which they belong.
As for the second query, CTE, called department_avg_salary, it is used as if it were a table, then it is joined to the employees table in the department_id column, and then the result is extracted by WHERE to finally get the employees with the highest salary from the average salary of the department they belong to.
* Aggregate functions
Aggregate functions can be defined briefly as functions whose task is to perform an arithmetic operation on a group of values to derive a result in the form of a single value, such as performing arithmetic operations in a table on several rows or columns in order to obtain a useful data summary.
In fact, the use of aggregate functions is a real advantage in the SQL language, as it makes queries in it more easy and accurate.
The functions SUM, AVG, MIN, MAX, and COUNT are the most used in SQL
To be clear: we have a sales table composed of the following columns
sale_id, product_id, sale_date, sale_amount, and region
It is required to calculate the total sales and the average sales for each product separately, and then determine the best-selling product in each region
This is done by following the following steps
We have to sort the sales by product and region, calculate the total and average sales, then discover the best-selling product in the region by using aggregate functions
In this example, we use three aggregate functions AVG, SUM, and RANK
We will explain the task of each of them separately
AVG function calculates the average value of the product and the region
SUM function calculates the total value of each product and region using the GROUP BY statement
RANK function finds and explores the best-selling product in each region
To specify sorting by region, the OVER clause takes over this task
And to specify the column to divide the data (area) we use the PARTITION BY statement
As for getting the descending order of the sum of the value of each product in each region specified by the ORDER BY statement
The result of the query on a column shell is:
product_id, region, total_sale_amount, avg_sale_amount, and rank
So that the ranking column indicates the classification of each product in each region according to the total value of sale, so that the best-selling product in each region ranks first.
The uses of aggregate functions vary according to the tasks assigned to them. For example, you can calculate records, calculate maximum values, and other tasks.
Advertisements
* Pivot tables
They are tables that contain data extracted from large tables in order to analyze it easier, as it allows converting data from rows to columns to display the data in a more coordinated manner.
These tables are built using the PIVOT operator, whose task is to sort the data according to a specific column, and then show the results in the form of a formatted table.
To clarify
The PIVOT operator in the previous image is used to define the data axis by product_id plus columns per product and rows per customer
The SUM function calculates the total quantity of each product required by each customer
The p subquery extracts the necessary columns from the orders table
Then the PIVOT is run on the subquery in conjunction with the SUM function to find out the total quantity of each product ordered by each customer
The FOR statement is tasked with specifying the pivot column product_id in our example
The IN statement specifies target values ( [1], [2], [3], [4], [5] )
The pivot table appears as a result of a query for the total quantity ordered by each customer in the form of columns for each product and rows for each customer
* Subqueries
They are nested queries whose task is to retrieve data from one or more tables, and its results are used in the main query, and its function can be to sort and group data into one row or group of rows.
Subqueries such as SELECT, FROM, WHERE, HAVING are used within brackets in various places of the SQL statement.
To be clear: we have two tables
The first table is the employees table consisting of the following columns
employee_id, first_name, last_name, department_id
The second table is the payroll table and consists of the following columns
employee_id, salary, salary_date
It is required to know the highest paid employees in each department
We can find the highest salary in each department using a subquery and then join the result to the Employees and Salaries tables to extract the names of the employees who earn that salary
After executing the subquery as a first step, a result set representing the highest salary in each department is returned, then the employee and salary tables are linked to the result of the subquery by means of the main query to extract the names of the highest paid employees in each department.
To demonstrate this join process, an INNER JOIN statement is used to join the Employee and Salary tables, using the employee_id column as the join key.
The subquery is joined to the main query using the department_id column
The salary column is then used to match the highest salary in each department
The result appears in the form of a table containing the names of the highest paid employees in each department along with the department ID and salary
* Cross Joins
Cross Joins are a type of join operation that returns the Cartesian product of two or more tables without using a join condition, but by combining rows from one table with rows from another table separately, then the result is a table consisting of the available combinations of rows from both tables
This operation is useful in certain circumstances, such as performing a calculation that requires all available value combinations from a set of tables, or generating test data, for example
For clarity we have two tables
The first table is the customers table and it consists of columns
customer_id, customer_name, and city
The second table is the orders table and it consists of columns
order_id, customer_id, and order_date
The requirement is to know the total number of orders for each customer in each city
This is done by creating a result set that includes each customer with each city and then joining the result to the orders table to extract the number of requests for each group
The previous image shows that a result set has been created that includes each customer with each city, and thus the query is Use cross join to return the result set that contains a group that includes the customer and the city
The main query then joins the result of the cross-join with the orders table
Important Notes :
Here left join should be used to keep clients visible in the result even if they did not place any order
In order to ensure that the result of the number of requests for each customer appears in his city, the WHERE clause is used to sort the results and get the rows that match the city in which the customer resides in the cross join
To group the result according to the customer’s ID, name, and city, we use the GROUP BY statement
To calculate the number of orders per customer in each city, we use the COUNT() function.
The result is finally shown in the form of a table containing the total number of orders for each customer in each city
* temporary tables
These tables are relied upon to store the intermediate results in memory or on disk and use them at the end of the work and then get rid of them automatically
Or this type of table is used to divide large and complex queries into smaller parts to make it easier to process
The CREATE TEMPORARY TABLE statement is used to create temporary tables
The SELECT, INSERT, UPDATE, DELETE commands are used to process these tables as if they were regular tables in order to reduce the amount of large and complex data to facilitate processing.
For clarity, we have a sales table consisting of the following columns
date, product, category, sales_amount
It is required to create a report showing the total sales for each category for each month over the past year
We can address this issue through the following actions
The first goal is to obtain the total sales for each category. This is done by creating a temporary table that includes a summary of sales data for each month, and then linking it to the sales table.
This is done by following these steps
Create the temporary table using the CREATE TEMPORARY TABLE statement
A temporary table named Monthly_sales_summary is created with three columns:
month, category, and total_sales
The month column is of type DATE
category column of type VARCHAR (50)
total_sales column of type DECIMAL(10,2)
Using the INSERT INTO statement, we populate the temporary table with the shortened data
To separate the date column into the month level and group the sales data by month and category, we used the DATE_TRUNC function
Then we enter the result of this query into the month_sales_summary table, which now contains a summary of sales data for each month separately.
To get the total sales for each category we can join the temporary table with the sales table
The Sales table is joined with the Monthly_sales_summary table in the columns designated for category and month
From the temporary table, the month, category, and total_sales columns can be selected
To get the required result, which is last year’s sales data, we use the WHERE phrase
To sort the result by category and month we use the ORDER BY statement
The result of the query appears in the form of a table containing the total sales for each category for each month of the previous year
* Materialized Views
The task of these insights is to improve the performance of frequently executed queries, which are various results that are previously stored in the form of actual tables and are called to the original tables without the need to perform operations in them
This process is used to improve the performance of complex queries through data storage and business intelligence applications, which contributes to shortening the time for preparing reports and raising the efficiency of dashboards
The image above shows that an actual offer named Monthly_sales_summary has been created
This presentation contains a summary of sales data for each category for each month
We use the SELECT statement to store the result in the actual view
Actual views are automatically updated when the underlying data changes although they are similar to tables stored on disk, and can also be updated manually using the
REFRESH MATERIALIZED VIEW
You can query the actual view once it is created just like any other table
In the above image the category, month and total sales columns are selected from the actual view month_sales_summary and it sorts the result by category and month
As we mentioned earlier, with the actual view method, you can shorten a lot of the time it takes to run the query, as this method allows you to use pre-calculation and storage of summary data.
In conclusion:
Remember, my reader friend, that keeping abreast of developments and keeping pace with the accelerating technology is very important, and your knowledge of all new technologies and skills makes things easier for you and even increases your scientific level, whether in the field of programming and data analysis or in any other scientific field.
I hope that you have gained a great deal of interest, and please share this information and support the blog so that we can continue to provide everything new, and we are pleased to see your opinions on the comments, thank you.
Advertisements
SQLمجموعة تقنيات
متقدمة لا غنى عنها لكل عالِم بيانات
Advertisements
(SQL) لغة الاستعلام الهيكلية
هي لغة الاستعلام القياسية لقاعدة البيانات العلائقية، تمتاز هذه اللغة ببساطتها وسهولة فهمها، إلا أن الانتقال إلى مستوى متقدم في تحليل البيانات يتطلب إتقان التقنيات المتقدمة لهذه اللغة
وعندما نتحدث عن التقنيات المطلوب تعلمها للانتقال إلى مستوى متقدم فإننا نتحدث عن منظومة من الوظائف والميزات التي تتيح لك القيام بمهام معقدة على البيانات كالضم والتجميع والاستعلامات الفرعية ووظائف النافذة وغيرها من الوظائف الأخرى التي يمكنها التعامل مع البيانات الضخمة للحصول على نتائج فعالة ودقيقة
بعض الأمثلة الحية
المتقدمة SQL على استخدام تقنيات
وظائف النافذة *
من خلال هذه التقنية يمكنك تنفيذ عمليات حسابية عبر عدة صفوف مرتبطة بالصف المحدد
كأن يكون لدينا جدول طلبات يضم الأعمدة التالية
order_id, customer_id, order_date, order_amount
والمطلوب حساب المبيعات الإجمالي الحالي لكل عميل على حدة مرتبة حسب تاريخ الطلب
لتنفيذ هذه المهمة SUM بالإمكان الاستعانة بـ
ليتم حساب الإجمالي الحالي لكل عميل على حدى
SUM يجب تطبيق الدالة
order_amount على عمود
customer_id ويتم تقسيمها وفق العمود
ORDER BY تشير عبارة
إلى أن ترتيب الصفوف يتم وفق تواريخ الطلب في كل قسم
: تشير عبارة
ROWS BETWEEN UNBOUNDED PRECEDING AND CURRENT ROW
إلى أن الحساب يقع ضمن النافذة المحصورة بين الصفوف الواقعة في بداية القسم حتى الصف الحالي ستأتي نتيجة الاستعلام على شكل جدول مؤلف من نفس أعمدة جدول الطلبات
run_total مضافاً إليها عمود يسمى
والدال على المبيعات الإجمالية الحالية لكل عميل وكما ذكرنا مرتبة حسب تواريخ الطلبات
(CTEs)عبارات الجدول الشائعة*
CTEs تتيح لك
الحصول على مجموعة من النتائج التي يمكن الاستعانة بها
في وقت لاحق SQL في جمل
على سبيل المثال: لدينا جدول ولنطلق عليه اسم جدول الموظفين مؤلف من الأعمدة التالية
employee_id, employee_name, department_id, salary
والمطلوب حساب متوسط الراتب لكل قسم، ثم البحث عن الموظفين الأعلى راتباً من متوسط الراتب الخاص بالقسم الذي ينتمون إليه
لإجراء استعلامين CTE يمكن الاستعانة بـ
الأول لحساب متوسط الراتب كل قسم والثاني للبحث عن الموظفين الأعلى راتباً من متوسط راتب القسم
نلاحظ هنا أنه تم تقسيم المهمة إلى مرحلتين لتسهيل الاستعلام
مرحلة أولى وهي حساب الراتب لكل قسم
مرحلة ثانية إيجاد الموظفين الأعلى راتباً من متوسط راتب القسم الذي ينتمون إليه
CTE ففي الاستعلام الأول
department_avg_salary والمسمى
المخصص لحساب الراتب لكل قسم وذلك باستخدام
GROUP BY وعبارة AVG دالة
التي تقوم بفرز الموظفين كلٌ حسب القسم الذي ينتمي إليه
CTE أما الاستعلام الثاني
department_avg_salary المسمى
فيستخدم كما لو كان جدولاً ثم يتم
department_id ضمه إلى جدول الموظفين في العمود
WHERE ثم يتم استخلاص النتيجة بواسطة
لنحصل في النهاية على الموظفين الأعلى راتباً من متوسط الراتب الخاص بالقسم الذي ينتمون إليه
الدالات التجميعية *
يمكن تعريف الدالات التجميعية بشكل مختصر على أنها وظائف مهمتها إجراء عملية حسابية على مجموعة من القيم لاستخلاص نتيجة على شكل قيمة واحدة كإجراء عمليات حسابية في جدول على عدة صفوف أو أعمدة بغية الحصول على خلاصة بيانات مفيدة
وفي الحقيقة يعتبر استخدام الدالات التجميعية
SQL مكسباً حقيقياً في لغة
إذ تجعل الاستعلامات فيها أكثر سهولة ودقة
وتعتبر الدالات
SUM, AVG, MIN, MAX, COUNT
SQL هي الأكثر استخداماً في
وللتوضيح: لدينا جدول مبيعات مؤلف من الأعمدة التالية
sale_id, product_id, sale_date, sale_amount, region
والمطلوب حساب المبيعات الإجمالية ومتوسط المبيعات الخاصة بكل منتج على حدة ثم تحديد المنتج الأكثر مبيعاً في كل منطقة
يتم ذلك من خلال اتباع الخطوات التالية
علينا فرز المبيعات حسب المنتج والمنطقة وحساب إجمالي ومتوسط المبيعات ثم اكتشاف المنتج الأكثر مبيعاً في المنطقة وذلك عن طريق الاستعانة بالدالات التجميعية
استخدمنا في هذا المثال
AVG, SUM, RANK ثلاث دالات تجميعية
وسنبين مهمة كل واحدة منها على حدة
AVG الدالة
مهمتها حساب متوسط قيمة المنتج والمنطقة
SUM الدالة
مهمتها حساب القيمة الإجمالية لكل منتج والمنطقة
GROUP BY باستخدام عبارة
RANK الدالة
مهمتها استكشاف المنتج الأكثر مبيعاً في كل منطقة
ولتحديد الفرز وفق كل منطقة
هذه المهمة OVER تتولى عبارة
ولتحديد العمود لتقسيم البيانات (المنطقة)
PARTITION BY نستخدم عبارة
أما للحصول على الترتيب التنازلي لمجموع قيمة كل منتج في
بحيث يدل عمود الترتيب على تصنيف كل منتج في كل منطقة وفق القيمة الإجمالية للبيع بحيث يحصل المنتج الأكثر مبيعاً في كل منطقة على المرتبة الأولى
تتنوع استخدامات الدالات التجميعية حسب المهام الموكلة إليها فيمكنك مثلاً حساب السجلات وحساب الحد الأقصى للقيم وغيرها من المهام الأخرى
Advertisements
الجداول المحورية *
وهي جداول تحوي بيانات مستخلصة من جداول كبيرة بغية تحليلها بشكل أسهل بحيث تتيح تحويل البيانات من الصفوف إلى الأعمدة لعرض البيانات بشكل أكثر تنسيقاً
يتم بناء هذه الجداول
PIVOT بالاستعانة بعامل التشغيل
والذي مهمته فرز البيانات وفق عمود معين ثم إظهار النتائج على شكل جدول منسق
للتوضيح
PIVOT استُخدِمَ عامل التشغيل
في الصورة السابقة لتحديد محور البيانات
product_id حسب معرف المنتج
بالإضافة إلى أعمدة لكل منتج وصفوف لكل عميل
SUM يأتي دور الدالة
لتقوم بحساب الكمية الإجمالية لكل منتج مطلوب من قبل كل عميل
pأما الاستعلام الفرعي
يتولى مهمة استخراج الأعمدة الضرورية من جدول الطلبات
PIVOT ثم يتم تشغيل
على الاستعلام الفرعي بالتعاون
SUM مع الدالة
لمعرفة الكمية الإجمالية لكل منتج يتم طلبه من قبل كل عميل
FOR أما عبارة
product_id فمهمتها تحديد العمود المحوري
في مثالنا هذا
IN أما عبارة
تحدد القيم المستهدفة ( [1]، [2]، [3]، [4]، [5] )
يظهر الجدول المحوري كنتيجة للاستعلام عن الكمية الإجمالية التي طلبها كل عميل على شكل أعمدة لكل منتج وصفوف لكل عميل
الاستعلامات الفرعية *
وهي استعلامات متداخلة مهمتها استعادة بيانات من جدول واحد أو أكثر ونتائجها تستخدم في الاستعلام الرئيسي كما ويمكن أن تكون وظيفتها فرز البيانات وتجميعها في صف واحد أو مجموعة صفوف تستخدم الاستعلامات الفرعية مثل
SELECT, FROM, WHERE, HAVING
SQL ضمن أقواس في أماكن متعددة من عبارة
وللتوضيح: لدينا جدولين
الجدول الأول هو جدول الموظفين يتألف من الأعمدة التالية
employee_id, first_name, last_name, department_id
الجدول الثاني هو جدول الرواتب ويتألف من الأعمدة التالية
employee_id, salary, salary_date
والمطلوب معرفة الموظفين الأعلى راتباً في كل قسم
يمكننا إيجاد الراتب الأعلى في كل قسم باستخدام استعلام فرعي ثم ضم النتيجة إلى جدولَي الموظفين والرواتب لاستخلاص أسماء الموظفين الذين يتقاضون هذا الراتب
بعد تنفيذ الاستعلام الفرعي كخطوة أولى يتم إرجاع مجموعة نتائج تمثل الراتب الأعلى في كل قسم ثم يتم ربط جداول الموظفين والرواتب بنتيجة الاستعلام الفرعي بواسطة الاستعلام الرئيسي لاستخراج أسماء الموظفين الأعلى راتباً في كل قسم
ولشرح عملية الانضمام هذه
INNER JOIN تستخدم عبارة
للانضمام إلى جداول الموظفين والرواتب وذلك باستخدام
كمفتاح الانضمام employee_id العمود معرف الموظف
ويتم ربط الاستعلام الفرعي بالاستعلام الرئيسي
department_id باستخدام العمود معرف القسم
salary ثم يتم استخدام عمود الراتب
لمطابقة الراتب الأعلى في كل قسم
فتظهر النتيجة على شكل جدول يحوي أسماء الموظفين الأعلى راتباً في كل قسم بجانب معرف القسم والراتب
Cross Joins
Cross Joins عمليات الانضمام المتقاطعة
هي أحد أنواع عمليات الربط التي تعيد المنتج الديكارتي لجدولين أو أكثر دون استخدام شرط ربط بل بتجميع صفوف من جدول مع صفوف من جدول آخر كل على حدة ثم تكون النتيجة جدول يتألف من مجموعات الصفوف المتاحة من كلا الجدولين
تفيد هذه العملية في ظروف معينة كإجراء عملية حسابية تتطلب كل مجموعات القيمة المتاحة من مجموعة جداول أو إنشاء بيانات الاختبار مثلاً
للتوضيح لدينا جدولان
وهو يتألف من الأعمدة customers الجدول الأول هو جدول العملاء
customer_id, customer_name, city
وهو يتألف من الأعمدة orders الجدول الثاني هو جدول الطلبات
order_id, customer_id, order_date
المطلوب هو معرفة عدد الإجمالي لطلبات كل عميل في كل مدينة
يتم ذلك بإنشاء مجموعة نتائج تضم كل عميل مع كل مدينة ثم ضم النتيجة إلى جدول الطلبات لاستخراج عدد طلبات كل مجموعة
توضح الصورة السابقة أنه تم إنشاء مجموعة نتائج تضم كل عميل مع كل مدينة
cross join وبهذا يكون الاستعلام استخدم
لتعود مجموعة النتائج التي تحتوي مجموعة تضم العميل والمدينة
ثم ينضم الاستعلام الرئيسي إلى نتيجة الضم التبادلي مع جدول الطلبات
:ملاحظات هامة
left join هنا يجب استخدام
للمحافظة على ظهور العملاء في النتيجة حتى لو لم يقوموا بتقديم أي طلب
ولضمان ظهور نتيجة عدد طلبات كل عميل في مدينته
WHERE تستخدم عبارة
لفرز النتائج والحصول على الصفوف التي تطابق المدينة
cross join التي يقيم فيها العميل في
لتجميع النتيجة وفق معرف العميل واسمه ومدينته
GROUP BY نستخدم عبارة
ولحساب عدد طلبات كل عميل في كل مدينة
COUNT () نستخدم الدالة
تظهر النتيجة في النهاية على شكل جدول يحتوي العدد الإجمالي لطلبات كل عميل في كل مدينة
جداول مؤقتة *
يتم الاعتماد على هذه الجداول لتخزين النتائج الوسيطة في الذاكرة أو على القرص واستخدامها في نهاية العمل ثم التخلص منها تلقائياً
أو يستخدم هذا النوع من الجداول لتقسيم الاستعلامات الكبيرة والشائكة إلى أجزاء أصغر لتسهيل معالجتها
CREATE TEMPORARY TABLE تستخدم عبارة
لإنشاء الجداول المؤقتة
SELECT, INSERT, UPDATE, DELETE وتستخدم الأوامر
لمعالجة تلك الجداول كأنها جداول عادية بغية تقليل كمية البيانات الكبيرة والمعقدة لتسهيل معالجتها
وللتوضيح لدينا جدول مبيعات يتألف من الأعمدة التالية
date, product, category, sales_amount
والمطلوب إنشاء تقرير يبين المبيعات الإجمالية لكل فئة لكل شهر على خلال العام الفائت
يمكننا معالجة هذا الموضوع من خلال الإجراءات التالية
الهدف الأول هو الحصول على إجمالي المبيعات لكل فئة ويتم ذلك بإنشاء جدول مؤقت يشمل ملخص لبيانات المبيعات عن كل شهر ثم ربطه بجدول المبيعات
ويتم ذلك باتباع الخطوات التالية
:إنشاء الجدول المؤقت
وذلك باستخدام عبارة
CREATE TEMPORARY TABLE
Monthly_sales_summary فينشأ جدول مؤقت يسمى
يتألف من ثلاثة أعمدة
month, category, total_sales
DATEمن النوع month عمود الشهر
VARCHAR (50) من نوع category عمود الفئة
total_sales عمود إجمالي المبيعات
DECIMAL (10،2) من نوع
INSERT INTO وباستخدام عبارة
نقوم بتعبئة الجدول المؤقت بالبيانات المختصرة
لفصل عمود التاريخ إلى المستوى الشهر وتجميع بيانات المبيعات وفق الشهر والفئة
DATE_TRUNC استخدمنا الدالة
ثم نقوم بإدخال نتيجة هذا الاستعلام
month_sales_summary في جدول
الذي أصبح يحوي ملخص لبيانات مبيعات كل شهر على حدة وللحصول على إجمالي مبيعات كل فئة يمكننا الانضمام إلى الجدول المؤقت مع جدول المبيعات
يتم الانضمام إلى جدول المبيعات
Monthly_sales_summary مع جدول
في الأعمدة المخصصة للفئة والشهر
ومن الجدول المؤقت يمكن تحديد أعمدة
month, category, total_sales
ولنحصل على النتيجة المطلوبة وهي بيانات مبيعات العام الماضي
WHERE نستخدم عبارة
ولفرز النتيجة حسب الفئة والشهر
ORDER BY نستخدم عبارة
تظهر نتيجة الاستعلام على شكل جدول يحوي إجمالي المبيعات لكل فئة عن كل شهر من العام الفائت
الرؤى الفعلية *
مهمة هذه الرؤى تحسين أداء الاستعلامات التي يتم تنفيذها بشكل متكرر وهي عبارة عن نتائج متنوعة مخزنة مسبقاً على شكل جداول فعلية ويتم استدعاؤها إلى الجداول الأصلية دون الحاجة إلى إجراء العمليات فيها
يستفاد من هذه العملية في تحسين أداء الاستعلامات المعقدة من خلال تخزين البيانات وتطبيقات ذكاء الأعمال مما يسهم في اختصار الوقت بالنسبة لإعداد التقارير ورفع كفاءة لوحات المعلومات
توضح الصورة أعلاه أنه تم إنشاء
Monthly_sales_summary عرض فعلي اسمه
هذا العرض يحوي ملخص لبيانات المبيعات لكل فئة عن كل شهر
SELECT نستخدم عبارة
لتخزين النتيجة في الرؤية الفعلية
يتم تحديث طرق العرض الفعلية تلقائياً عندما تتغير البيانات الأساسية على الرغم من أنها تشبه الجداول من حيث تخزينها على القرص، كما ويمكن تحديثها يدوياً باستخدام عبارة
REFRESH MATERIALIZED VIEW
يمكنك الاستعلام عن العرض الفعلي بمجرد إنشائه كأي جدول آخر
في الصورة أعلاه يتم تحديد أعمدة الفئة والشهر وإجمالي المبيعات
month_sales_summary من طريقة العرض الفعلية
ويقوم بفرز النتيجة وفق الفئة والشهر
كما ذكرنا سابقاً بطريقة العرض الفعلي يمكنك اختصار الكثير من الوقت الذي يستغرقه تشغيل الاستعلام إذ أن هذه الطريقة تتيح لك استخدام الحساب المسبق لبيانات الملخص وتخزينها
:ختاماً
تذكر صديقي القارئ أن مواكبة التطورات والسير في ركب التكنولوجيا المتسارعة أمر غاية في الأهمية ومعرفتك بكل ما جديد من تقنيات ومهارات يسهل عليك كثيراً من الأمور بل ويزيد من مستواك العلمي سواء في مجال البرمجة وتحليل البيانات أو في أي مجال علمي آخر
أتمنى أن تكونوا قد حصلتم على قسط كبير من الفائدة ونرجو مشاركة هذه المعلومات ودعم المدونة لنستمر في تقديم كل ما هو جديد ويسعدنا مشاهدة آرائكم على التعليقات وشكراً
SQL is a powerful programming language dedicated to data in relational databases. It is a language that has existed for decades and is relied upon by many large companies around the world. Data analysts use it to access, read, process and analyze data saved in the database to form a comprehensive view that helps make the right decisions.
We will discuss in detail the mechanism and stages of working on this tool in terms of its query capabilities with databases, while mentioning the types of data analysis.
data analysis
All companies of all sizes and specializations seek advancement and growth, so their primary goal in this approach is to satisfy customers and provide them with the best services. By expanding the customer base, the company grows and thrives, and therefore most companies intend to examine, purify, transform and model data to extract valuable information that helps in making critical decisions, this process It’s called data analysis
Types of data analysis
This classification is done according to the types of data and terms of reference for the analysis process
Descriptive analysis:
It is the main analysis on which the rest of the types of analyzes are based, and it is the simplest, so it is the most used for data in all commercial activities at the present time. This analysis allows extracting trends between the raw data and giving a view of the events in their time. Here, the initial answer to “what happened” appears by summarizing the previous data, and it is usually represented in the form of a dashboard
Diagnostic analysis:
It is the step that immediately follows the previous step, which is to delve deeper into the previous question, “What happened?” This step is embodied in asking another question, which is “Why did it happen?” Diagnostic analysis, then, is the one that completes the work of the descriptive analysis by taking the initial readings resulting from the descriptive analysis and deepening them to interpret and analyze them in order to reach more correlations between the data, so that features of behavior patterns begin to form for us, and from the learned aspects also is that if problems arise during work, then you are Now you have enough data related to this problem, so the solution becomes easier, and thus this saves you from having to re-work
Predictive analytics:
It is complementary to the work of the two previous analyses, and from its name it seems that it makes probabilities and predictions about the events that will come later based on previous predictions in addition to the current variables. Thus, this analysis represents the answer to the third question, which is “what might happen in the future”?
This type of analysis helps companies make more accurate and effective decisions
Mandatory Analysis:
It is the final limit of data analysis capabilities, as it is not satisfied with forecasting or forecasting, but rather proposes options to benefit from the results of previous analyzes, and determines the steps that must be implemented in the event of a potential problem or forming a plan to develop work. This is done by using advanced techniques such as machine learning algorithms. Especially when dealing with huge amounts of data
So this analysis is the answer to the question “what should we do next”? Which defines the general approach to the company’s business plan
What are the advantages of SQL when used in data analysis?
* Easy and uncomplicated language
* Speed in query processing
* Ability to call up big data from different databases
* Providing various documents to analysts
Advertisements
Explain the use of SQL in data analysis
Temporary tables
Temporary tables in SQL are defined as tables that are created to perform a temporary task and persist for a specific period of time or during a session by storing and processing intermediate results using the same join, select, and update techniques.
Assembly as per requirement
For example, this phrase is used to count the number of employees in each department or to obtain the salaries of the department in total, so it is used to extract summary data based on different groups, whether on one or more columns
aggregation functions
Its task is to perform an arithmetic operation on a set of values to extract a single value
String functions and operations
The task of SQL string operators is to perform matching on the form, sequence, capitalize the string, and other matching functions
Date and time operations
Some of the services offered by SQL are many types of date and time tasks such as
SYSUTCDATETIME()
CURRENT_TIMESTAMP
GETDATE()
DAY()
MONTH()
YEAR()
DATEFROMPARTS()
DATETIME2FROMPARTS()
TIMEFROMPARTS()
DATEDIFF()
DATEADD()
ISDATE()
etc. It is used to implement date and time entries
Display and indexing methods
The database is the main repository for the index, so indexing the view helps speed up work and improve the performance of queries and applications that use it
Join:
This statement is used to combine different tables in databases using a primary key and a foreign key
The following explains the different types of JOINs in SQL with an example of data in left and right tables
(INNER) JOIN: Returns records that contain identical values in both tables
LEFT (OUTER) JOIN: Returns all records from the left table and matching records from the right table
RIGHT (OUTER) JOIN : Returns all records from the right table and matching records from the left table
FULL (OUTER) JOIN : Returns all records when there is a match in the left or right table
windows functionality
They are intended to work within an array of rows to extract one value per row from the underlying query so they simplify queries as much as possible
nested queries
It is a query inside another query, and the result of the inner query is used by the outer query
Data analysis tools:
SQL: The standard programming language for performing programming used to communicate with relational databases, and it also has a major role in retrieving the required information.
Python: a versatile programming language, which is very popular in the field of technology and programming, and no data analyst can do without it. It relies on the principle of its work on readability, so it is not classified within complex programming languages. different analysis
R: Its tasks and features are not much different from Python, except that it is specialized in performing statistical analysis of data
Microsoft Excel: The most famous program in the world in the field of spreadsheets. It has many different features, ranging from scheduling, performing calculations, and typical graphing functions for data analysis.
Tableau: It is intended for creating visualizations and interactive dashboards without the need for high coding expertise, so it is the perfect tool for commercial data analysis
In conclusion
We put in your hands, dear reader, everything related to the SQL language
If you see that there is information that we did not mention regarding this programming language, share it with us in the comments to exchange information and benefit everyone, Thank you.
Advertisements
لتحليل البيانات SQL إضاءة شاملة على
Advertisements
هي لغة برمجة قوية SQL
مخصصة للبيانات الموجودة في قواعد البيانات العلائقية وهي لغة موجودة منذ عشرات السنين وتعتمد عليها الكثير من الشركات الكبرى في جميع أنحاء العالم إذ يستخدمها محللو البيانات للوصول إلى البيانات المحفوظة في قاعدة البيانات وقراءتها ومعالجتها وتحليلها لتكوين رؤية شاملة تساعد على اتخاذ القرارات الصحيحة
وسنتناول بالتفصيل آلية ومراحل العمل على هذه الأداة من حيث إمكانات استعلاماتها مع قواعد البيانات مع ذِكر أنوع تحليل البيانات
تحليل البيانات
تسعى جميع الشركات على مختلف أحجامها واختصاصاتها إلى الارتقاء والنمو لذا هدفها الأساسي في هذا النهج هو إرضاء العملاء وتقديم أفضل الخدمات لهم فبتوسع قاعدة العملاء تنمو الشركة وتزدهر وبالتالي تعمد معظم الشركات على فحص وتنقية وتحويل ونمذجة البيانات لاستخراج معلومات قيّمة تساعد في اتخاذ القرارات الحاسمة، هذه العملية تسمى تحليل البيانات
أنواع تحليل البيانات
ويتم هذا التصنيف حسب أنواع البيانات والاختصاصات المحددة لعملية التحليل
:التحليل الوصفي
هو التحليل الرئيسي الذي ترتكز عليه باقي أنواع التحليلات وهو أبسطها لذا فهو الأكثر استعمالاً للبيانات في كافة النشاطات التجارية في الوقت الراهن. يسمح هذا التحليل باستخلاص الاتجاهات بين البيانات الأولية وإعطاء نظرة عن الأحداث في وقتها وهنا تظهر الإجابة الأولية على “ماذا حدث” من خلال تلخيص البيانات السابقة وتتمثل عادة على شكل لوحة معلومات
:التحليل التشخيصي
وهو الخطوة التي تلي الخطوة السابقة مباشرة والتي تتمثل في التعمق أكثر في السؤال السابق “ماذا حدث” فتتجسد هذه الخطوة في طرح سؤال آخر وهو “لماذا حدث”؟ فالتحليل التشخيصي إذاً هو الذي يتمم عمل التحليل الوصفي من خلال أخذ القراءات الأولية الناتجة عن التحليل الوصفي والتعمق بها لتفسيرها وتحليلها بغية الوصول إلى المزيد من ترابطات بين البيانات فتبدأ تتشكل لنا معالم أنماط السلوك ومن الجوانب المستفادة أيضاً هو أنه في حال ظهور مشكلات أثناء العمل فحكماً أنت أصبح لديك البيانات الكافية المتعلقة بهذه المشكلة فيصبح الحل أسهل وبالتالي هذا يغنيك عن تضطر لإعادة العمل
:التحليلات التنبؤية
وهو متمم لعمل التحليلين السابقين، ومن اسمه يبدو أن يقوم بوضع احتمالات وتنبؤات حول الأحداث التي ستأتي فيما بعد بناءً على تنبؤات سابقة إلى جانب المتغيرات الراهنة وبالتالي يمثل هذا التحليل الإجابة عن السؤال الثالث وهو “ماذا يمكن أن يحدث في المستقبل”؟
يساعد هذا النوع من التحليل على اتخاذ قرارات أكثر دقة وفاعلية للشركات
:التحليل الإلزامي
وهو الحد النهائي لقدرات تحليل البيانات، حيث أنه لا يكتفي بالتوقّع أو التنبؤ بل يقوم باقتراح خيارات للاستفادة من النتائج التحليلات السابقة، وتحديد الخطوات التي يجب تنفيذها في حال حدوث مشكلة محتملة أو تشكيل خطة لتطوير العمل، يتم ذلك عن طريق استخدام تقنيات متطورة كخوارزميات التعليم الآلي وخصوصاً عند التعامل مع كميات ضخمة من البيانات
إذاً هذا التحليل هو الإجابة عن السؤال “ماذا يجب أن نفعل بعد ذلك”؟ والذي يحدد النهج العام لخطة عمل الشركة
عند استخدامه في تحليل البيانات؟SQLماهي ميزات
لغة سهلة وغير معقدة *
السرعة في معالجة الاستعلام *
القدرة على استدعاء البيانات الضخمة من قواعد البيانات مختلفة *
توفير وثائق متنوعة للمحللين *
Advertisements
في تحليل البياناتSQL شرح استخدام
الجداول المؤقتة
SQL تعرف الجداول المؤقتة في
على أنها الجداول التي يتم انشاؤها لتنفيذ مهمة مؤقتة ويستمر وجودها لمدة زمنية محددة أو خلال جلسة ما عن طريق تخزين النتائج الوسيطة ومعالجتها باستخدام نفس تقنيات الانضمام والتحديد والتحديث
التجميع حسب الشرط
على سبيل المثال تستخدم هذه العبارة لإحصاء عدد الموظفين في كل قسم أو الحصول على رواتب القسم بالمجمل، إذاً هي تستخدم لاستخراج بيانات التلخيص بناءً على مجموعات مختلفة سواء على عمود أو أكثر
وظائف التجميع
مهمتها تنفيذ عملية حسابية على مجموعة من القيم لاستخراج قيمة واحدة
وظائف وعمليات السلسلة
SQL مهمة عوامل تشغيل السلسلة في
هي تنفيذ المطابقة على النموذج والتسلسل وجعل السلسلة تبتدئ بحروف كبيرة وغيرها من وظائف المطابقة الأخرى
عمليات التاريخ والوقت
SQL من الخدمات التي يقدمها
أنواع عديدة من مهام التاريخ والوقت مثل
SYSUTCDATETIME ()
CURRENT_TIMESTAMP
GETDATE ()
DAY ()
MONTH ()
YEAR ()
DATEFROMPARTS ()
DATETIME2FROMPARTS ()
TIMEFROMPARTS ()
DATEDIFF ()
DATEADD ()
ISDATE ()
وغيرها وهي تستخدم لتنفيذ إدخالات التاريخ والوقت
طرق العرض والفهرسة
تعتبر قاعدة البيانات المستودع الرئيسي للفهرس لذا فعملية فهرسة العرض تساعد على تسريع العمل وتحسين أداء الاستعلامات والتطبيقات التي تستخدمها
:Joins
تستخدم هذه العبارة لدمج جداول مختلفة في قواعد البيانات ويتم ذلك باستخدام مفتاح أساسي ومفتاح خارجي
SQL في JOINS فيما يلي شرح الأنواع المختلفة من
ضمن مثال على بيانات في جدولين يميني ويساري
: (INNER) JOIN
إرجاع السجلات التي تحتوي على قيم متطابقة في كلا الجدولين
: LEFT (OUTER) JOIN
إرجاع كافة السجلات من الجدول الأيسر والسجلات المتطابقة من الجدول الأيمن
:RIGHT (OUTER) JOIN
إرجاع كافة السجلات من الجدول الأيمن والسجلات المتطابقة من الجدول الأيسر
:FULL (OUTER) JOIN
إرجاع كافة السجلات عند وجود تطابق في الجدول الأيمن أو الأيسر
وظائف النوافذ
مخصصة للعمل ضمن مجموعة من الصفوف لاستخراج قيمة واحدة لكل صف من الاستعلام الأساسي لذا فهي تبسط الاستعلامات قدر الإمكان
الاستعلامات المتداخلة
وهو استعلام داخل استعلام آخر ويتم استخدام نتيجة استعلام الداخلي بواسطة الاستعلام الخارجي
:أدوات تحليل البيانات
لغة البرمجة النموذجية :SQL
لإجراء البرمجة المستخدمة للتواصل مع قواعد البيانات العلائقية، كما ولها دور رئيسي في استرجاع الملومات المطلوبة
: بايثون
لغة برمجة متعددة الاستخدامات، تلقى رواجاً كبيراً في مجال التكنولوجيا والبرمجة ولا يمكن لأي محلل بيانات الاستغناء عنها، تعتمد في مبدأ عملها على قابلية القراءة لذا لا تصنف ضمن لغات البرمجة المعقدة، تضم عدد كبير من المكتبات المتنوعة وفق متطلبات المهمة المراد تنفيذها في عمليات التحليل المختلفة
: R لغة
لا تختلف مهامها وميزاتها كثيراً عن بايثون إلا أنها متخصصة في إجراء عمليات التحليل الإحصائي للبيانات
مايكروسوفت إكسل: البرامج الأشهر على مستوى العالم في مجال الجداول، يتمتع بميزات عديدة ومختلفة تتنوع بين الجدولة وتنفيذ العمليات الحسابية ووظائف الرسوم البيانية النموذجية لتحليل البيانات
: Tableau
وهو مخصص لإنشاء التصورات ولوحات المعلومات التفاعلية دون الحاجة إلى خبرة عالية في الترميز إذاً يعتبر الأداة الأمثل لتحليل البيانات التجارية
ختاماً
وضعنا بين يديك عزيزي القارئ
SQL كل ما يتعلق بلغة
فإن كنت ترى أن هناك معلومات لم نقم بذكرها فيما يتعلق بلغة البرمجة هذه شاركنا بها في التعليقات لنتبادل المعلومات ولتعم الاستفادة للجميع وشكراً
Although the job market in data science requires skill and experience, lack of experience or even a lack of it does not prevent you from getting a data science job. How is that done? This is what we will discuss in this article
It is noticeable in recent years the great interest in the development of data science of all kinds, such as big data generated by smart devices and the diversity of computer resources such as cloud computing. On the other hand, the development of algorithms has received a great deal of attention.
In addition, the diversity of the fields of the labor market in data science, which includes health, transportation, and industry sectors, in addition to academic, environmental, security, and other activities.
And with the diversity of areas that branch out from data science, such as data analysis, predictive analysis, machine learning, deep learning, data visualization, and other branches.
All these factors have led to an increased demand for data scientists, who have a variety of fields of employment, with a variety of available opportunities, including:
Data Scientist, Data Analyst, Predictive Analyst, Business Analyst, AI Writer, Data Visualizer, Data Engineer
So we are going to give you a set of tips that will help you get a job in data science
1. Learn key skills:
It is necessary to learn the basic principles of data science by following good-level online training courses, and it is preferable to obtain a degree in a university, and these skills include:
Problem Solving, Decision Making, Programming (Python or R), Statistics, Mathematics (Linear Algebra and Calculus), Machine Learning, Deep Learning, Data Visualization, Report Writing
Mastering these skills will increase your chance of getting a job in data science
2. Learn about data science libraries:
The most famous of these libraries:
NumPy, Pandas, Matplotlib, Seaborn, Scikit-Learn, Tensorflow, Keras
And other libraries that must be recognized
3. Stay up-to-date with developments and developments:
One may think that once he gets the job, he no longer needs to keep up with new developments and technologies in this field, but this view is wrong par excellence. Staying abreast of developments in data science increases the skills and experience of the learner because forgetting or interrupting learning is the first enemy of progress and distinction.
4. Specialization in a specific field:
Especially for those who do not have the comprehensive experience that qualifies them to get a job in data science. Therefore, expanding the mastery of a specific field in one of the sub-fields is considered an effective weapon in the hands of its bearer, as is the case in mastering machine learning or deep learning.
5. Self-training on practical experiences:
This advice is specifically directed at learning and developing machine learning algorithms. After the learning stage comes the stage of being able to write code that leads to algorithmic outputs that produce real data, and this will pave the way for you to be able to modify codes, produce new outputs, and make comparisons and analyzes.
Advertisements
6. Take notes
Recording notes and all the experiences you have learned will help you to retrieve information when you need to refer to it, and with the passage of time it will form a blog that you can benefit from in the future so that you can build your own brand.
7. Follow online training courses
It is widely available on the Internet, but be sure to follow the reliable courses in terms of information led by trainers with scientific weight in this field
Start by learning the principles of data science, machine learning, deep learning, and other technologies
And I recommend courses offered by famous platforms such as Coursera, as they offer scientific degrees in cooperation with the best universities in the world, and it is not necessary to apply for paid courses in order for the novice learner to start developing his skills, as the free courses are sufficient for such cases
8. Support your CV with a professional certificate
In continuation of what was stated in the previous paragraph, you can obtain a certificate after you have followed a paid course. This certificate is considered an official document indicating your level of experience and skill.
9. Create a community of data scientists
It is one of the things that increase your chances of being accepted into a job in data science
The following platforms are fertile environments for building a community of data scientists
LinkedIn: A scientific community is built by creating and sharing data science posts on the platform
Medium: Through it, you can create a blog related to data science and build an information network
Kaggle: Through it, you can participate in data science competitions and build a network
10. Completion of projects in accordance with the requirements of the potential job
You must complete projects related to the field of work that you prefer to apply for in the potential job, for example, if you prefer to apply for a job in the field of data visualization, you must implement projects related to data visualization
11. Start your career at a low job level
As working at low job levels does not require you to have a lot of sufficient experience as a beginner in the job, and with the acquisition of more experience, you can search for a higher-level job, but the right start for the inexperienced starts from a mini-work environment
12. Build a distinguished resume
Building a distinguished CV reflects a positive impression on decision makers in employment matters, and thus will support your chances of getting a job.
And we can call the characteristic of excellence on the resume if it has the factors we mentioned in a previous article, you can view them by reading the article in detail from here How to write a killer resume and ace the interview
Advertisements
بقليل من الخبرة يمكنك أن تحصل على وظيفة في علوم البيانات
Advertisements
رغم أن سوق العمل في علم البيانات يتطلب المهارة والخبرة إلا أن قلة الخبرة أو حتى انعدامها لا يمنع من أن تحصل على وظيفة علم البيانات كيف يتم ذلك؟ هذا ما سنناقشه في هذا المقال
من الملاحظ في السنوات الأخيرة الاهتمام الكبير بتطوير علوم البيانات بأنواعها كالبيانات الضخمة المتولدة عن طريق الأجهزة الذكية وتنوع الموارد الحاسوبية كالحوسبة السحابية، ومن جانب آخر نال تطوير الخوارزميات حيزاً كبيراً من الاهتمام، والجانب الأكثر أهمية من ذلك أن مجالات العمل في علم البيانات ذات مصدر مفتوح
علاوة على ذلك تنوع مجالات سوق العمل في علم البيانات والتي تشمل قطاعات الصحة والنقل والصناعة إضافة إلى النشاطات الأكاديمية والبيئية والأمنية وغيرها من الفعاليات الأخرى
ومع تنوع المجالات التي تتفرع عن علم البيانات كتحليل البيانات والتحليل التنبؤي والتعلم الآلي والتعلم العميق وتصور البيانات وغيرها من الفروع الأخرى
كل هذه العوامل أدت إلى تزايد الطلب على علماء البيانات الذين تنوعت أمامهم مجالات التوظيف مع تنوع الفرص المتاحة والتي نعدد منها
عالم بيانات، محلل بيانات، محلل تنبؤي، محلل الأعمال، كاتب الذكاء الاصطناعي، مصور البيانات، مهندس بيانات
لذا سنتقدم لك مجموعة نصائح تساعدك على الحصول على وظيفة في علم البيانات
1- :تعلم المهارات الرئيسية
من الضروري تعلم المبادئ الأساسية لعلم البيانات وذلك عن طريق متابعة دورات تدريبية ذات مستوى جيد عبر الإنترنت كما ويفضل الحصول على شهادة في إحدى الجامعات وتشمل هذه المهارات
(R حل المشكلات، صنع القرار، البرمجة ( بايثون أو
الإحصاء، الرياضيات (الجبر الخطي وحساب التفاضل والتكامل)، التعلم الآلي، التعلم العميق، تصور البيانات، كتابة التقارير
إتقان هذه المهارات سيزيد فرصتك في الحصول على وظيفة في علم البيانات
2- :التعرف على مكتبات علوم البيانات
:وأشهر هذه المكتبات
NumPy, Pandas, Matplotlib, Seaborn, Scikit-Learn, Tensorflow, Keras
وغيرها من المكتبات التي لابد من التعرف عليها
3- :الاطلاع على المستجدات والتطورات بشكل مستمر
قد يعتقد المرء أنه بمجرد حصوله على الوظيفة فإنه لم يعد بحاجة إلى مواكبة التطورات والتقنيات الجديدة في هذا المجال إلا أن هذه النظرة خاطئة بامتياز فالبقاء على اطلاع دائم على تطورات علم البيانات يزيد المهارات والخبرات عند المتعلم لأن النسيان أو الانقطاع عن التعلم هو العدو الأول للتقدم والتميز
4- :التخصص في مجال معين
وخصوصاً للذين لا يمتلكون الخبرة الشاملة التي تؤهلهم للحصول على الوظيفة في علم البيانات لذا فالتوسع في إتقان مجال معين في إحدى المجالات الفرعية يعتبر سلاح فعال بيد حامله كما هو الحال في إتقان التعلم الآلي أو التعلم العميق
5-:التدرب الذاتي على الخبرات العملية
وهذه النصيحة موجهة خصيصاً لتعلم وتطوير خوارزميات التعلم الآلي فبعد مرحلة التعلم تأتي مرحلة القدرة على كتابة الكودات البرمجية المؤدية إلى مخرجات خوارزميات تنتج بيانات حقيقية، وهذا سيمهد أمامك الطريق لتصبح قادراً على تعديل الكودات وإنتاج مخرجات جديدة وإجراء المقارنات والتحليلات
Advertisements
6- :تدوين الملاحظات
تسجيل الملاحظات وكل ما تعلمته من خبرات سيعينك على استعادة المعلومات عند الحاجة إلى الرجوع إليها وسيشكل مع مرور الزمن مدونة يمكنك الاستفادة منها مستقبلاً بحيث تبني لك علامة تجارية خاصة بك
7-:متابعة دورات تدريبية عبر الإنترنت
وهي متوفرة بشكل كبير على شبكة الإنترنت ولكن احرص على اتباع الدورات الموثوقة من حيث المعلومات يقودها مدربون يتمتعون بثقل علمي في هذا المجال
ابدأ من تعلم مبادئ علوم البيانات والتعلم الآلي والتعلم العميق وغيرها من التقنيات
Coursera وأوصي بدورات تقدمها منصات شهيرة مثل
فهي تقدم شهادات علمية بالتعاون مع أفضل الجامعات في العالم، ولا يشترط التقدم إلى الدورات المدفوعة لكي يبدأ المتعلم المبتدئ بتطوير مهاراته فالدورات المجانية تفي بالغرض لمثل هذه الحالات
8- :ادعم سيرتك الذاتية بشهادة مهنية
واستطراداً لما ورد في الفقرة السابقة يمكنك الحصول على شهادة بعد اتباعك لدورة مدفوعة وتعتبر هذه الشهادة وثيقة رسمية تدل على مستوى خبرتك ومهارتك
9- :إنشاء مجتمع علماء البيانات
وهي من الأمور التي ترفع من حظوظك في القبول في وظيفة في علم البيانات
وتعتبر المنصات الأساسية التالية بيئات خصبة لبناء مجتمع يضم علماء البيانات
: LinkedIn
يتم بناء مجتمع علمي عن طريق إنشاء منشورات علوم البيانات ومشاركتها على المنصة
: Medium
ومن خلالها يمكنك إنشاء مدونة تتعلق بعلم البيانات وبناء شبكة معلومات
: Kaggle
ومن خلالها يمكنك المشاركة في مسابقات علوم البيانات وبناء شبكة
10- :إنجاز مشاريع وفق متطلبات الوظيفة المحتملة
عليك إنجاز مشاريع تتعلق بمجال العمل الذي تفضل التقدم إليه في الوظيفة المحتملة، مثلاً إن كنت تفضل التقدم على وظيفة في مجال تصور البيانات فيجب عليك تنفيذ مشاريع تتعلق بتصور البيانات
11- :ابدأ مسيرتك الوظيفية بمستوى وظيفي منخفض
إذ أن العمل في مستويات وظيفية منخفضة لا يحتاج منك الكثير من الخبرة الكافية كمبتدئ في الوظيفة، ويمكنك مع اكتساب مزيد من الخبرات أن تبحث عن وظيفة ذات مستوى أعلى لكن البداية الصحيحة بالنسبة لقليلي الخبرة تنطلق من بيئة عمل مصغرة
12- :بناء سيرة ذاتية متميزة
بناؤك لسيرة ذاتية متميزة يعكس انطباعاً إيجابياً لدى أصحاب القرار في أمور التوظيف وبالتالي ستدعم حظوظك في الحصول الوظيفة
ويمكن أن نطلق صفة التميز على السيرة الذاتية إذا توفرت فيها عوامل ذكرناها في مقال سابق يمكنك الاطلاع عليها من خلال قراءة المقال بشكل مفصل من هنا
With the development of data analysis tools and software, users of Tableau visualizations can save time and effort by taking advantage of the integration between ChatGpt and Tableau, thus automating processing with more flexibility.
How is that done? This is what we will explain in our article today, let’s get started
As we mentioned, the process will be done using the ChatGPT application. What is the concept of this application?
We will not go into complex technical details that explain the mechanism of action of this application, as this is not our topic today, and we may devote a detailed explanation to it in the coming days, but what we are interested in explaining now is what serves the topic we are talking about, which is integration with Tableau functions
ChatGPT is a conversational bot based on artificial intelligence with its amazing capabilities in conducting conversations and interacting with questions and inquiries in a linguistic manner similar to the nature of human reaction and you can use it in a variety of functions and inquiries including data visualization which is the focus of our topic for this day
First we need to install the OpenAI API as a first step to start using ChatGBT and then authenticate our credentials using JavaScript and entering the following code:
Once this process is complete, we can use ChatGpt to create visualizations in Tableau
Why is ChatGPT integration important to Tableau functionality?
In short, the basic necessity of this integration process is that it allows answering the most difficult questions and inquiries in an easy way and in natural language, and through which we can Tableau visualize these answers
Also, through this integration process, we can create interactive dashboards that help users find solutions to their inquiries in a timely manner, and thus their ability to identify patterns in their data and outliers at high speed makes reaching sound decisions easier.
Now let’s learn how to integrate ChatGPT with Tableau
This is done by carrying out the following stages
Step 1: Connect Tableau to your data source
This is done by selecting the Connect button in the upper left corner of the Tableau interface and then selecting the data source
Step 2: Install and configure TabPy
TabPy is a Python package that allows us to use Python scripts in Tableau
First enter the following command
After completing the installation of TabPy, we proceed to configure it to work with Tableau, and this is done by running TabPy with the following command in the terminal
Step 3: Install and configure the ChatGPT API
The ChatGPT API is a REST interface
At this stage, we install and prepare the ChatGPT API, and to be able to interact with the ChatGPT pattern, we install the ChatGPT API, and this is done by entering the following command in the Terminal window
Then, we set up the authentication, and this is done by obtaining the API key through a subscription request in OpenAI, and then you go to set it up in Python by running the following command:
Advertisements
Create integration between ChatGPT and Tableau (Python)
After successfully completing the previous steps, it remains to create the ChatGPT integration with Tableau
This is done by following these steps:
Step 1: Choose a Python function that calls the CHatGPT API
ChatGPT’s function here is to return the response from the queries entered into it
This is what the following example shows
Step 2: Use TabPy to register a Python function
This means registering a Python function with TabPy to be used in Tableau by running the following command in the Terminal window
This will create a TabPy configuration file, open it and add the following lines:
Save the file, and to start TabPy run the following command:
Step 3: Use the Python function in Tableau
To do this, we open a new workbook in Tableau and do the following:
1. We drag the “Text” object into the control panel
2. Click on the text and choose “Edit text” and in the dialog box type the following formula:
3. Then click OK and the text edit box will close
4. Drag the Parameter object onto the Control Panel
5. In the “Create Parameter” dialog box, set the data type to “String” and choose “all” to the available values, and set the current value to “empty string”, then click OK.
6. On the Parameter object, right-click and select Show Parameter Control.
7. Type a query in “Input Text” and press Enter
8. It will display the reply from ChatGPT in a “text” object and then call ChatGPT and Tableau together
Merger may seem a tiring process at first, but doing it repeatedly, even on a small scale, will develop your skills and develop capabilities to process data in a flexible and fast manner, and help you to troubleshoot problems and address them more effectively than before.
Create visualizations:
Using ChatGpt:
The first thing we need to do is provide ChatGpt with the data to be visualized, and after it receives the data that we have given it to it via a group or by passing a table, it will create the visualization according to the requests assigned to it
See in this code inserted in JavaScript how we create a visualization
In the above code we use OpenAI API functions to generate a bar chart of sales by location
We enter this request into ChatGpt via the immediate variable, to create the visualization we use the client.completions.create function and at the end we can display the resulting visualization in Tableau which was previously stored in the message variable
customize the resulting perceptions
We can customize the resulting visualizations according to our requirements in terms of changing the visualization type, size and color style, and this is done by providing ChatGpt with additional parameters
We can do this by using the following code in JavaScript
And keep in mind that experimenting with different parameters is a powerful tool for creating engaging and innovative visuals
What we did in the previous code is we created a quarterly earnings line chart using blue
Then we entered our request into ChatGpt through the immediate variable
Then we selected the appropriate visualization style, so we have a line chart in blue color and size according to demand
Show the visuals in Tableau
And as a reminder.. All of the above stages and procedures are to create a visualization using ChatGpt
But you promised us in this article that we will show the visualization in Tableau
Well don’t worry we’re not done yet..let’s go
The first thing we have to do is copy the resulting visualization from the message variable and paste it into Tableau and this is done by implementing the following steps
• Create a new worksheet in Tableau
• Select “Text” from the “Marks” section.
• Paste the visualization copied from the message variable into the text box and adjust the size of the text box to fit the visualization
• Congratulations.. The visualization has finally appeared in Tableau
And at the end of our interview today, allow me to pre-empt things and gladly answer some questions that some of the readers are likely to have.
Question 1: Are there free versions of ChatGPT?
Answer: Yes, there are free versions, but although their uses are limited, they often suffice
Question 2: Can we integrate ChatGPT with visualization tools other than Tableau?
Answer: Yes, and this is done by following the same steps that we followed above
Question 3: Does ChatGPT give accurate answers?
Answer: Not only accurate answers, but very accurate in general, when the information is entered correctly
In the end, I hope that you have found valuable information in this article as a data analyst looking for permanent and continuous development in his work. A successful person, my friend, as you know, is the person who accomplishes his work accurately and as quickly as possible.
If you find the benefit, please share with friends and support us, and quickly join wonderful partners by following the blog. We are honored to have you with us.. Welcome.
Advertisements
Tableauو ChatGpt تصور البيانات باستخدام
Advertisements
مع تطور أدوات وبرامج تحليل البيانات أصبح بمقدور مستخدمي التصورات البيانية
Tableau على برنامج
توفير الوقت والجهد عن طريق الاستفادة من
Tableau و ChatGpt التكامل بين
وبالتالي أتمتة المعالجة بمرونة أكثر
كيف يتم ذلك؟ هذا ما سنوضحه في مقالنا اليوم، هيا لنبدأ
ChatGPT كما ذكرنا ستتم العملية بالاستعانة بتطبيق
ما هو مفهوم هذا التطبيق؟
لن ندخل في تفاصيل تقنية معقدة تشرح آلية عمل هذا التطبيق فليس هذا موضوعنا اليوم وربما نخصص له شرحاً تفصيلياً في القادم من الأيام وإنما ما يهمنا شرحه الآن هو ما يخدم الموضوع الذي نتحدث فيه
Tableau وهو التكامل مع وظائف
هو روبوت محادثة يعتمد على الذكاء الاصطناعي ChatGPT
ويمتاز بقدراته المذهلة في إجراء المحادثات والتفاعل مع الأسئلة والاستفسارات بطريقة لغوية طبيعة تشبه رد فعل الإنسان ويمكنك الاستعانة به في مجموعة متنوعة من الوظائف والاستفسارات بما فيها تصور البيانات التي هي محور موضوعنا لهذا اليوم
OpenAI API نحتاج في البداية إلى تثبيت
ChatGBT كخطوة أولى للشروع في استخدام
ثم مصادقة بيانات الدخول الخاصة بنا
JavaScript ويتم ذلك باستخدام
: وإدخال الكود التالي
وعند إتمام هذه العملية أصبح بمقدورنا
Tableau لإنشاء تصورات في ChatGpt استخدام
؟Tableauمع وظائفChatGPTما أهمية تكامل
باختصار تمكن الضرورة الأساسية لعملية الدمج هذه بأنها تتيح الإجابة على أصعب الأسئلة والاستفسارات بطريقة سهلة وبلغة طبيعية
من تصور هذه الإجابات Tableau ومن خلالها يمكننا
كما ويمكننا من خلال عملية الدمج هذه إنشاء لوحات معلومات تفاعلية تساعد المستخدمين في إيجاد الحلول على استفساراتهم في زمن مناسب وبالتالي قدرتهم على تحديد أنماط بياناتهم والقيم المتطرفة بسرعة عالية تجعل الوصول إلى قرارات سليمة أمراً أكثر سهولة
TableauمعChatGPTلنتعرف الآن على كيفية الدمج
يتم ذلك بتنفيذ المراحل التالية
بمصدر بياناتكTableauالمرحلة الأولى: ربط
ويتم ذلك بتحديد الزر “اتصال” في الزاوية اليسرى العلوية
Tableau من واجهة
ثم تحديد مصدر البيانات
TabPy المرحلة الثانية: تثبيت وتجهيز
Python هي حزمة TabPy
Tableau النصية في Python تتيح لنا استخدام تعليمات
أولاً أدخل الأمر التالي
TabPy وبعد الانتهاء من تثبيت
Tableau نتجه إلى تهيئته للعمل مع
TabPy ويتم ذلك بتشغيل
terminal بواسطة الأمر التالي في
ChatGPT APIالمرحلة الثالثة: تثبيت وتجهيز
REST هي واجهة ChatGPT واجهة برمجة تطبيقات
نقوم في هذه المرحلة بتثبيت وتجهيز واجهة
ChatGPT برمجة تطبيقات
ChatGPT ولنتمكن من إحداث التفاعل مع نمط
ChatGPT API نقوم بتثبيت
ويتم ذلك عن طريق إدخال الأمر التالي
Terminal window في
ثم بعد ذلك نقوم إعداد المصادقة
API ويتم ذلك بالحصول على مفتاح
OpenAI من خلال طلب اشتراك في
Python لتنتقل بعدها إلى إعداده في
:بواسطة تشغيل الأمر التالي
Advertisements
( بايثون )Tableau و ChatGPT إنشاء التكامل بين
بعد إنجاز المراحل السابقة بنجاح
Tableau مع ChatGPT يبقى أمامنا إنشاء تكامل
:ويتم ذلك باتباع الخطوات التالية
:الخطوة الأولى
ChatGPT APIاختيار دالة بايثون التي تستدعي
هنا إعادة الاستجابة ChatGPT وظيفة
من الاستعلامات المدخلة إليها
وهذا ما يوضحه المثال التالي
TabPyالخطوة الثانية : استخدام
في تسجيل وظيفة بايثون
TabPy وهذا يعني تسجيل دالة بايثون مع
Tableau ليتم استعمالها في
Terminal window ويتم ذلك بتشغيل الأمر التالي في
TabPy وهنا سيتشكل ملف تكوين لـ
: افتحه وأضف الأسطر التالية
TabPy قم بحفظ الملف، ولبدء
عليك تشغيل الأمر التالي
Tableauالخطوة الثالثة: استخدم دالة بايثون في
Tableau جديد في workbook وللقيام بذلك نفتح
ونقوم بالإجراءات التالية
إلى لوحة التحكم “Text” نسحب الكائن *
“Edit text” انقر فوق النص واختر *
وفي صندوق الحوار اكتب الصيغة التالية
ثم انقر فوق “موافق” فيُغلَق صندوق تحرير النص *
إلى لوحة التحكم “Parameter” اسحب الكائن *
“Create Parameter” في صندوق حوار *
“all” واختر “String” اضبط نوع البيانات على
على القيم المتاحة واضبط القيمة الحالية
ثم انقر الأمر موافق “empty string” على
انقر بالزر الأيمن للماوس “Parameter” على الكائن *
“Show Parameter Control” واختر
Enter واضغط “Input Text” اكتب استعلاماً في *
في كائن “نص” ChatGPT سيعرض الرد من *
معاً Tableauو ChatGPT ثم يتم استدعاء
قد يبدو الدمج عملية متعبة في البداية ولكن تنفيذها بشكل متكرر ولو على نطاق ضيق سينمي عندك المهارات ويطور القدرات على معالجة البيانات بشكل مرن وسريع ويساعدك على استكشاف المشكلات ومعالجتها بفاعليها أكبر من ذي قبل
:إنشـــــــــــاء التصورات
:ChatGpt باستخدام
ChatGpt أول ما نحتاج إليه هو تزويد
بالبيانات المراد تصورها، وبعد تلقيه البيانات التي لقناه إياها عن طريق مجموعة أو عن طريق تمرير جدول سيقوم بإنشاء التصور وفق الطلبات الموكلة إليه
JavaScript شاهد في هذا الكود المدخل في
كيف نقوم بإنشاء تصور
OpenAI API في الكود السابق نستعين بوظائف
لتوليد مخطط شريطي للمبيعات حسب الموقع
ChatGpt نُدخِل هذا الطلب في
عبر المتغير الفوري، ولإنشاء التصور
client.completions.create نستخدم وظيفة
Tableau وفي النهاية يمكننا عرض التصور الناتج في
والذي كان قد خزن مسبقاً في متغير الرسالة
تغيير خصائص التصورات الناتجة
يمكننا تخصيص التصورات الناتجة وفق متطلباتنا من حيث تغيير نوع التصور وحجمه ونمط الألوان
إضافية parameters بـ ChatGpt ويتم ذلك عن طريق تزويد
JavaScript ويمكننا تنفيذ ذلك عن طريق استخدام الكود التالي في
مختلفة parameters وتذكر دائماً أن تجريب
يعتبر أداة قوية لتحصل على بيانات مرئية جذابة ومبتكرة
ما فعلناه في الكود السابق هو أننا قمنا بإنشاء مخطط خطي للأرباح بمقدار ربع سنة باستخدام اللون الأزرق
من خلال المتغير الفوري ChatGpt ثم أدخلنا طلبنا في
ثم حددنا نمط التصور المناسب فنتج لدينا مخطط خطي بلون أزرق وبحجم وفق الطلب
Tableauإظهار المرئيات في
وللتذكير.. كل ما سبق من مراحل وإجراءات
ChatGpt هي إنشاء تصور باستخدام
أول ما علينا فعله هو نسخ التصور الناتج من متغير الرسالة
ويتم ذلك بتنفيذ المراحل التالية Tableau ولصقه في
Tableau أنشئ ورقة عمل جديدة في *
“Marks” من جزء “Text” اختر *
الصق التصور المنسوخ من متغير الرسالة في مربع النص واضبط حجم مربع النص ليناسب التصور *
Tableau تهانينا .. لقد ظهر التصور أخيراً في *
وفي نهاية مالقتنا اليوم اسمحوا لي أن استبق الأمور وأجيب بكل سرور عن بعض الأسئلة التي على الأرجح قد تتبادر إلى أذهان بعض القراء
؟ChatGPTالسؤال الأول: هل يوجد نسخ مجانية من
الجواب: نعم يوجد إصدارات مجانية ولكنها ورغم أن استخداماتها محدودة ولكنها غالباً ما تفي بالغرض
ChatGPT السؤال الثاني: هل نستطيع دمج
؟Tableau مع أدوات تصور أخرى غير
الجواب: نعم ويتم ذلك باتباع نفس الخطوات التي اتبعناها آنفاً
أجوبة دقيقة؟ ChatGPT السؤال الثالث: هل يعطي
الجواب: ليست أجوبة دقة فحسب، بل بمنتهى الدقة بشكل عام وذلك عند إدخال المعلومات بشكل صحيح
وفي النهاية آمل أن تكون قد وجدت في هذا المقال معلومات قيمة كمحلل بيانات يبحث عن التطور الدائم والمستمر في عمله فالشخص الناجح يا صديقي كما تعلم هو الشخص الذي ينجز عمله بدقة وبأسرع وقت ممكن
فإن وجدت الفائدة أرجو أن تقوم بالمشاركة بين الأصدقاء وتقديم الدعم لنا وسارع بالالتحاق بشركاء رائعين عن طريق متابعة المدونة فنحن نتشرف بوجودك معنا.. أهلاً بك
Data engineering in our current era enjoys a great deal of interest and unprecedented demand, as many believe that it will be the most important science in the near future and will occupy a prominent place within the family of all data sciences, and even beyond that, data engineering is considered the future of artificial intelligence.
This science derives its importance as it mainly represents the backbone of data, so to speak, and rather the data infrastructure on which data science in all its branches depends.
Therefore, due to the scarcity of data engineering projects, we put in your hands five projects that will help you build a strong business portfolio that raises your chances when applying for any job related to data science.
Before moving on to the list of projects, please share this information and follow the blog in support of us to continue providing everything that is useful, and we are pleased to see your opinions and experiences in the comments .. thanks
Let’s get to know the five projects:
1. Surfline Dashboard
What you will learn in this project You will collect data from Surfline API via pipeline and export CSV file to Amazon S3
The goal of this project is to have a nice dashboard showing the data and to that end it loads the latest file into S3 to eventually feed it into the Postgres data warehouse
The implementation of this project requires the creation, design, and management of a data pipeline that will extract data from Crinacle’s Headphone and InEarMonitor databases and finalize metabase dashboard data.
You will learn AWS S3, Redshift, RDS, data transformation tool dbt, streaming
The aim of this project is to provide users with real-time financial data through a solid foundation
You will deal with building and implementing a data architecture that will handle big data in real time and stream data pipelines based on FinnHub.io API which is WebSocket which is used for real time handling data.
You will learn, for example:
Apache Kafka, Spark, Cassandra, Kubernetes and Grafana
Through this project you will learn the main principles of Airflow and the skills of creating a data pipeline
In a big data environment, the concept of data pipeline is automatically associated with data engineering, and data engineering mastery is associated with mastery of data pipeline skills
5. Youtube data engineering project from start to finish
Frankly, this project carries a great benefit, so do not skimp on yourself by enriching your information and raising your scientific balance in data engineering, in addition to learning how to understand problems and address them, so you will implement a complete data engineering project, and the implementation will take you about three hours.
You will follow the trainer’s instructions step by step, highlighting the important points and necessary details
خمسة مشاريع مجانية لهندسة البيانات تبني بها محفظة أعمال عالية المستوى
Advertisements
تحظى هندسة البيانات في عصرنا الحالي بحيزٍ كبيرٍ من الاهتمام والإقبال غير المسبوق حيث أن الكثيرين يرون أنها من ستكون أهم العلوم في المستقبل القريب وستحتل مكانة مرموقة ضمن عائلة علوم البيانات كافة بل ويتعدى ذلك إلى اعتبار هندسة البيانات مستقبل الذكاء الاصطناعي
يستمد هذا العلم أهميته باعتبار أنه يمثِّل بشكل رئيسي عصب البيانات إن صح التعبير وبالأحرى البنية التحتية للبيانات التي تعتمد عليها علوم البيانات بكافة فروعها
لذا ونظراً لندرة توفر مشاريع هندسة البيانات، نضع بين أيديكم خمسة مشاريع تساعدك على بناء محفظة أعمال قوية ترفع من حظوظك عند التقدم لأي وظيفة تتعلق بعلوم البيانات
قبل الانتقال إلى قائمة المشاريع الرجاء مشاركة هذه المعلومات ومتابعة المدونة دعماً لنا للاستمرار بتقديم كل ما هو مفيد، كما ويسعدنا مشاهدة آراءكم وتجاربكم في التعليقات.. مع جزيل الشكر
:هيا بنا لنتعرف على المشاريع الخمسة
1. Surfline Dashboard
ما ستتعلمه في هذا المشروع بأنك ستقوم بتجميع البيانات
عبر خط الأنابيب Surfline API من
Amazon S3 إلى CSV وتصدير ملف
الهدف من هذا المشروع هو الحصول على لوحة معلومات رائعة تعرض البيانات وللوصول إلى هذه الغاية يتقوم بتحميل أحدث ملف في S3 ليتم في نهاية المطاف إدخاله في مستودع بيانات Postgres
الهدف من هذا المشروع هو إمداد المستخدمين ببيانات مالية في الوقت الفعلي من خلال قاعدة متينة سوف تتعامل مع بناء وتنفيذ بنية البيانات التي بدورها ستتعامل مع بيانات ضخمة في الوقت الفعلي كما وستقوم بتدفق خطوط أنابيب البيانات
WebSocket وهو FinnHub.io API استناداً على
والذي يستخدم لبيانات التعامل في الزمن الحقيقي
سوف تتعلم على سبيل المثال لا الحصر:
Apache Kafka, Spark, Cassandra, Kubernetes and Grafana
في بيئة البيانات الضخمة يرتبط مفهوم خط أنابيب البيانات تلقائياً بهندسة البيانات ويعتبر احتراف هندسة البيانات مقروناً بإتقان المهارات المتعلقة بالتعامل مع خط أنابيب البيانات
5. من البداية إلى النهايةYoutubeمشروع هندسة بيانات
بصراحة هذا المشروع يحمل فائدة كبيرة لذا لا تبخل على نفسك بإغناء معلوماتك ورفع رصيدك العلمي في هندسة البيانات إضافة إلى تعلمك كيفية فهم المشاكل ومعالجتها لذا فستقوم بتنفيذ مشروع هندسة بيانات كامل وسيستغرق معك التنفيذ حوالي ثلاث ساعات
ستتَّبِع تعليمات المدرب خطوة بخطوة مع الوقوف على النقاط الهامة والتفاصيل الضرورية
Simply change the way traditional data analysis and business intelligence development is handled by integrating ChatGPT into Power BI
It is also possible through this integration to obtain more effective reports related to making decisive and appropriate decisions
In order to get the desired benefit from using these features optimally, you must first develop your skills in Power BI, and this is done by integrating ChatGPT within your scope of work, and this is very simple, with a few clicks you can get results and find solutions more quickly and effectively
This is what we will explain in this article to get the required benefit from using this technology, which will also help you with DAX queries
Should we know why should we integrate ChatGPT into Bower BI?
The Power BI tool is one of the most important tools in data visualization and analysis, and this is what users of this tool feel in their dealings with data, but when dealing with large data sets, dealing with DAX queries becomes more difficult
But when ChatGPT is integrated into that system, it will become easier in terms of speed and accuracy in obtaining answers, and thus the pace of your work will increase and become more flexible, as ChatGPT contributes to the completion of many other tasks, such as finding glitches, working to restore them, calculating metrics, building complex calculations, and other tasks other
In going to how to integrate ChatGPT into Power BI we will call the API to interact with the ChatGPT API business functions and in conjunction with the use of the visual feature of Power BI
This is done by following these steps:
1. Subscribe to the OpenAI API key: You must first obtain an API key to access the ChatGPT API
5. Create a new custom visual project: using the Bower BI command line
6. Open Terminal or Command Prompt and run:
API call: In your new custom visual project, modify the src / visual.ts file to include the code necessary to make API calls to ChatGPT
To make HTTP requests you will need to use a library such as “axios” loaded by run
npm install axios
Then modify the src/visual.ts file by making the necessary imports as a ChatGPT API call
Call the API in the visual update function: by making modifications to the update task in the src/visual.ts file to call the ChatGPT API and show the results, eg using a text element to show the response from ChatGPT
Importing custom visuals after compiling them: You have to package the visuals by running the pbiviz package in the terminal, right after completing the code, and this will create a .pbiviz file in the dist folder.
Going to Power BI, import the custom visualizations by selecting the ellipsis (…) in “Visualizations” section and click on the option (Import from file) and select the generated file which is .pbiviz
Add visuals to a Power BI report by selecting it from the “Visualizations” section
Advertisements
In the following example, we demonstrate how to query DAX by casting it to ChatGPT:
Now take a look at the DAX expression code from which you get the same result:
With Power BI integration, you’ll get instant answers that help speed up your workflow
This is what we will explain with examples of DAX queries that can be asked on ChatGPT:
Moreover, if you are caught by an error message, ChatGPT handles and fixes the bugs in the DAX expressions, and as we mentioned at the beginning of the article, one of the valuable tasks that ChatGPT helps you do is find and fix the bugs in the DAX expressions
ChatGPT helps save a lot of time and effort in dealing with huge data sets because you can use AI Chatbot visuals when creating complex DAX expressions instead of manually writing each calculation
My professional friends, this benefit is dedicated to you.. You deserve it
Now we’ll go over a very important topic of how to integrate ChatGPT with Power BI using Python
This is done by implementing the following steps:
Enable Python in Power BI Desktop
This is done by following these steps:
1. Install Python on your computer. If you do not have a copy of Python on your computer, you can get it from the official website: https://www.python.org/downloads/
2. Then you have to install the Python Compatibility feature in Power BI Desktop
3. Go to Power BI Desktop and follow the following path:
File -> Options and settings -> Options -> Python scripting
Then choose check for “Python scripting” box then choose “OK”
With this, you have achieved compatibility for Python scripting in Power BI Desktop
4. After completing the previous step, you will have to set the Python path in Power BI Desktop
5. Perform the following steps:
File -> Options and settings -> Options -> Python scripting
Click “Detect” to automatically detect the Python installation path instead of choosing it manually
6. After executing the previous step, restart Power BI Desktop for the new changes to take effect
Now you have to install the following Python libraries:
Openai is the library that provides access to the ChatGPT model
Pandas is the library that creates and manipulates dataframes
Pyodbc is the library that secures the connection to a Power BI data source
You can install these libraries using pip by running the following command in terminal:
We are now at the stage of validating and setting up the OpenAI API
• Create an OpenAI account and own an API key
• Install the OpenAI Python library
• Set OPENAI_API_KEY to your API key
• By running the following Python code, you can authenticate and configure the OpenAI API
Define a task that queries the ChatGPT model and returns the response:
The query_chatgpt function takes a directive as input, sends it to the ChatGPT form, and then returns the response
Connect to a Power BI data source using pyodbc:
• Write a Power Query function that calls the query_chatgpt function, which returns the response in tabular form
• Deploy your Python script as a data farm in Power BI
• Go to Power BI Desktop and select the “Home” tab
• Click on ‘Transform Data’ and choose:
New Source -> Python Script
Go to Python script and click OK then Close & Apply
Use the ChatGPT data source in your own Power BI report
• Go to the Report tab
• Click on Get Data, then More
• Select the data source “Python Script” and click Connect
• Enter the subject to be sent to the ChatGPT form
• Finally, the response will appear as a table in the Power BI report Finally, be sure to enter the actual values for your environment rather than the elements in the code
Advertisements
ChatGPT + Power BIالذكاء الاصطناعي باستخدام
Advertisements
بكل بساطة يمكن تغير طريقة التعامل مع تحليل البيانات وتطوير أسلوب ذكاء الأعمال التقليديَّين وذلك بواسطة
Power BIفي ChatGPT دمج لغة
كما ويمكن من خلال ذلك الدمج الحصول على تقارير أكثر فاعلية تتعلق باتخاذ القرارات الحاسمة والمناسبة
ولتحصيل الفائدة المرجوة من استخدام هذه الميزات على الوجه الأمثل لابد في البداية
Power BI من تطوير مهاراتك في
ضمن نطاق عملك ChatGPT ويتم ذلك بدمج
ويتعبر ذلك أمراً بسيطاً للغاية فبعدة نقرات تستطيع تحصيل النتائج والعثور على الحلول بسرعة وفاعلية أكبر وهذا ما سنشرحه في مقالتنا هذه لتحصل على الفائدة المطلوبة من استخدام هذه التقنية والتي أيضاً
DAX ستساعدك في استعلامات
يجب أن نعرف لماذا يجب علينا
Bower BI في ChatGPT دمج
Power BI تعتبر أداة
من أهم الأدوات في تصور البيانات وتحليلها وهذا ما يلمسه مستخدمو هذه الأداة في تعاملاتهم مع البيانات، ولكن عند التعامل مع مجموعات البيانات الضخمة يصبح التعامل
أكثر صعوبة DAX مع استعلامات
ChatGPT ولكن عند دمج
في تلك المنظومة سيصبح الأمر أكثر سهولة من حيث سرعة ودقة الحصول على الإجابات وبالتالي ترتفع وتيرة عملك وتصبح أكثر مرونة
ChatGPT حيث أن
يسهم بإنجاز مهام أخرى كثيرة ومتنوعة كالعثور على مواطن الخلل والعمل على ترميمها وحساب المقاييس وبناء العمليات الحسابية المعقدة وغيرها من المهام الأخرى
وفي الانتقال إلى
Power BI في ChatGPT كيفية دمج
سنقوم باستدعاء واجهة برمجة التطبيقات لإجراء التفاعل مع وظائف عمل
The Learning Basics program is based on an important axis, which is learning a programming language, which is the cornerstone of learning data science, and the Python language is the most appropriate option at the beginning. Here, I do not intend to neglect the importance of other programming languages, each of which has its own function and importance, so some may not agree with me in the opinion, it may be For them, the best option is SQL, and those who need to use data visualization may consider it necessary to learn the R language, but what everyone agrees on is that all programming languages and with their different functions often complement each other.
In general, at the beginning of the learning journey, I do not recommend that you distract your thoughts by learning more than one language, so that boredom or frustration does not creep into you at a time when you are most in need of focus and desire to learn.
2. Let those around you know that you are studying data science.
During your journey in learning data science, you are in dire need of support and encouragement. Informing those around you that you are studying data science may make many take the initiative to provide assistance and support, especially those who are willing to learn this type of science from your peers.
Knowing everyone about your studies may open up horizons of learning for you that contribute greatly to raising the level of your expertise and skills so that you have a high scientific balance that you would not have reached during your learning on your own.
Advertisements
3. Market yourself as a data scientist.
When you reach the level of a good data scientist, you will find employment opportunities open to you, so when you apply for a job in data science, you must clearly define your goal, and you should employ everything you have learned to show your skills and experience. The correct handling of problems and solutions that usually confront the data scientist during his career, present everything you have, present your projects and discuss them, impress them with your confidence in yourself, your information and your expertise, then you will be the focus of their attention and you will gain their admiration and increase your chances of success and acceptance
From my point of view, these were the most important factors that help build a data scientist who does not have a degree in data, and there is no doubt that you share my opinion that there are other factors that contribute to the refinement of expertise and skills. Let’s get to know some other factors that you see achieve this and discuss them together I wish you luck and success
Advertisements
كيف تصبح عالِم بيانات بدون شهادة بيانات
Advertisements
:استعِن بمصادر تعلم الأساسيات
يرتكز برنامج تعلم الأساسيات على محور مهم وهو تعلم لغة برمجة وهي حجر الأساس في تعلم علم البيانات وتعتبر لغة بايثون هي الخيار الأنسب في البداية وهنا، لا أتعمد إهمال أهمية لغات برمجة أخرى فلكل منها وظيفته وأهميته، لذا قد لا يتفق البعض معي في الرأي فقد يكون بالنسبة لهم
SQL الخيار الأفضل هو
وقد يرى الذين يحتاجون إلى استخدام تصور البيانات
R أنه من الضروري تعلم لغة
إلا أن ما يتفق عليه الجميع هو أن جميع لغات البرمجة ومع اختلاف وظائفها تكمل إحداها الأخرى في أغلب الأحيان
وعلى العموم وفي بداية رحلة التعلم لا أنصح بأن تشتت أفكارك بتعلم أكثر من لغة واحدة كي لا يتسلل الملل أو الإحباط إليك في الوقت الذي أحوج ما تكون إليه للتركيز والرغبة في التعلم
:دع من حولك يعرفون أنك تدرس علم البيانات
أثناء رحلتك في تعلم علم البيانات أنت بحاجة ماسة إلى الدعم والتشجيع فإعلام من حولك بأنك تقوم بدراسة علم البيانات ربما يجعل الكثيرين يبادرون إلى تقديم المساعدة والدعم وخصوصاً ممن يقدمون على تعلم هذا النوع من العلوم من أقرانك
معرفة الجميع بدراستك ربما يفتح أمامك آفاق من التعلم تسهم بشكل كبير برفع مستوى خبراتك ومهاراتك بحيث تمتلك رصيد علمي عالي لم تكن لتصل إليه خلال تعلمك بمفردك
Advertisements
:سوِّق لنفسك على أنك عالِم بيانات
عند وصولك إلى مستوى عالِم بيانات جيد ستجد فرص التوظيف مفتوحة أمامك لذا عند التقدم إلى وظيفة في علم البيانات عليك تحديد هدفك بوضوح كما وينبغي عليك أن توظف كل ما تعلمته في إظهار مهاراتك وخبراتك، فالقائمون على التوظيف يبحثون دائماً عمن يرون فيه الكفاءة العالية من القدرة على التعامل الصحيح في معالجة المشكلات والحلول التي عادة ما تعترض عالم البيانات خلال مسيرته المهنية، قدِّم كل ما لديك، اطرح مشاريعك وناقشها, أبهرهم بثقتك بنفسك وبمعلوماتك وخبراتك عندها ستكون محط أنظارهم وستنال إعجابهم وستزيد فرصك بالنجاح والقبول
كانت من وجهة نظري هذه أهم العوامل التي تساعد على بناء كيان عالِم بيانات غير حاصل على شهادة في البيانات ولا شك أنكم تشاركونني الرأي أن هناك عوامل أخرى تساهم في صقل الخبرات والمهارات، دعونا نتعرف على بعض العوامل الأخرى التي ترونها تحقق ذلك ولنناقشها سوية
According to statistics conducted by websites on the Internet, thousands of master’s degrees related to data science and artificial intelligence are offered all over the world, and we often see promotional advertisements used by universities about the importance of data science and the necessity of obtaining these certificates
In this article, we will try to highlight the things that must be taken into consideration before obtaining a master’s degree in data science
What is your goal of obtaining a master’s degree?
In other words, what advantages will you get with a master’s degree in data science?
The motives differ from one person to another regarding the pursuit of a master’s degree, but if we take a comprehensive look at the desire of the large group and the majority of students, we see that the goal is summed up in several points:
Discipline and responsibility: Often, a person’s self-learning journey is undisciplined and lacks coordination and organization, so the way you study to obtain a master’s degree will draw a specific and organized educational path for you, and thus it will give you a measure of organization and responsibility.
Effective rapid learning: Your desire to obtain a master’s degree will develop your motivation to learn and acquire more experiences and skills that you may not be able to obtain during your normal learning journey.
Functional competence: To be a data scientist with high efficiency and sufficient experience, then you have great opportunities to get a good job in data science if you were not employed before, but if you were employed, the prospects are open to you to get a job promotion that provides you with many capabilities that are commensurate with your level. Scientific and raise your status
Scientific curiosity: No matter how much experience and knowledge you have in artificial intelligence, you must be certain that there are topics and skills that you must discover, do not let your interests stop at a certain limit, you still have a lot to learn
In view of these motives, it may come to mind that it is imperative for every data scientist to seek to obtain this scientific degree, and this is wrong thinking in fact, or at least the subject is not in this way of inevitable necessity, but rather it is in the end an advanced scientific degree that undoubtedly qualifies its bearer Because he has preference in the field of data science, especially artificial intelligence, but this does not mean that someone who does not hold a master’s degree in data science is not qualified to be successful and expert, not necessarily, because every hardworking person has a share of success
Is a master’s degree enough to achieve your goals as a data scientist?
In order for us to be able to answer this question accurately, we must understand a very important matter. Whatever the level of your academic degrees and in any field, whether a master’s degree, a doctorate, or other scientific degrees, we cannot in any way neglect the factor of experience, without experience and personal skill in dealing with any A specific field, scientific degrees alone cannot make the holder reach advanced stages within his field and specialization, because experience is evidence of good dealing and behavior, especially in some difficult situations and problems that one encounters during his scientific and practical career. Some situations require prior experience in dealing with this type of problem that was not I have been included in the master’s degree studies, and these experiences are not acquired overnight, but are formed as a result of a group of experiences that varied between finding solutions, good behavior, and learning from mistakes and benefiting from them. It is known that he who does not make mistakes does not learn. Experience sometimes comes after a decisive decision or a bold step. The expert has a treasure in his hands that the holders of higher degrees may not possess sometimes, as he is able to seize the weakest opportunity and turn it into a strong and successful project.
With all of the above, we conclude that obtaining a master’s degree is a good thing and becomes a strength factor if it is supported by sufficient experience. These two elements, if available together, undoubtedly constitute a data scientist with a high level of competence and skill.
Does time help achieve goals enough?
The time factor is considered one of the main factors that contribute to achieving the desired goal. There is no doubt that studying in complete writing helps in obtaining the largest possible amount of information at an appropriate speed. It is directly related to data science as papers related to the social sciences of the Internet and the design of questionnaires, so a master’s degree student in data science is not restricted to an optimal investment of time, so what is consumed less time in regular studies in general does not lead you to a scientific degree that a master’s degree gives you
Advertisements
Is there an alternative to a master’s degree?
Through what we have reached in this research, we have a question that arises: Is it possible to say that someone who does not have a master’s degree is considered unqualified to be a capable and professional data scientist and does not have opportunities like those possessed by a master’s degree?
In fact, this statement is not absolute, despite the prevailing custom that holders of a master’s degree are preferred over those who do not hold a master’s degree, and holders of a doctorate are preferred over holders of master’s degrees, and so on.
Of course, obtaining more certificates requires more years of study, perhaps up to 7 years, and then comes the shocking fact that 3 years of experience, especially with regard to the file for applying for a job in artificial intelligence, may outperform all of the long years of study mentioned.
In order not to confuse matters with each other and make the reader feel a bit of hesitation in the information presented, it can be said that the holder of a PhD remains the focus of attention of potential employers, because, in my opinion, he would not have reached what he has reached if he did not have the necessary experience that would lead him to this scientific degree.
Does the financial return of the master’s degree holder compensate for what he spent on the learning journey?
There are many people who obtained a master’s degree who were shocked that the job salary did not meet their aspirations and therefore fell into the trap of the misconception that the money they spent when studying a master’s degree cannot be compensated through job ranks, even in the short term, at least
In this case, the solution is preventive, not curative, and this is done in a wise manner during the study process. Instead of random spending on full-time study, it is possible to study part-time while preserving the job and thus the salary, which is the first thing that falls within the scope of good management in spending. Scholarships that contribute significantly to covering a good portion of the tuition fees
Make sure to get a good source of information in learning:
The name of the university or educational unit, no matter how well-known, does not necessarily indicate that it is a good source of information, but what determines the quality of these educational centers is the extent to which students interact with the course and the results of graduates. All you have to do is search for opinions and official statistics on any course issued by any An educational unit that offers this type of studies, thus increasing your chances of finding a leading educational unit that will provide you with a sound and good study
Are these courses compatible with your scientific level?
As a continuation of the previous paragraph and in the midst of talking about the good selection of appropriate courses, it should be noted that it is necessary to know whether these courses are appropriate in their content and style to your scientific level, as the course may present topics for beginners that others who are more experienced see as very simple
And this is what actually happened when one of the major universities included the gathering of academic groups at the beginning of its training program, which it started with an intensive course in programming, which made this course for some a boring matter and a waste of time.
Do not forget, after making sure that you follow courses that suit your academic level, to investigate whether these courses provide graduates with job opportunities based on what was studied in the course. The job is online, full time or part time
Is studying data science the best option for you?
Being content with what one undertakes, whether it is study or work, is an important factor in the success of this project. No person can be creative in any field unless he is completely convinced of what he is doing.
There are many people for whom the option of studying a master’s degree is an opportunity to postpone decisions related to what he should do in their lives, but in fact, in this case, the subject of a valuable study like this turns into a great waste of time. Practical experience that expands your skills and knowledge in the field of data science and artificial intelligence
Data science is a multi-disciplinary science with many branches and ramifications, all of which are of value and open up wide horizons of knowledge and experiences for its students that reach its owner to what he aspires to and make his goals within sight and reaching them is only a matter of time.
In the end, dear reader: We hope that you have obtained the benefit and enjoyment in this article, and do not forget to share your opinion with us in the aforementioned, with our wishes for success and success for you.
Advertisements
النقاط التي يجب مراعاتها قبل التقدم إلى درجة ماجستير بعلم البيانات
Advertisements
وفق إحصائيات أجرتها مواقع على شبكة الإنترنت يتم تقديم آلاف درجات الماجستير المختصة بعلوم البيانات والذكاء الاصطناعي في جميع أنحاء العالم وكثيراً ما نشاهد الإعلانات الترويجية التي تستخدمها الجامعات حول أهمية علم البيانات وضرورة الحصول على هذه الشهادات
وسنحاول في هذا المقال تسليط الضوء على الأشياء التي يجب أخذها بعين الاعتبار قبل الحصول على درجة الماجستير في علم البيانات
ما هو هدفك من الحصول على درجة الماجستير؟
أو بمعنى آخر ماهي الميزات التي ستحصل عليها بحصولك على درجة الماجستير في علوم البيانات
تختلف الدوافع من شخص لآخر حول السعي لحصول على درجة الماجستير لكن إذا ألقينا نظرة شمولية على الرغبة لدى الفئة الكبيرة والغالبية من الطلاب نرى أن الغاية تتلخص في عدة نقاط
الانضباط والمسؤولية : فغالباً ما يكون الإنسان برحلة تعلمه الذاتية غير منضبط ويفتقد إلى التنسيق والتنظيم ، لذا فطريقة دراستك للحصول على درجة الماجستير سترسم أمامك مساراً تعليمياً محدداً ومنظماً وبالتالي ستمنحك قدراً من التنظيم والمسؤولية
التعلم السريع الفعال : رغبتك في الحصول على درجة الماجستير ستنمي عندك الدافع للتعلم واكتساب المزيد من الخبرات والمهارات التي قد لا تستطيع الحصول عليها أثناء رحلة تعلمك الاعتيادية
الكفاءة الوظيفية : أن تكون عالِم بيانات يتمتع بالكفاءة العالية والخبرة الكافية فأنت أمام فرص كبيرة للحصول على وظيفة جيدة في علم البيانات إن لم تكن موظف من قبل ، أما إن كنت موظفاً فالآفاق مفتوحة أمامك للحصول على ترقية وظيفية توفر لك العديد من الإمكانات التي تتناسب مع مستواك العلمي وترفع من مكانتك
الفضول العلمي : مهما كنت تمتلك من الخبرة والمعرفة في الذكاء الاصطناعي ، إلا أنه يجب أن تكون على يقين أن هناك مواضيع ومهارات عليك اكتشافها ، لا تدع اهتماماتك تقف عند حد معين، مازال أمامك الكثير لتتعلمه
وبالنظر إلى هذه الدوافع قد يتبادر إلى الأذهان أنه من الضرورة الحتمية لكل عالِم بيانات أن يسعى للحصول على هذه الدرجة العلمية، وهذا تفكير خاطئ في الحقيقة أو على الأقل ليس الموضوع بهذه الصورة من الضرورة الحتمية بل هو في النهاية درجة علمية متقدمة لا شك أنها تؤهل حاملها لأن يكون ذو أفضلية في مجال علم البيانات ولا سيما الذكاء الاصطناعي ، ولكن هذا لا يعني أن من لا يحمل درجة الماجستير في علم البيانات ليس مؤهلاً لأن يكون ناجحاً وخبيراً , لا ليس بالضرورة فلكل مجتهد نصيب من النجاح
هل يكفي نَيل درجة الماجستير في تحقيق أهدافك كعالِم بيانات ؟
لنستطيع الإجابة على هذا السؤال بشكل دقيق لابد أن نفهم أمراً مهماً جداً ، مهما بلغ مستوى شهاداتك العلمية وفي أي مجال سواء ماجستير أو دكتوراه أو غيرها من الدرجات العلمية ، فلا يمكن بأي شكل من الأشكال أن نهمل عامل الخبرة فبدون الخبرة والمهارة الشخصية في التعامل مع أي مجال معين لا يمكن للدرجات العلمية وحدها أن تجعل حاملها يصل إلى مراحل متقدمة ضمن مجاله واختصاصه لأن الخبرة دليل حسن التعامل والتصرف ولاسيما في بعض المواقف الصعبة والمشاكل التي تعترض المرء أثناء مسيرته العلمية والعملية فبعض المواقف تتطلب خبرة مسبقة في التعامل مع هذا النوع من المشاكل لم تكن قد أُدرجت في فصول دراسة درجة الماجستير وهذه الخبرات لا تُكتسب بين يوم وليلة وإنما تتشكل نتيجة مجوعة تجارب تنوعت بين إيجاد الحلول وحسن التصرف والتعلم من الأخطاء والاستفادة منها فمن المعروف أنه من لا يخطئ لا يتعلم، الخبرة تأتي أحياناً بعد قرار حاسم أو خطوة جريئة ، الإنسان الخبير يمتلك بين يديه كنزاً قد لا يمتلكه أصحاب الشهادات العليا أحياناً فهو قادر على انتهاز أضعف الفرصة وتحويلها إلى مشروع قوي وناجح
ومع كل ما سبق نستنتج أن الحصول على درجة ماجستير أمر جيد ويصبح عامل قوة إن كان مدعوماً بالخبرة الكافية فهذان العنصران إن توفرا معاً فهما دون شك يكوِّنان عالِم بيانات على مستوى عالي من الكفاءة والمهارة
هل يساعد الوقت في تحقيق الأهداف بشكل كافٍ ؟
يعتبر عامل الوقت من العوامل الأساسية التي تسهم في تحقيق الهدف المرجو ومما لا شك فيه أن الدراسة بدوان كامل تساعد في الحصول على أكبر قدر ممكن من المعلومات بسرعة مناسبة ولكن عند دراسة درجة الماجستير الأمر مختلف قليلاً إذ يتحتم على الدارس دراسة أوراق بحثية في عدة مواضيع لا علاقة لها مباشرة بعلوم البيانات كأوراق تتعلق بالعلوم الاجتماعية للإنترنت وتصميم الاستبيانات ، إذاً طالب درجة الماجستير في علم البيانات غير مقيد باستثمار أمثل للوقت ، فما يُستهلك من وقت أقل في الدراسات العادية على العموم لا يوصلك إلى درجة علمية تعطيك إياها درجة الماجستير
Advertisements
هل يوجد بديل لدرجة الماجستير؟
من خلال ما توصلنا إليه في هذا البحث أصبح لدينا سؤال يطرح نفسه : هل يمكن القول بأن مَن لا يملك درجة ماجستير يعتبر غير مؤهل لأن يكون عالِم بيانات قدير ومحترف ولا يملك فرص كتلك التي يمتلكها الحائز على درجة ماجستير ؟
في الحقيقة هذا الكلام غير مطلق رغم العرف السائد بأن حامل الماجستير يُفضَّل على من لا يحملها وحامل الدكتوراه مفضَّل على حامل الماجستير وهكذا
وبالطبع الحصول على مزيد من الشهادات يتطلب المزيد من سنوات الدراسة ربما تصل 7 سنوات ثم تأتي الحقيقة الصادمة بأن 3 سنوات من الخبرة وخاصة فيما يتعلق بملف التقدم لوظيفة في الذكاء الاصطناعي ربما تتفوق على كل ما ذكر من السنوات الطويلة في الدراسة
وكي لا تختلط الأمور ببعضها ويشعر القارئ بشيء من التذبذب في المعلومات المطروحة يمكن القول بأن حامل الدكتوراه يبقى محط أنظار أصحاب العمل المحتملين لأنه باعتقادي ما كان ليصل إلى ما وصل إليه لو أنه لم يكن يمتلك الخبرة اللازمة التي توصله إلى هذه الدرجة العلمية
هل يعوض العائد المادي لحامل درجة الماجستير ما أنفقه في رحلة التعلم ؟
هناك العديد من الأشخاص الذين حصول على درجة الماجستير صُدموا بأن الراتب الوظيفي لا يلبي تطلعاتهم وبالتالي وقعوا في فخ الاعتقاد الخاطئ بأن المال الذي أنفقوه عند دراسة درجة الماجستير لا يمكن تعويضه من خلال الرتب الوظيفي ولو على المدى القريب على أقل تقدير
في هذه الحالة يكون الحل وقائي لا علاجي، ويتم ذلك في التصرف الحكيم أثناء عملية الدراسة فبدلاً من الإنفاق العشوائي على الدراسة بدوام كامل يمكن الدراسة بدوام جزئي مع المحافظة على الوظيفة وبالتالي الراتب وهي أولى الأمور التي تدخل في حيز التدبير الجيد في الإنفاق ، كما وأن التقديم على منح دراسية تسهم بشكل كبير في تغطية جزء لا بأس به من المصروف الدراسي
:احرص على الحصول على مصدر معلومات جيد في التعلم
ليس بالضرورة أن يدل اسم الجامعة أو الوحدة التعليمية مهما كان مشهوراً على أنه مصدر معلومات جيد ، ولكن ما يحدد جودة هذه المراكز التعليمية هو مدى تفاعل الطلاب مع الدورة ونتائج الخريجين ، كل ما عليك فعله هو البحث عن الآراء والإحصاءات الرسمية عن أي دورة صادرة عن أي وحدة تعليمية تقدم هذا النوع من الدراسات وبهذا تزيد فرصك في العثور على وحدة تعليمية رائدة تؤمن لك دراسة سليمة وجيدة
هل تتماشى هذه الدورات مع مستواك العلمي ؟
استطراداً للفقرة السابقة وفي خضم الحديث عن حسن اختيار الدورات المناسبة يجب التنويه إلى ضرورة معرفة فيما إذا كانت هذه الدورات تناسب في محتواها وأسلوبها مستواك العلمي فلربما تطرح الدورة موضوعات للمبتدئين يراها آخرون ممن هم أكثر خبرة على أنها بسيطة جداً
وهذا ما حصل بالفعل عندما قامت إحدى الجامعات الكبرى بضم جمع الفئات الأكاديمية في مستهل برنامجها التدريبي الذي بدأته بدورة مكثفة في البرمجة مما جعل هذه الدورة بالنسبة للبعض أمراً مملاً وفيه مضيعة للوقت
لا تنسى بعد تأكدك من اتباع دورات تناسب مستواك العلمي أن تتحرى فيما إذا كانت هذه الدورات توفر للخريجين فرص عمل استناداً لما تم دراسته في الدورة ، يمكن اعتبار أنك وُفقت تماماً في اتباع الدورة الأمثل إذا حصلت على فرصة عمل مناسبة بعد التخرج ولا يهم إن كانت هذه الوظيفة أونلاين أو بدوام كامل أو جزئي
هل دراسة علم البيانات هي الخيار الأفضل بالنسبة لك ؟
القناعة فيما يُقدِم عليه المرء سواء كان دراسة أو عمل هي عامل مهم في نجاح هذا المشروع فلا يمكن لأي شخص أن يبدع في أي مجال مالم يكن مقتنع تماماً بما يقوم به
هناك الكثير من الأشخاص يكون خيار دراسة الماجستير بالنسبة لهم هو بمثابة فرصة لتأجيل قرارات تتعلق بما يجب عليه فعله في حياتهم ولكن في الحقيقة وفي هذه الحالة يتحول موضوع دراسة قيمة مثل هذه إلى إهدار كبير للوقت ، فالأجدر في مثل هذه الحالات أن يستهلك الوقت الضائع في اكتساب خبرة العملية التي توسع من مهاراتك ومعارفك في مجال علم البيانات والذكاء الاصطناعي
علم البيانات علم متعدد المجالات وفروعه كثيرة ومتشعبة وكلها ذات قيمة وتفتح أمام دارسيها آفاق واسعة من المعارف والخبرات التي تصل بصاحبها إلى ما يرنو إليه وتجعل أهدافه في مرمى نظره والوصول إليها مسألة وقت لا أكثر
في النهاية عزيزي القارئ : نرجو أن تكون قد حصلت على الفائدة والمتعة في هذه المقالة ولا تنسى أن تشاركنا رأيك في ذُكر آنفاً ، مع تمنياتنا لك بالتوفيق والنجاح
Machine learning is the science of the times, as the demand for its learning is increasing rapidly and significantly
In this article, we will shed light on the best way to learn machine learning skills so that the learner can invest them in the future in developing scientific research worldwide.
Therefore, we must first mention the concept of machine learning in a nutshell
Machine learning is a set of information that is fed into a computer in order to develop and grow over time by developing statistical models and algorithms on which computer systems operate without resorting to specific orders.
Machine learning map:
The first stage: learning the programming language
In this case, it is preferable to learn Python, as it is the most powerful and popular, due to the libraries it contains such as Pandas, Numpy, and Scikit, which are specialized in machine learning, statistics, and mathematics.
The second stage: learning linear algebra
Linear learning is one of the branches of mathematics, but it tends to deal with linear transformations and is also concerned with dealing with matrices and vectors.
Learning linear algebra is a crucial step forward in the journey of studying machine learning
The third stage: learning the basic libraries of Python
While there are other libraries for Python, these three libraries are considered the most efficient to serve their application to machine learning techniques.
Advertisements
The fourth stage: learning machine learning algorithms
This stage is no less important than the previous steps, and this is achieved by applying the previous steps to a variety of data sets
You can gain a lot of experience with algorithms by participating in Kaggle contests
Advertisements
خارطة طريق التعلم الآلي من الصفر حتى الاحتراف – 2024
Advertisements
يعتبر التعلم الآلي علم العصر إذ يزداد الإقبال على تعلمه بشكل متسارع وملحوظ
وفي هذا المقال سنسلط الضوء على الطريقة الأمثل لتعلم مهارات التعلم الآلي بحيث يتمكن المتعلم من استثمارها مستقبلاً في تطوير الأبحاث العلمية على مستوى العالم
لذا لابد في البداية من أن ننوه إلى مفهوم التعلم الآلي باختصار
التعلم الآلي هو مجموعة من المعلومات تُلقَّن إلى الكمبيوتر بغية تطويره ونموه مع مرور الزمن عن طريق تطوير النماذج الإحصائية والخوارزميات التي تعمل عليها أنظمة الحاسوب دون اللجوء إلى أوامر محددة
:خارطة التعلم الآلي
المرحلة الأولى : تعلم لغة البرمجة في هذه الحالة يفضل تعلم بايثون فهي الأقوى والأكثر شيوعاً نظراً لما تحويه من مكتبات
Pandas و Numpy و Scikit : مثل
وهي مختصة بالتعلم الآلي والإحصاء والرياضيات
المرحلة الثانية : تعلم الجبر الخطي
يعتبر التعلم الخطي أحد فروع علوم الرياضيات إلا أنه يتجه إلى التعامل مع التحولات الخطية ويهتم أيضاً بالتعامل مع المصفوفات والمتجهات
ويعتبر تعلم الجبر الخطي خطوة مفصلية للمضي قدماً في رحلة دراسة التعلم الآلي
وهذه المرحلة لا تقل أهمية عن الخطوات السابقة ويتحقق ذلك عن طريق تطبيق الخطوات السابقة على مجموعات متنوعة من البيانات ويمكنك اكتساب خبرة كبيرة بالتعامل مع الخوارزميات عن طريق
As an applicant for an interview in data science and related sciences, you may notice that the success rates seem low compared to the number of applicants. You may notice that the level of questions becomes more difficult in the advanced stages of the interview, especially when questions related to machine learning are asked. In fact, the questions may seem difficult at first. The first is often the failure to answer as a result of confusion, which usually leads to the failure of the applicant.
Anyone who can avoid falling into this trap can benefit from his previous stumbling blocks and turn them into strengths that will help him overcome this interview with ease because he has become fully aware of the level and method of asking difficult questions.
Of course, not all applicants will wait until they fail to become aware of the level of questions and answer them in another interview. Here we exclude a small group of applicants who are fully prepared for any kind of questions. For them, machine learning is a specialty and they deal with it professionally, making them able to face the questions that constitute For others, it is a bump that is difficult to overcome, so in this article, for example, we will address, for example, the five most difficult questions that are classified as difficult in interviews related to machine learning. Understanding these questions that form the basic concepts in machine learning will undoubtedly make the applicant in a position of strength when he is tested with them.
Question 1: What is the difference between XGBoost and Gradient Boosting?
The obvious answer to this question may seem to you that XGBoost is the most suitable application for dealing with Gradient Descent, and this answer is not wrong, but the questioner is trying to extract the skills of the applicant through an answer that indicates that the respondent is a professional data scientist
So the expected answer will be as follows:
XGBoost has a requirement to get the job done
XGBoost has a built-in technology for handling null values by a mechanism called sparsity awareness
Uses gradients that are based on similarity scores
It has a great role in speeding up the calculations
Parallelism to find (variable – threshold) groups on huge data sets using weighted quantitative sketch technique
Question 2: What are the best uses for regression evaluation scales?
the answer :
Evaluation criteria used in regression:
R2 is very common in detecting the presence of regression, as it explains by the percentage of variance in the function that is explained by the independent variables
MSE loss function
RMSE Root mean square variance
MAPE is the average percentage of absolute error, which is the most appropriate measure for the commercial activity, as its work is based on giving a percentage of error in the average prediction values
How do you use the most appropriate option for each of: MSE and RMSE?
Use the RMSE which is the same scale as the actual scale
Use MSE on the squared scale
Advertisements
Question 3: How can overfitting be controlled using cross-validation?
the answer :
It is important to know that cross-validation enables you to identify redundant composition without the possibility of controlling it
In order to be able to control it, we must do the following:
Selection and engineering of features
If the algorithm is linear, outliers must be processed
Parameter setting
Early stop
Organization
Try to get as much data as possible
Question 4: What are precision and recall?
Let’s say that out of 18 expected fraud incidents, 12 were classified as true, and in this context, 80% of all fraud incidents were found. Precision and recall
Answer: Let’s create the following matrix:
Precision = TP/(TP + FP) = 12/18 = 0.66
Recall = TP/(TP + FN) = 12/15 = 0.8
If your information is superficial on this subject, you will feel confused
On the contrary, if you are well versed, you will find that the answer is already in the question
Recall: What percentage of the actual 1s were correctly predicted = 80% = 0.8
Precision: How accurate were the predictions? Out of 18 predictions, 12 were correct, so 12/18 = 0.66.
It is noted here that TN is not a question and is not even required for both Recall and Precision
Question 5: What are the differences between Bagging and Boosting?
Bagging:
Creating a large number of decision trees that enable the final prediction to be obtained
Possibility to create decision trees on the dependent actual value
Possible poor results on random datasets
Boosting:
The dependence of the following tree on the prediction residuals on the last decision tree is the sequence of the beginners
Create trees on the tailings
Work well on random data set as it focuses on misclassified samples
Based on your knowledge of the previous points, you can choose between the two jobs
Advertisements
أصعب 5 أسئلة يمكن أن تطرح على المتقدم إلى مقابلة التعلم الآلي
Advertisements
قد تلاحظ كمتقدم لمقابلة في علوم البيانات وما يتفرع عنها من علوم أن معدلات النجاح تبدو منخفضة قياساً إلى عدد المتقدمين، قد تلاحظ أن مستوى الأسئلة يزداد صعوبة في مراحل متقدمة من المقابلة وخصوصاً عندما يتم طرح الأسئلة المتعلقة بالتعلم الآلي، في الحقيقة الأسئلة قد تبدو صعبة للوهلة الأولى وغالباً ما يكون التعثر في الإجابة نتيجة الارتباك الذي عادةً ما يؤدي إلى فشل المتقدم
يستطيع تجنب الوقوع في هذه المصيدة من يستفيد من عثرته السابقة ويحولها إلى نقاط قوة تعينه على تجاوز هذه المقابلة بسهولة ويسر لأنه بات على اطلاع تام على مستوى وأسلوب طرح الأسئلة الصعبة
بالطبع ليس كل المتقدمين سينتظرون إلى أن يفشلوا ليصبحوا على دراية بمستوى الأسئلة ويجيبوا عليها في مقابلة أخرى، نحن هنا نستثني فئة قليلة من المتقدمين المستعدين تماماً إلى أي نوع من الأسئلة، فالتعلم الآلي بالنسبة لهم هو اختصاص ويتعاملون معه باحترافية تجعلهم قادرين على مواجهة الأسئلة التي تشكل بالنسبة لغيرهم عثرة يصعب تجاوزها، لذا فسنتناول في مقالتنا هذه على سبيل المثال لا الحصر أكثر خمسة أسئلة تصنف على أنها صعبة في المقابلات المتعلقة بالتعلم الآلي، فهم هذه الأسئلة التي تشكل المفاهيم الأساسية في التعلم الآلي سيجعل بلا شك المتقدم في موضع قوة عندما يتم اختباره بها
:السؤال الأول
Gradient BoostingوXGBoost ما الفرق بين
قد تبدو لك الإجابة البديهية على هذا السؤال
هو التطبيق الأنسب XGBoost أن
Gradient Descent للتعامل مع
وهذه الإجابة ليست خاطئة ولكن السائل يحاول استخراج مهارات المتقدم من خلال إجابة تدل على أن المجيب عالِم بيانات محترف لذا فالإجابة المنتظرة ستكون على النحو الآتي
لديه شرط لإنجاز المهمة XGBoost
XGBoost يحتوي
على تقنية مدمجة للتعامل مع القيم الفارغة
sparsity awareness بواسطة آلية تسمى
يستخدم التدرجات التي تعتمد على درجات التشابه
لها دور كبير في تسريع العمليات الحسابية
التوازي للعثور على مجموعات ( متغيرة – عتبة ) على مجموعات البيانات الضخمة باستخدام تقنية الرسم الكمي الموزون
The Excel program is one of the programs that has features and characteristics that help the user to analyze data easily, and due to the multiple formulas and functions it provides that are capable of carrying out a set of operations, from which we will discuss in our article these functions of calculations, character and date text tasks, and a set of other research tasks
1. CONCATENATE
This formula is considered one of the most effective formulas in analyzing data, despite its ease and simplicity of working with it. Its task is to use dates, texts, numbers, and different data present in several cells and merge them into one cell.
SYNTAX = CONCATENATE (text1, text2, [text3], …)
Concatenate multiple cell values
The simple CONCATENATE formula for the values of two cells A2 and B2 is as follows:
= CONCATENATE (A2, B2)
The values will be combined without using any delimiter, and to separate the values with a space we use “ ”
=CONCATENATE(A3, “ “, B3)
Connect a string of texts and the computed value
You can also bind a string and a computed value to the formula as in the example of restoring the current date
=CONCATENATE(“Today is ”, TEXT(TODAY(), “dd-mmm-yy”))
You can verify that the results provided by the CONCATENATE function are correct by doing the following:
In all cases, the result of the CONCATENATE function is a text string, even if all the source values are numbers
Make sure there is a text argument in the CONCATENATE function to ensure that it works
You have to pay close attention to the validity of the text argument in order for the CONCATENATE function to work correctly, otherwise the formula will return the error #VALUE! This is because the arguments are not valid
2.Len()
This function is used to know the number of characters in one cell, or when dealing with text that contains a limited number of characters, or to know the difference between the numbers of a group of products
SYNTAX = LEN (text)
3.Days()
This function is used to calculate the number of days between two dates
SYNTAX = DAYS (end_date, start_date)
4.Networkdays
It is considered to be a function of date and time in Excel and is often used by finance and accounting departments to exclude the number of weekends to determine the wages of employees based on the calculation of actual working days for them or the calculation of the total number of working days for a specific project
It is one of the most common formulas in Excel and is considered one of the most important functions for data analysts =SUMIFS. =SUM, especially for conducting data collection under sample conditions
It is an important tool in data analysis and it is similar to SUMIFS. In most functions it counts the number of values that satisfy certain conditions but it doesn’t need a summation range
SYNTAX = COUNTIFS (range, criteria)
8.Count()
Its job is to determine whether a cell is empty or not by discovering gaps in the data set without you, as a data analyst, having to restructure it.
SYNTAX = COUNTA (value1, [value2], …)
9. Vlookup()
This shortcut stands for Vertically searching for a value in the leftmost column of the table so that you can return a value in the same row of the column you specify
We will explain the arguments to the VLOOKUP function
– lookup_value : is the value to look up in the first column of the table
table – : indicates the table from which the value is to be retrieved
-col_index: returns the column in the table from the value
range_lookup – :
Optional: TRUE = approximate match
Default: FALSE = exact match
The following table will explain the use of VLOOKUP
Cell A11 contains the lookup value
A2:E7 is the table array
3 is the column index with the information for the sections
0 is the search for the range
If you press the Enter key, it will return “Marketing”, which indicates that Stuart works in the marketing department
10. Lookup()
In it, “horizontal” is represented by the letter H, and it searches for one or more values in the top row of the table, then it retrieves a value from a row you specify in the table or row from the same column if this tool makes things easier, for example when the values you use are in the rows The first one from the spreadsheet and you need to look at a certain number of rows, this tool will do the trick
table — the table from which you need to retrieve data
ROW_INDEX which is the row number to restore the data
Range_lookup for exact and approximate matching, and that is determined by specifying the validity of the default value, so the match is approximate
In our next example, we’ll search for the city Jenson is from using Hlookup.
The search value shown in H23 is Jenson
G1: M5 is the table array
4 is the row index number
0 is for an approximate match
Pressing enter will take you back to New York.
at the end
We conclude from the above how effective Excel is in analyzing data. By learning its formulas and functions, you can make work easier for you and thus save a lot of time and effort.
Advertisements
عشرة وظائف لإكسل في تحليل البيانات
Advertisements
يعتبر برنامج إكسل من البرامج التي تتمتع بميزات وخصائص تعين المستخدم على تحليل البيانات بسهولة ونظراً لما يوفره من صيغ ووظائف متعددة قادرة على تنفيذ مجوعة عمليات سنتناول منها في مقالنا هذه وظائف العمليات الحسابية ومهام نصوص الأحرف والتاريخ ومجموعة أخرى من مهام البحث
CONCATENATE 1
تعتبر هذه الصيغة من الصيغ الأكثر فاعلية في تحليل البيانات رغم سهولتها وبساطة العمل بها وهي مهمتها استخدام التواريخ والنصوص والأرقام وبيانات مختلفة موجودة في عدة خلايا ودمجها في خلية واحدة
SYNTAX = CONCATENATE (text1, text2, [text3], …)
تسلسل قيم خلايا متعددة
CONCATENATE صيغة
A2 و B2 البسيطة لقيم خليتين
هي كما يلي
= CONCATENATE (A2، B2)
“ “سيتم دمج القيم بدون استخدام أي محدد ، ولفصم القيم بمسافة نستخدم
=CONCATENATE(A3, “ “, B3)
ربط سلسلة من النصوص والقيمة المحسوبة
كما ويمكنك ربط سلسلة نصية وقيمة محسوبة بالصيغة كما في المثال الموضح عن استعادة التاريخ الحالي
=CONCATENATE(“Today is “, TEXT(TODAY(), “dd-mmm-yy”))
ويمكنك التأكد من صحة النتائج التي تقدمها
CONCATENATE الدالة
من خلال اتباع ما يلي
في جميع الأحوال تكون نتيجة *
CONCATENATE الدالة
عبارة عن سلسلة نصية وإن كانت جميع قيم المصدر أرقاماً
احرص على وجود وسيطة نصية في *
CONCATENATE دالة
لضمان عملها
وعليك أن تنتبه جيداً من صحة الوسيطة النصية لكي تعمل *
CONCATENATE الدالة
بشكل صحيح وإلا فالصيغة
#VALUE! سترجع لك الخطأ
وهذا سببه أن الوسيطات غير صالحة
Len() 2.
تستخدم هذه الدالة لمعرفة عدد الأحرف في الخلية الواحدة ، أو عند التعامل مع نص يحوي عدد محدود من الأحرف أو معرفة الاختلاف بين أرقام مجموعة من المنتجات
SYNTAX = LEN (text)
Days() 3.
تستخدم هذه الدالة لحساب عدد الأيام الواقعة بين تاريخين
SYNTAX =DAYS (end_date, start_date)
Networkdays4.
وهي تعتبر أنها دالة التاريخ والوقت في إكسل وتستخدم غالباً من قبل أقسام المالية والمحاسبة لاستبعاد عدد عطلات نهاية الأسبوع لتحديد أجور الموظفين بناءً على حساب أيام العمل الفعلية لهم أو حساب عدد كامل أيام العمل لمشروع معين
هي القيمة التي عليك البحث عنها في العمود الأول من الجدول
table
يدل على الجدول التي يتم استرداد القيمة منه
col_index
يتيح استعادة العمود الموجود في الجدول من القيمة
range_lookup
اختياري : TRUE = approximate match
افتراضي : FALSE = exact match
VLOOKUP وسيوضح الجدول التالي استخدام
lookup تحوي قيمة A11 الخلية
هي صفوف الجدول A2: E7
رقم 3 هو فهرس العمود مع المعلومات الخاصة بالأقسام
رقم 0 هو البحث عن النطاق
Enter وفي حال الضغط على مفتاح
فسيعيد “التسويق” وهذه دلالة على أن
يعمل في قسم التسويق Stuart
10. Hlookup()
“وفيه يمثل “الأفقي
H بالحرف
وهو يبحث عن قيمة واحدة أو أكثر في الصف العلوي من الجدول، ثم يقوم باستعادة قيمة من صف تحدده في الجدول أو الصف من نفس العمود إذا تقوم هذه الأداة بتسهيل الأمور أكثر فمثلاً عند تكون القيم التي تستخدمها موجودة في الصفوف الأولى من جدول البيانات واحتجت إلى أن تتطلع على عدد صفوف معين فهذه الأداة تفي بالغرض
Did you know that you can create your own company online from nothing in a record time!
Yes, my friend, this is possible by artificial intelligence and using ChatgPT and free tools.
This depends on creating a website and developing a suitable strategy for work and I am not talking here about creating an electronic blog or store, but according to what we will explain in this article.
The basic idea of this project is based on providing something useful to people, and here you do not need to create content or write articles, but rather mainly on the real data.
So you have to think and search for the things that a large group of users is looking for and receives their interest and accordingly you can create a database that is based on your work within the framework of your work and your interests, such as if your field of work in digital marketing, for example, is here you need to form ideas on providing things related to With digital marketing and most of most workers in this field is to organize e -mail content during marketing campaigns, you can now provide assistance to them by building Boostctr.io
Advertisements
It is an easy -to -use location that contains tested topics with some information and how to build this position, starting with the beginning of you obtaining the symbol for the front and backgrounds and paste it into Visual Studio Code.
And the creation of the site is very simple, as you can use HTML, CSS and JavaScript for the frontend and use ASP.NET CORE API and the Lite DB database for the Backend,
you can simply add a link or copy of an advertisement or a server for your ads or sell advertisements
We come to the optimal investment stage of this site
The idea of the best investment lies by making people get to know the site and explore its content in order to attract more possible visitors and sell advertising spaces, as well as benefit from the sale of topics, content and e -mail marketing tools, and you can add a distinct membership through which the members can access the full database or Get more daily records.
Do you think this idea is more feasible than creating an electronic store, or does its simplicity make it a commercial activity on the Internet the lowest level of stores.
Share your opinion and indicate us with an idea that can be added as a valuable content of this type of site, we are waiting for your opinion on the comments.
Advertisements
!كيفية إنشاء شركة عبر الإنترنت بواسطة الذكاء الاصطناعي خلال 24 ساعة فقط
Advertisements
هل تعلم أنه أصبح بمقدورك إنشاء شركة خاصة بك عبر الإنترنت من لا شيء خلال زمن قياسي نعم صديقي هذا ممكن وذلك بواسطة الذكاء الاصطناعي
والأدوات المجانية chatgpt وباستخدام
يعتمد ذلك على إنشاء موقع إلكتروني ووضع استراتيجية مناسبة للعمل ولا أتحدث هنا عن إنشاء مدونة أو متجر إلكتروني بل وفق ما سنشرحه في هذا المقال
تقوم الفكرة الأساسية لهذا المشروع على تقديم شي مفيد للناس وهنا لست بحاجة إلى إنشاء محتوى أو كتابة مقالات بل بالاعتماد وبشكل أساسي على البيانات الحقيقية لذا عليك التفكير والبحث عن الأشياء التي يبحث عنها فئة كبيرة من المستخدمين وينال اهتمامهم وبناء عليها يمكنك تكوين قاعدة بيانات تستند عليها في عملك ضمن إطار عملك واهتماماتك ، كأن يكون مجال عملك في التسويق الرقمي على سبيل المثال ، فأنت هنا بحاجة لتكوين الأفكار حول تقديم أشياء تتعلق بالتسويق الرقمي وأكثر ما يُربك أغلب العاملين في هذا المجال هو تنظيم محتوى البريد الإلكتروني خلال الحملات التسويقية
BOOSTCTR.IO يمكنك الآن توفير المساعدة لهم ببناء
Advertisements
وهو موقع سهل الاستخدام يحوي مواضيع مُجربة مع بعض المعلومات وكيفية بناء هذا الموضع تعتمد بداية على حصولك على الرمز للواجهتين الأمامية والخلفية
Visual Studio Code ولصقه في
وإنشاء الموقع بسيط للغاية إذ يمكنك استخدام
للواجهة الأمامية HTML و CSS و JavaScript
ASP.NET Core API واستخدام
للواجهة الخلفية Lite DB وقاعدة بيانات
ومن ثم يمكنك ببساطة إضافة رابط أو صورة إعلان ما أو خادم لإعلاناتك أو بيع مساحات للإعلانات
نأتي إلى مرحلة الاستثمار الأمثل لهذ ا الموقع
تكمن فكرة الاستثمار الأفضل من خلال جعل الناس يتعرفون على الموقع واستكشاف محتواه بغية جذب أكبر ممكن من الزوار وبيع مساحات إعلانية وكذلك الاستفادة من عمليات بيع المواضيع والمحتوى وأدوات التسويق عبر البريد الإلكتروني، كما ويمكنك إضافة عضوية متميزة تمكن من خلالها الأعضاء الوصول إلى قاعدة البيانات الكاملة أو الحصول على المزيد من السجلات اليومية
هل تعتقد أن هذه الفكرة مجدية أكثر من إنشاء متجر إلكتروني أم أن بساطتها تجعلها نشاط تجاري عبر الإنترنت أقل مستوى من المتاجر شاركنا رأيك وأشِر علينا بفكرة يمكن أن تضاف كمحتوى قيّم لهذا النوع من المواقع ، ننتظرك رأيك في التعليقات
We will learn about the roadmap for those coming to data analysis for the year 2023, supported by links to tools, tutorials, and online courses.
The primary function of data analysts within any company is to fully study customer data in order to provide the best service to them and to conduct statistics that enable service providers to know the most appropriate behavior for the customer.
Data Analyst Roadmap for 2023
Learning programming is the first step to embarking on the data analysis journey, and knowledge of computer science, especially databases and SQL, also helps in this. In the midst of our conversation, we will mention the resources necessary to make you a data analyst.
This map is your guide to learning the skills of a successful data analyst for the year 2023. It includes the basic steps for the stages of learning in a simplified and understandable manner. If you see that there are other tools added to this map, we are pleased to interact with you and mention them in the comments. Your opinion is important to us.
Now we will discuss the important resources mentioned in this map:
1. Learn Python
There is no doubt that learning the Python language is the ideal start to the journey of learning data analysis. Learning the codes of this programming language is an essential pillar of data analysis jobs. There is complete compatibility between data analysis and visualization packages and the Python language, in addition to the existence of a wide environment of users of this language. It helps you find solutions to professional problems that you may encounter, and this also enhances the presence of a large number of online Python courses, and here we recommend specializing in Python from Coursera, through which you can use Python at an intermediate level within three months at most
Coursera offers a very useful educational course for beginners in the Python language, as it starts from the basics of Python, then it will take you to the web, interact with the database in this language
By learning the Python language, you have come a long and important way in learning data analysis, then we can move on to other things that must be learned after the Python language.
Advertisements
2. Data visualization and processing
It is very necessary for the data analyst to be fully aware of data visualization, as you need, by virtue of your work, to convert the raw data into charts to clarify it further
Therefore, you must learn visualization and data processing libraries, which we will talk about some of them with an explanation of the different tools and features between one library and another
Numpy Library
The working principle of this library depends on matrices and the implementation of arithmetic operations, and it is widely circulated among data analysts and it is recommended to learn it at the beginning
Pandas Library
Dedicated to importing and modifying data, you need to analyze and clean the data
Matplotlib library
This library is open source, so it is the most popular among data analysts, and thus you can find a large number of users that you can use to solve some problems that you may encounter, in addition to that it offers an infinite number of charts to work on
Seaborn Library
It differs from its predecessor in that it provides infinite layouts that can be customized to suit your requirements and are easy to learn
Tableau Library
Just import your data into this library then unleash your imagination and start customizing your visualizations because it offers you the use of data visualization without having to learn any programming language
3. Learn to count:
One of the indications of increasing employment opportunities for a data analyst is his possession of statistics skills, and the importance of learning statistics lies in dealing with a large number of data in a deep way, so you need to make predictions based on decisions that you have to make according to the results of counting this data
We recommend learning this course provided by the Coursera platform for beginners in statistics, which starts you from the basics related to sampling, distribution, probability, regression, etc.
Conclusion:
Have you noticed the simplicity of this roadmap that you can rely on to become an experienced data analyst? Of course, we cannot limit learning the programming language to the Python language, as you can learn other languages, the R language, but it is agreed that the Python language is very ideal for data analysis without neglecting the importance of the rest of the languages
We hope that we have achieved in this article the ideas that benefit data analysts, and do not forget to share with us in the comments the ideas that you see adding more value to this map .. We are waiting for you.
Advertisements
خارطة الطريق الخاصة بمحلل البيانات لعام 2024
Advertisements
سنتعرف على خارطة الطريق للمقبلين على تحليل البيانات للعام 2023 مدعومة بالروابط الخاصة بالأدوات والبرامج التعليمية وبالدورات التدريبية عبر الإنترنت
تكمن الوظيفة الأساسية لمحللي البيانات ضمن أي شركة في دراسة كاملة حول بيانات العملاء بغية توفير الخدمة الأمثل لهم وإجراء إحصائيات تمكن مقدمي الخدمة من معرفة السلوك الأنسب للعميل
خارطة طريق محلل البيانات لعام 2023
يعتبر تعلم البرمجة هو الخطوة الأولى للسير في رحلة تحليل البيانات ويساعد في ذلك أيضاً معرفة علوم الكمبيوتر
SQLوخاصة قواعد البيانات و
وسنأتي في خضم حديثنا على ذكر الموارد اللازمة لتجعل منك محلل بيانات
تعتبر هذه الخارطة دليلك لتعلم مهارات محلل البيانات الناجح لعام 2023 ، فهي تتضمن الخطوات الأساسية لمراحل التعلم بشكل مبسط ومفهوم ولك إن كنت ترى أن هناك أدوات أخرى تضاف إلى هذه الخارطة فيسعدنا تفاعلك معنا وذكرها في التعليقات فرأيك مهم بالنسبة لنا والآن سنتطرق إلى ذكر الموارد المهمة الواردة في هذه الخارطة
1. تعلّم لغة بايثون
مما لا شك فيه أن تعلم لغة بايثون هو البداية المثالية لرحلة تعلم تحليل البيانات فتعلم كودات لغة البرمجة هذه هو ركن أساسي من أركان وظائف تحليل البيانات ، فهناك توافق تام بين حزم تحليل البيانات والتصور وبين لغة بايثون ، علاوة على وجود بيئة واسعة من مستخدمي هذه اللغة تساعدك على إيجاد الحلول للمشاكل المهنية التي قد تعترضك وهذا أيضاً يعزز وجود عدد كبير من الدورات التعليمية للغة بايثون عبر الإنترنت وهنا ننصح بتخصص بايثون من كورسيرا التي من خلالها يمكنك أن تستخدم بايثون بمستوى متوسط خلال ثلاثة أشهر على الأكثر
تقدم كورسيرا دورة تعليمية مفيدة جداً للمبتدئين في لغة بايثون فهي تبدأ من أساسيات بايثون ثم ستنتقل بك إلى الويب التفاعل مع قاعدة البيانات بهذه اللغة
وبتعلمك للغة بايثون تكون قد قطعت شوطاً كبيراً ومهماً في تعلم تحليل البيانات، عندها يمكن أن ننتقل إلى الأمور الأخرى التي يجب تعلمها بعد لغة بايثون
Advertisements
2. التصور ومعالجة البيانات
من الضروري جداً لمحلل البيانات أن يكون على دراية تامة بتصور البيانات، فأنت بحاجة بحكم عملك أن تقوم بعملية تحويل البيانات الأولية إلى مخططات لإيضاحها بشكل أكبر
لذا لابد لك من تعلم مكتبات التصور ومعالجة البيانات والتي سنتناول الحديث عن بعضها مع توضيح اختلاف الأدوات والميزات بين مكتبة وأخرى
Numpy مكتبة
يعتمد مبدأ عمل هذه المكتبة على المصفوفات وتنفيذ العمليات الحسابية وهي متداولة بكثرة بين محللي البيانات وينصح بتعلمها في البداية
Pandas مكتبة
مخصصة لاستيراد البيانات والتعديل عليها فأنت بحاجة إلى تحليل البيانات وتنظيفها
Matplotlib مكتبة
تعتبر هذه المكتبة مفتوحة المصدر لذا فهي الأكثر شيوعاً بين محللي البيانات وبهذا يمكنك إيجاد عدد كبير من المستخدمين الذين يمكنك الاستعانة بهم لحل بعض المشاكل التي قد تعترضك فضلاً عن أنها تقدم عدد لا نهائي من المخططات للعمل عليها
Seaborn مكتبة
تختلف عن سابقتها بأنها توفر مخططات لا حصر لها يمكن بتخصيصها بما يتلاءم مع متطلباتك وهي سهلة التعلم
Tableau مكتبة
ما عليك إلا استيراد بياناتك إلى هذه المكتبة ثم أطلق العنان لمخيلتك وابدأ بتخصيص تصوراتك لأنها توفر لك استخدام تصور البيانات دون الحاجة إلى تعلم أي لغة برمجة
3. تعلَّم الإحصاء
من دلائل زيادة فرص التوظيف بالنسبة لمحلل البيانات هو امتلاكه لمهارات الإحصاء وتكمن أهمية تعلم الإحصاء في التعامل مع عدد كبير من البيانات وبشكل عميق، إذاً أنت بحاجة لإجراء التنبؤات استناداً إلى قرارات عليك اتخاذها وفق نتائج إحصاء هذه البيانات ننصح بتعلم هذه الدورة المقدمة من منصة كورسيرا للمبتدئين في الإحصاء التي تنطلق بك من الأساسيات المتعلقة بأخذ العينات وتوزيعها والاحتمال والانحدار.. إلخ
: الخلاصة
هل لاحظت بساطة هذه الخارطة التي يمكنك الاعتماد عليها لتصبح محلل بيانات متمرس ؟ طبعاً لا يمكننا أن نحصر تعلم لغة البرمجة بلغة بايثون
R فبإمكانك تعلم لغات أخرى كلغة
ولكن من المتفق عليه أن لغة بايثون مثالية جداً لتحليل البيانات دون إهمال أهمية باقي اللغات
تمنى أن نكون قد حققنا في هذه المقالة الأفكار التي تعود على محللي البيانات بالفائدة المرجوة ولا تنسى أن تشاركنا في التعليقات بالأفكار التي تراها تضيف إلى هذه الخريطة قيمة أكبر.. نحن بانتظارك
As a beginner in programming, you must fall into some errors that often result from any new start in a specific field. In fact, this is considered normal, and like other sciences that are the gateway to the world of modern technology, programming is considered one of the most important techniques that must be fully mastered and professionalized, and thus avoided. Making mistakes that novice programmers often make, which we will highlight in this article:
1) Haste and lack of concentration in writing the code:
It is not possible in any way to obtain a correct and accurate code that works on small and large applications if it had not been planned before with a lot of focus and accuracy. The stage of preparing the code must include important stages that must be studied on each one of them, which are in order: thinking, then research, then Planning, writing, verification, and modification if necessary.
Programming is not only just a code book, but also a technology that requires skill and creativity based on logic.
2) Not preparing an appropriate plan before commencing writing code:
As the absence of a general plan prepared for writing the appropriate codes is one of the most important factors of dispersion, so there must be no excessive planning in preparing the code, meaning that you do not need to exaggerate in preparing a model plan that consumes your time and effort, but rather it is sufficient to form a simplified idea through which you can start correctly and this It does not mean that you may not have to change the plan during work, but at least you have laid a correct foundation stone that you can rely on, whether to continue the work or amend it if necessary.
So, following this approach to planning makes it easier for you to act according to the requirements of the situation, such as adding or removing features that you did not think of in the first place, or fixing a defect somewhere, and this explicitly teaches you to be smooth and flexible in programming, ready to deal with any emergency circumstance.
3) neglecting code quality:
Coding quality is one of the most important pillars of writing correct code. Code is good when it is clear and readable. Otherwise, it turns into stale code.
Moreover, clarity of the code is the best way to properly form executable code and this is the primary task of the programmer
Any defect in the simplest things can prevent the code from working properly. For example, inconsistency with indentation and capitalization breaks the code from working, as shown in the example:
Also, long lines are usually difficult to read, so you should avoid exceeding 80 characters in each line of code.
In order to avoid making such errors, you can use the checking and formatting tools available in JavaScript, through which you can fix what can be fixed, so avoid yourself entering into mazes that are difficult for you to solve
The best option to maintain the quality of the codes for you is to know the most common errors and work to avoid them, including:
• Too many lines used in a file or function, breaking up long code into many smaller parts makes it easier for you to test each one separately
• Lack of clarity in naming short or specific variables
• Not describing the encoding of strings and raw numbers, and to avoid that, be sure to put the values indicating this encoding in a constant and give it an appropriate name
• Waste of time in dealing with simple problems that can be dealt with with a little skill and maneuvering in the use of appropriate abbreviations
• Neglecting appropriate alternatives that lead to ease of reading, such as exaggerated use in conditional logic
4) Haste to use the first solution:
This happens when the novice programmer searches for solutions that rid him of the problems he encounters, so he hastens to use the first solution he produces without taking into account the complications that will result that may hinder the correct programming and thus lead to failure, so the first solution is not necessarily the correct one.
Therefore, it is better to discover several solutions and choose the most appropriate one. Here, a very important point should be noted, which is that if you do not come up with several solutions to a problem, you are most likely unable to identify the problem accurately.
The evidence of the programmer’s skill lies in his choice of the simplest solution to address the problem, and not in his escape to the first solution he reaches in order to get rid of the problem immediately.
5) Sticking to the idea of the first solution:
Completely avoid sticking to the first solution, even if it requires more effort from you. When you feel doubt about the correctness of the solution, quickly get rid of the bad code and try to understand the problem and re-understand it more accurately, and always remember the skill is to get a simple solution that makes it easier for you to make appropriate decisions in dealing with the problem. You can also use source control tools such as GIT that provide many useful solutions
6) Rely on Google:
Beginner programmers often resort to solving some of the problems that they encounter while writing codes through the Google search engine. The problem that they faced may have faced many before them, so the solution is often present, and this actually saves some time in searching for a solution to the problem somewhat, and this is apparent, but have you thought This solution in the form of a line of code will continue with you as appropriate to your situation, be very careful not to use any line of code that is not clear to you and if you see it as the solution to your problem
7) Not using encapsulation:
Encapsulation is a system that works to protect variables in applications by hiding properties while maintaining the possibility of benefiting from them. This system is useful, for example, for making safe changes in the internal parts of functions without exposure to other parts. Neglecting the packaging process often leads to difficulty in maintaining systems
8) Wrong view of the future:
It is necessary for the programmer to have an insight and to study all the possibilities for each next step when writing code, and this is useful in testing advanced cases, but be careful not to let this view be your guide to implementing the expected needs by writing code that you do not need now, assuming that you can need it in the future Stay as consistent as possible with the style of coding you need in your day.
9) Use wrong data structure:
Determining the strengths and weaknesses of the data structures used in the programming language is evidence of the programmer’s skill and experience in this field. This point can be illustrated by some practical examples:
If we talk about the JavaScript language, we find that the array is the most used list, and the most used map structure is an object.
In order to manage the list of records, each record contains a specific identifier to search for, maps (objects) must be used instead of lists (arrays), and the use of numerical lists is the best option if the goal is to push values into the list
10) Turn your code into a mess:
In the event that there are codes that cause defects and irregularities in the code, they must be dealt with immediately and the resulting chaos removed, as in the following cases:
Duplicate code: This occurs when code is copied and pasted into a line of code, which leads to defects and irregularities resulting from code repetition.
Neglecting the use of the configuration file: If a certain value is used in different places in the code, this value belongs to the configuration file, to which any new value added to the code must belong anyway
Avoid unnecessary conditional statements (if): It is known that conditional statements are logic associated with at least two possibilities, and it is necessary to avoid unimportant conditions while maintaining readability, so what is meant here is that expanding the function with sub-logic follows a conditional statement (if) at the expense of Inclusion of another task causes unnecessary clutter and should be avoided as much as possible To clarify the issue of the conditional statement (if), consider this code:
Note that the problem is with the isOdd function, but have you noticed a more obvious problem?
The if statement is unnecessary, here is the equivalent code:
11) Include comments on understandable things:
It is necessary, even if it seems difficult at first, to avoid, as much as possible, including comments on understandable and obvious matters, as you can replace them with elements bearing names that are added to the code
For clarification, see the example with additional comments:
Notice the difference when writing the code without comments in this screenshot:
So, we noticed that listing names is more effective than including unimportant comments
However, this rule should not be generalized on the foundations of programming in general, but there are cases in which clarity is not complete without the inclusion of comments, in such cases you should structure your comments to know the reason for the existence of this code instead of a question and so on, even those who prefer to include comments We advise them to avoid mentioning the obvious matters, and to crystallize this idea more deeply, we note this example, which shows the presence of unnecessary comments:
Advertisements
12) Don’t include tests in your code:
Some programmers may think that they do not need to write tests in the code, and most likely they test their programs manually, and this may be out of their excessive confidence that they do not need to write tests in their code, but this cannot be considered negative at all because even if you want to know the mechanism Test automatically, you have to test it manually
If you pass an interaction test with one of your applications and want to perform the same interaction automatically next time, you must return to the code editor to add more instructions.
Here it should be noted that your memory may betray you in retrieving the test of successful checks after each change in the code, so assign this task to the computer and you only have to start guessing or creating your own checks even before writing the code. Development based on TDD testing, albeit not It is available to everyone but it positively influences your style which guides you to create the best design
13) Do you think that the task is going well?
Let’s see this image showing a function that implements the sumOddValues property. Does it have an error?
Have you noticed that the above code is incomplete, although it deals properly with certain cases, but it contains many problems, including:
First problem: Where does the null input handle?
There is an error that detects the function’s execution caused by calling it without arguments
There are two reasons why this erroneous code may occur:
• The details of your job implementation should not be shown to its users
• In the event that your job does not work with users and the error is caused by incorrect use, this will appear clearly, so you can program an exception thrown by the job, which the user refers to as follows:
Better yet, you can avoid the error issue by programming your function to ignore null inputs
The second problem: wrong entries are not handled
See what the function will throw if the function is fetched with an object, string, or integer value:
Although array.reduce is a function
Anything that calls function (42) in our previous example is called an array inside a function because we named the function argument array so we noticed that the error says that 42.reduce is not a function
But maybe if the error appeared in the following form it would be more useful
It should be noted here that the aforementioned two problems are secondary errors that must be avoided intuitively, in addition to the existence of cases that require thinking and planning, as in the following example, which shows what will happen if we use negative values
The function here should have been called sumPositiveOddNumbers so that the previous line does not appear
The third problem: Not testing all the correct cases due to forgetting some exceptional cases.
The number (2) is included in the group even though it should not be in it
This problem appeared because reduce used only the first value in the collection as the initial value of the accumulator which is in our previous example number 2 so the solution here is that reduce accepts a second argument to be used as the initial value of the accumulator
This is where testing is necessary, although you may have discovered the problem when writing the code and including the tests with other operations
14) Exaggerated reassurance about the validity of current code
Some codes may seem useful to novice programmers, so they use them safely in their code, without knowing that sometimes they may be bad, but they were put because the developer was forced to put them in this way, causing problems for beginners, so it is necessary here to include a comment by developers targeting beginners to clarify There is a reason why this code is included in this way
Therefore, as a beginner, you should put any code that you want to use from another place into question until you understand what it is and why it exists in order to avoid making mistakes that you are indispensable for.
15) Extra care to use the ideal methods in programming
Although the ideal methods are called by this name, they do not always carry this meaning, and this happens when the novice programmer devotes most of his attention to following the ideal methods, or at least the methods that he deems ideal, ignoring some cases that require him to act differently to some of the basic rules in programming. Situations that will put you in front of a challenge that only your good behavior and skill that you will need to develop through dealing with these circumstances will save you.
16) The obsession with poor performance
To get rid of the obsession with fear of making mistakes during programming, always be careful from the beginning, with every line of code pay close attention and recall your information and skills that avoid you from making mistakes, but this concern to improve your performance before starting should not be exaggerated and good judgment before starting It is he who will help you to decide whether the situation is preparing to improve performance before starting, or that the improvement in some cases will be an unjustified waste of time and effort.
17) Not choosing user-friendly experiences
One of the characteristics of the successful programmer is that he always puts himself in the place of the user and looks at the application that he designed or developed from the user’s point of view. By adding them to your list of affiliate links, this helps a lot in getting better results
18) Disregard for users’ experience by developers
Each programmer has his own preferred method and tools in the programming process, some of them are good, some are less good, and some are bad, but in general, the tools used in programming can be called quality according to their locations. There are cases where the tools are good at a time when the same tools are bad in other places.
The novice programmer often prefers the widely circulated tools, regardless of their usefulness in his programming, as he is a novice programmer, but in order for this programmer to start moving to higher levels of experience, he must select tools based on their efficiency in addressing certain functions that require their use in the first place, so the programmer gains more openness And good behavior and gets rid of a problem that many suffer from, which is clinging to tools that they used to deal with in all cases.
19) Data problems caused by code errors
Data are the basic pillars that form the structure of programs, which are basically an interface for entering new information or deleting old ones from it. Therefore, the smallest error in the code will lead to an unexpected defect in the data, and this is what some novice programmers fall into if they sometimes use codes that they think have succeeded in Validation tests believe that a broken feature is not necessary The problem is exacerbated when the validation program continuously introduces data problems that were not understood from the beginning, causing it to accumulate until it reaches an irreversible level where it is impossible to restore the correct state. To avoid this problem, you can use Multiple layers of data validation, or at least the use of database-specific constraints, which we will now learn about when adding tables and columns to your database:
A NOT NULL constraint applied to a column means that null values are excluded from this column by specifying the field source as not empty in the database
A UNIQUE constraint applied to a column means that duplicate values are excluded within the entire table. This constraint is ideal for user tables related to entering data for a username or e-mail.
The CHECK constraint is a custom expression, and in order for data to be accepted, it must evaluate to true. This is ideal for a percentage column that contains integer values from zero to 100.
PRIMARY KEY constraint Each table in the database includes a key to identify its records, which means that the column values are not empty and also unique
The FOREIGN KEY constraint indicates that the column values must match the values recorded in another table column, which often represents a primary key.
One of the common problems experienced by beginners related to data integrity is the wrong handling of transactions. If a group of operations related to each other needs to change the data source itself, it must be wrapped in a transaction that allows it to be rolled back in the event of a defect or failure in one of these operations.
20) Create new programs wheel
In the world of programming, things change continuously and rapidly, and services and requirements are available in a way that exceeds the ability of the team to keep up with it as it should, and the wheel of programs is like these changing services, so you may not find what you need as a programmer in one of these wheels, so the invention of a new wheel seems inevitable, but in most cases if it exists If the standard wheel design meets your needs, it is best not to design a new wheel
There are many options for software wheels available online and you can try before you buy according to what you need and feature that enables you to see its internal design in addition to that it is free
21) The negative idea of code reviews
Beginner programmers often take a negative attitude towards code reviews, thinking that they are a criticism of them, but as a beginner programmer, if you adopt this attitude, you must completely change your view and invest in code reviews optimally, as it is your opportunity to learn and gain more experience. Every time you learn something new It will be of practical value to you in this field
On the contrary, if you look at the subject in a more comprehensive way, the code reviews may make mistakes and you correct yourself, and therefore you are facing an opportunity to teach and learn, and this in itself is a source of pride for you as a programmer, making your way towards professionalism.
22) Rule out the idea of using source control
One of the negatives that some novice programmers fall into is underestimating the strength of the source control system. Perhaps the reason is because they believe that source control is limited to presenting their changes to others and building on them, but the topic goes far beyond this idea. Commitment messages communicate your implementations as a novice programmer and use them to help supervisors to Your code needs to know how the code got to its current state
Another benefit of source control is the use of features such as scaling options, selective restore, store, reset, mod, and many other valuable tools for your encoding flow.
23) Minimize the use of the common country as much as possible
The common country is a source of problems and should be avoided as much as possible or at the very least reduce its use to the maximum extent, as the more global the scope, the worse the scope of this common condition, so new cases must be maintained in narrow ranges and it is necessary to ensure that they do not leak to the top
24) Not treating mistakes as useful
Many people hate seeing small red error messages while programming, but in fact, the appearance of errors indicates that you are getting more knowledgeable and getting to know more about the glitches that occur even with professional programmers, so you work to remedy them in the future.
25) Continuous and prolonged exhaustion
The novice programmer has an obsession that he must complete the work he is required to do, whatever the cost, and as soon as possible, and this is what drives him to work for long periods, forgetting that he needs rest. These long periods of sitting and thinking cause fatigue, and often the programmer, after long hours of work, reaches a stage where he has not He is no longer able to think even in front of the simplest things, so he stands helpless, so taking a break is necessary to restore mental activity and mental balance.
Advertisements
الأخطاء التي قد ترتكبها كمبرمج مبتدئ
Advertisements
كمبتدئ في البرمجة لابد وأن تقع في بعض الأخطاء التي تنتج غالباً عن أي انطلاقة جديدة في مجال معين و حقيقةً يعتبر هذا أمراً طبيعياً، وكغيرها من العلوم التي هي بوابة الدخول إلى عالَم التكنولوجيا الحديثة تعتبر البرمجة أحد أهم التقنيات التي يجب إتقانها واحترافها بشكل كامل وبالتالي تجنب الوقوع في الأخطاء التي غالباً ما يقع فيها المبرمجون المبتدئون والتي سنسلط الضوء عليها في مقالتنا هذه
1) التسرع وعدم التركز في كتابة الكود
لا يمكن بأي حالة من الأحوال الحصول على كود صحيح ودقيق يعمل على التطبيقات الصغيرة والكبيرة إن لم يكن قد خُطِّط له من قبل بكثير من التركيز والدقة فمرحلة إعداد الكود يجب أن تشمل مراحل هامة لابد من الوقوف على كل واحدة منها وهي بالترتيب: التفكير ثم البحث ثم التخطيط ثم الكتابة ثم التحقق ثم التعديل إذا اقتضى الأمر
فالبرمجة ليست فقط مجرد كتاب تعليمات برمجية فحسب ، بل هي أيضاً تقنية تتطلب المهارة والإبداع المستند إلى المنطق
2) عدم إعداد خطة مناسبة قبل الشروع في كتابة الكودات البرمجية
إذ أن غياب الخطة العامة المعدّة لكتابة الكودات المناسبة أحد أبرز عوامل التشتت لذا لابد من التخطيط غير المفرط في إعداد التعليمات البرمجية أي أنك لست بحاجة إلى المبالغة من إعداد خطة نموذجية تستهلك منك الوقت والجهد بل يكفي أن تكوّن فكرة مبسطة تستطيع من خلالها الانطلاق بشكل صحيح وهذا لا يعني أنك قد لا تضطر إلى تغيير الخطة أثناء العمل ولكنك على الأقل تكون قد وضعت حجر أساس صحيح يمكنك الاعتماد عليه سواء في تتمة العمل أو التعديل إن تطلب الأمر
إذاً اتباع هذا النهج في التخطيط يسهل عليك التصرف وفق مقتضيات الحال كإضافة أو إزالة ميزات لم تكن تخطر ببالك أساساً ، أو إصلاح خلل في مكان ما وهذا يعلمك صراحة أن تكون سلساً ومرناً في البرمجة مستعد للتعامل مع أي ظرف طارئ
3) إهمال جودة الكود
جودة الترميز هي أهم دعائم كتابة تعليمات برمجية صحيحة وتستمد الكودات صفة الجودة عندما تكون واضحة وقابلة للقراءة وإلا ستتحول إلى رموز لا معنى لها
علاوة على أن وضوح الكود هو الطريقة الأمثل لتكوين تعليمات برمجية قابلة للتنفيذ بشكل صحيح وهذه هي المهمة الأساسية للمبرمج
إن أي خلل في أبسط الأمور يمكن أن يعيق عمل الكودات البرمجية بشكل صحيح فعلى سبيل المثال عدم الاتساق مع المسافة البادئة والكتابة بالأحرف الكبيرة يعطل عمل التعليمات البرمجية كما هو موضح في المثال
كما وأن السطور الطويلة تكون عادة صعبة القراءة لذا عليك تجنب تجاوز 80 حرفاً في كل سطر من أسطر الكودات البرمجية
ولتفادي الوقوع في مثل هذه الأخطاء يمكنك الاستعانة باستخدام أدوات الفحص والتنسيق المتوفرة في جافا سكريبت فمن خلالها يمكنك إصلاح ما يمكن إصلاحه فتجنب نفسك الدخول في متاهات يصعب عليك حلها
ويبقى الخيار الأفضل للحفاظ على جودة الكودات بالنسبة لك هو معرفة الأخطاء الأكثر شيوعاً والعمل على تلافيها والتي نذكر منها
كثرة الأسطر المستخدمة في ملف أو دالة فتجزئة التعليمات البرمجية الطويلة إلى عدة أجزاء أصغر يسهل عليك اختبار كل منها على حدى
عدم الوضوح في تسمية المتغيرات القصيرة أو المحدَّدة بنوع معين
عدم وصف ترميز السلاسل والأرقام الأولية ، ولتجنب ذلك احرص على وضع القيم الدالة على هذا الترميز في ثابت واطلق عليها اسماً مناسباً
هدر الوقت في معالجة مشاكل بسيطة يمكن أن تعالج بقليل من الحنكة والمناورة في استخدام اختصارات مناسبة
إهمال البدائل المناسبة التي توصل إلى سهولة القراءة كالاستخدام المبالغ فيه في المنطق الشرطي
4) التسرع في استعمال الحل الأول:
وهذا يحدث عندما يبحث المبرمج المبتدئ عن الحلول التي تخلصه من المشاكل التي تعترضه فيسارع إلى استعمال أول حل ينتج معه دون الأخذ بعين الاعتبار ما سينتج عنه من تعقيدات ربما تعيق سير البرمجة بشكل صحيح وبالتالي توصل إلى الفشل , فليس بالضرورة أن يكون الحل الأول هو الأصح
لذا من الأفضل اكتشاف عدة حلول واختيار الأنسب منها ، ويجب هنا التنويه إلى نقطة مهمة جداً هي أن عدم التوصل إلى عدة حلول لمشكلة ما فأنت على الأغلب لم تستطع تحديد المشكلة بدقة
فدليل مهارة المبرمج يكمن في اختياره لأبسط حل في معالجة المشكلة وليس بهروبه إلى أول حل يصل إليه ليتخلص من المشكلة فوراً
5) التشبث بفكرة الحل الأول
تجنب تماماً التمسك بالحل الأول ولو تطلب منك ذلك المزيد من الجهد فعند شعورك بمجرد الشك في صحة الحل سارع فوراً إلى التخلص من الشيفرة السيئة وحاول استيعاب المشكلة وإعادة فهمها بدقة أكبر وتذكر دائماً المهارة هي الحصول على حل بسيط يسهل عليك اتخاذ القرارات المناسبة في معالجة المشكلة، كما ويمكنك الاستعانة بأدوات التحكم بالمصدر مثل GIT التي توفر العديد من الحلول المفيدة
6) الاعتماد على جوجل:
كثيراً ما يلجأ المبرمجون المبتدئون إلى حل بعض المشاكل التي تعترضهم أثناء كتابة الأكواد عن طريق محرك البحث جوجل فالمشكلة التي واجهتهم ربما واجهت الكثيرين قبلهم , فالحل إذاً موجود غالباً وهذا في الحقيقة يوفر بعض الوقت في البحث عن حل المشكلة نوعاً ما وهذا ظاهر الأمر ولكن هل فكرت أن هذا الحل الموجود على شكل سطر من التعليمات البرمجية سيستمر معك بما يتلاءم مع حالتك أنت، احرص تمام الحرص على عدم استخدام أي سطر من التعليمات البرمجية غير الواضح بالنسبة لك وإن كنت ترى فيه الحل لمشكلتك
7) عدم استخدام التغليف
والتغليف هي منظومة تعمل على حماية المتغيرات في التطبيقات عن طريق إخفاء خصائص مع الإبقاء على إمكانية الاستفادة منها وهذه المنظومة تفيد على سبيل المثال إجراء تغييرات آمنة في الأجزاء الداخلية للوظائف دون التعرض للأجزاء الأخرى وكثيراً ما يؤدي إهمال عملية التغليف إلى صعوبة صيانة الأنظمة
8) النظرة الخاطئة للمستقبل
من الضروري أن يتمتع المبرمج بنظرة ثاقبة وأن يدرس جميع الاحتمالات عن كل خطوة قادمة عند كتابة التعليمات البرمجية وهذا يفيد في اختبار الحالات المتقدمة، ولكن انتبه لا تجعل هذه النظرة هي دليلك لتنفيذ الاحتياجات المتوقعة بأن تكتب كود لا تحتاجه الآن بفرض أنك يمكن أن تحتاجه في المستقبل ابقَ قدر الإمكان محافظاً على نمط الترميز الذي تحتاجه في يومك
9) استخدام بنية بيانات خاطئة
يعتبر تحديد مواطن القوة والضعف في هياكل البيانات المستخدمة في لغة البرمجة دليل على مهارة المبرمج وخبرته في هذا المجال ويمكن توضيح هذه النقطة ببعض النماذج العملية
إذا تحدثنا عن لغة جافا سكريبت نجد أن المصفوفة هي القائمة الأكثر استخداماً وأن أكثر بنية الخريطة استخداماً هي كائن
ولإدارة قائمة السجلات يحتوي كل سجل منها على معرف خاص بالبحث عنه يجب استخدام الخرائط (الكائنات) بدلاً من استخدام القوائم (المصفوفات)، ويعتبر استخدام القائم العددية أفضل خيار إذا كان الهدف هو دفع القيم إلى القائمة
10) تحويل التعليمات البرمجية إلى فوضى
في حالة وجود كودات تسبب خلل وعدم انتظام في التعليمات البرمجية فيجب التعامل معها فوراً وإزالة الفوضى الناتجة كما في الحالات التالية
كود مكرر: ويحدث ذلك عند نسخ كود ولصقه في سطر برمجي مما يؤدي إلى حدوث خلل وعدم انتظام ناتجين عن تكرار الكود
إهمال استخدام ملف التكوين : في حال استخدام قيمة معينة في أماكن مختلفة في التعليمات البرمجية فإن هذه القيمة تنتمي إلى ملف التكوين الذي لابد من تكون أي قيمة جديدة مضافة إلى الشيفرة تنتمي له على أي حال
: (if) تجنب العبارات الشرطية غير الضرورية
من المعروف أن العبارات الشرطية هي منطق يرتبط باحتمالين على الأقل ومن الضروري تجنب الشروط غير المهمة مع الحفاظ على سهولة القراءة إذاً فالمراد هنا أن توسيع الدالة بمنطق فرعي
(if) يتبع عبارة شرطية
على حساب إدراج مهمة أخرى يسبب فوضى لا داعي لها ويجب تجنبها قدر الإمكان
(if) وللتوضيح بالنسبة لموضوع العبارة الشرطية
أمعن النظر في هذا الكود
isOdd لاحظ وجود المشكلة في الدالة
ولكن هل لاحظت مشكلة أكثر وضوحاً ؟
غير ضرورية if عبارة
: هنا رمز مكافئ
11) إدراج تعليقات على الأشياء المفهومة
من الضروري وإن بدا الأمر صعباً في البداية أن تتجنب قدر الإمكان إدراج تعليقات على الأمور المفهومة والواضحة إذ يمكنك استبدالها بعناصر تحمل أسماء تضاف إلى التعليمات البرمجيةوللتوضيح شاهد المثال الذي يحوي على تعليقات إضافية
: لاحظ الفرق عند كتابة الكود بدون تعليقات في هذه الصورة
إذاً لاحظنا أن إدراج أسماء هو أمر مجدي أكثر من إدراج التعليقات غير المهمة إلا أنه لا يجب تعميم هذه القاعدة على أسس البرمجة عموماً بل هناك حالات لا يكتمل فيها الوضوح إلا بإدراج تعليقات، ففي مثل هذه الحالات ينبغي عليك هيكلة تعليقاتك لمعرفة سبب وجود هذا الكود بدلاً من سؤال وما إلى ذلك من أمور، حتى أولئك الذين يفضلون إدراج تعليقات ننصحهم بتجنب التنويه عن الأمور الواضحة ولتتبلور هذه الفكرة بشكل أعمق نلاحظ هذا المثال الذي يوضح وجود تعليقات لا داعي لوجودها
Advertisements
12) عدم إدراج الاختبارات في التعليمات البرمجية
قد يعتقد بعض المبرمجين أنهم ليسوا بحاجة إلى كتابة اختبارات في التعليمات البرمجية وعلى الأرجح يقومون باختبار برامجهم يدوياً وقد يكون ذلك من باب ثقتهم الزائدة بأنهم ليسوا بحاجة إلى كتابة اختبارات في تعليماتهم البرمجية ولكن لا يمكن اعتبار هذا الكلام سلبي بالمطلق لأنه حتى إذا كنت تريد معرفة آلية الاختبار تلقائياً فيجب عليك اختباره يدوياً
وإذا نجحت في اختبار تفاعل مع أحد تطبيقاتك وتريد إجراء نفس التفاعل تلقائياً في المرة القادمة فيجب عليك الرجوع إلى محرر التعليمات البرمجية لإضافة المزيد من التعليمات وهنا تجدر الإشارة إلى أنك قد تخونك ذاكرتك في استرجاع اختبار عمليات التحقق الناجحة بعد كل تغيير في الرمز ، لذا أسند هذه المهمة إلى الكمبيوتر وما عليك إلا أن تبدأ بالتخمين أو إنشاء عمليات التحقق الخاصة بك ولو قبل كتابة الكود
TDD فالتطوير المعتمد على اختبار
وإن كان غير متاح للجميع إلا أنه يؤثر إيجابياً على أسلوبك الذي يرشدك إلى إنشاء أفضل تصميم
13) هل تعتقد أن المَهمة تسير على أكمل وجه؟
دعنا نشاهد هذه الصورة التي تُظهر
sumOddValues وظيفة تنفذ خاصية
هل تحتوي على خطأ ما؟
هل لاحظت أن الكود أعلاه غير مكتمل؟ على الرغم من أنه يتعامل بشكل سليم مع حالات معينة إلا أنه يحوي العديد من المشاكل سأذكر منها
المشكلة الأولى: أين معالجة الإدخال الفارغ ؟
هناك خطأ يكشف عن تنفيذ الوظيفة ناتج عن استدعائها بدون وسيطات
وهناك سببين لحدوث هذا الرمز الخاطئ
لا يجب أن تظهر تفاصيل تنفيذ وظيفتك لمستخدميها في حال لم تعمل وظيفتك مع المستخدمين وكان الخطأ ناجم عن استخدام غير صحيح فهذا سيظهر بوضوح لذا يمكنك أن تبرمج استثناءً تطرحه الوظيفة يشير إليه المستخدم كما يلي
والأفضل من ذلك أن تتفادى موضوع ظهور الخطأ بأن تبرمج وظيفتك على تجاهل المدخلات الفارغة
المشكلة الثانية: المدخلات الخاطئة لا يوجد معالجة لها
شاهد ما ستطرحه الوظيفة في حال تم جلب الدالة بقيمة كائن أو سلسلة أو عدد صحيح
هي دالّة array.reduce مع أن
إن أي شيء تستدعي به الوظيفة (42) في مثالنا السابق يسمى مصفوفة داخل دالة لأننا قمنا بتسمية مصفوفة وسيطة الوظيفة
لذا لاحظنا أن الخطأ يقول أن
42.reduce
ليس دالة
ولكن ربما لو كان الخطأ ظهر على الشكل التالي لكان أكثر جدوى
ويجب التنويه هنا إلى أن المشكلتين آنفتي الذكر هما من الأخطاء الثانوية التي يجب العمل على تلافيها بديهياً علاوة على وجود حالات تتطلب التفكير فيها والتخطيط لها كما في المثال التالي الذي يوضح ما سوف يحدث إذا استخدمنا قيم سالبة
كان يجب تسمية الدالة هنا
sumPositiveOddNumbers
لكي لا يظهر لنا الخط السابق
المشكلة الثالثة: عدم اختبار كل الحالات الصحيحة بسبب نسيان بعض الحالات الاستثنائية وما سنراه في الصورة التالية هو نموذج عن حالة سليمة وبسيطة لوظيفة لم يتم التعامل معها بشكل صحيح
تم إدراج الرقم (2) في المجموعة رغم أنه لا يجب وجوده فيها
reduce ظهرت هذه المشكلة لأن
استخدم فقط القيمة الأولى في المجموعة كقيمة أولية للمجمع والتي هي في مثالنا السابق رقم 2 لذا فالحل يكمن
reduce هنا في أن يقبل
وسيطة ثانية لاستخدامها كقيمة
accumulator أولية لـ
هنا تكمن ضرورة القيام باختبارات رغم أنك قد تكون قد اكتشفت المشكلة عند كتابة الكود وتضمين الاختبارات بعمليات أخرى
14) الاطمئنان المبالغ فيه لصحة التعليمات البرمجية الحالية
قد تبدو بعض الكودات مفيدة بالنسبة للمبرمجين المبتدئين فيستعملونها باطمئنان في التعليمات البرمجية الخاصة بهم، دون علمهم أنها أحياناً قد تكون سيئة ولكنها وضعت لأن المطور أجبر على وضعها بهذه الطريقة فتسبب مشاكل لدى المبتدئين ، لذا من الضروري هنا إدراج تعليق من قبل المطورين يستهدفون به المبتدئين يوضحون فيه سبب إدراج هذا الكود بهذه الطريقة
لذا يجدر بك كمبتدئ أن تضع أي كود تريد استخدامه من مكان آخر موضع الشك إلى أن تفهم ماهيته وسبب وجوده لتفادي الوقوع في أخطاء أنت بغنى عنها
15) الحرص الزائد على استخدام الطرق المثالية في البرمجة
على الرغم من تسمية الطرق المثالية بهذا الاسم إلا أنها لا تحمل دائماً هذا المعنى وهذا يحدث عندما ينصرف جل اهتمام المبرمج المبتدئ باتباع الطرق المثالية أو على الأقل الطرق التي يراها هو بنظره مثالية متجاهلاً بعض الحالات التي تتطلب منه تصرفاً مغايراً لبعض القواعد الأساسية في البرمجة ، هناك حالات ستضعك أمام تحدي لا ينجيك منه إلا حُسن تصرفك ومهارتك التي ستحتاج إلى تنميتها من خلال تعاملك مع هذه الظروف
16) وسواس سوء الأداء
للتخلص من وسواس الخوف من الوقوع في الأخطاء أثناء البرمجة احرص دائماً على توخي الحذر منذ البداية ، مع كل سطر برمجي انتبه جيداً واستدعي معلوماتك ومهاراتك التي تجنبك الوقوع في الخطأ ولكن هذا الحرص في تحسين أدائك قبل البدء لا يجب أن يكون مبالغاً فيه وحسن التقدير قبل البدء هو الذي سيعينك على اتخاذ القرار فيما إذا كان الوضع يستعدي تحسين الأداء قبل البدء أم أن التحسين في البعض الحالات سيكون مضيعة للوقت والجهد بدون مبرر
17) عدم اختيار تجارب تناسب المستخدمين
من سمات المبرمج الناجح أنه دائماً ما يقوم بوضع نفسه مكان المستخدم وينظر إلى التطبيق الذي صممه أو طوره من وجهة نظر المستخدم فعلى سبيل المثال إن كانت الميزة تتضمن الحصول على معلومات يقوم المستخدم بإدخالها فقم كمطور بإلحاقها بالنموذج الذي لديك وإن كانت لإضافة رابط مع صفحة أخرى فقم بإضافتها إلى قائمة الروابط المتفرعة لديك وهذا يساعد كثيراً في الحصول على نتائج أفضل
18) تجاهل تجربة المستخدمين من قبل المطورين
لكل مبرمج طريقته وأدواته المفضلة في عملية البرمجة ومنها الجيد ومنها الأقل جودة ومنها السيء ولكن بشكل عام يمكن أن تطلق صفة الجودة على الأدوات المستخدمة في البرمجة حسب مواضعها فهناك حالات تكون الأدوات جيدة في الوقت الذي تكون فيه نفس هذه الأدوات سيئة في أماكن أخرى
فغالباً ما يفضل المبرمج المبتدئ الأدوات المتداولة بكثرة بغض النظر عن فائدتها في البرمجة الخاصة به فهو مبرمج مبتدئ ولكن لكي يبدأ هذا المبرمج بالانتقال إلى مستويات أعلى من الخبرة لابد له أن ينتقي الأدوات بناء على كفاءتها في معالجة وظائف معينة تتطلب استخدامها أصلاً فيكتسب المبرمج مزيداً من الانفتاح وحسن التصرف ويتخلص من مشكلة يعاني منها الكثيرين وهي التشبث بأدوات اعتادوا أن يتعاملوا بها مع كافة الحالات
19) مشاكل البيانات الناتجة عن أخطاء التعليمات البرمجية
البيانات هي الأعمدة الأساسية التي تشكل هيكلية البرامج التي هي بالأساس واجهة لدخال معلومات الجديدة أو حذف القديمة منها لذا فإن أصغر خطأ في الكود سيؤدي إلى خلل غير متوقع في البيانات وهذا ما يقع فيه بعض المبرمجين المبتدئين إذا يقومن في بعض الأحيان باستخدام كودات يظنون أنها نجحت في اختبارات التحقق باعتقادهم أن أحد الميزات المعطَّلة لا ضرورة لها وتتفاقم المشكلة عندما يقوم برنامج التحقق بإدخال مشاكل البيانات التي لم تكن مفهومة منذ البداية وبشكل مستمر مما يؤدي إلى تراكمها حتى تصل إلى مستوى لا يمكن التراجع عنه بحيث يستحيل معه استعادة الوضع السليم ولتجنب هذه المشكلة يمكنك استخدام طبقات متعددة من عمليات التحقق من صحة البيانات أو على الأقل استخدام القيود الخاصة بقاعدة البيانات والتي سنتعرف عليها الآن وذلك عند إضافة جداول وأعمدة إلى قاعدة البيانات الخاصة بك
NOT NULL قيد *
المطبق على عمود يعني استبعاد القيم الفارغة من هذا العمود من خلال تحديد مصدر الحقل على أنه ليس فارغاً في قاعدة البيانات
UNIQUE قيد *
المطبق على العمود يعني استبعاد القيم المكررة داخل الجدول كاملاً وهذا القيد مثالي لجداول المستخدمين المتعلقة بإدخال بيانات لاسم مستخدم أو بريد إلكتروني
CHECK قيد *
وهو تعبير مخصص وليتم قبول البيانات فيه يجب تقييمه إلى صحيح وهذا مثالي لعمود النسب المئوية الذي يحوي القيم الصحيحة من صفر إلى 100
PRIMARY KEY قيد *
يضمن كل جدول في قاعدة البيانات مفتاح للتعريف بسجلاته وهو يعني أن قيم العمود ليست فارغة وفريدة أيضاً
FOREIGN KEY قيد *
وهو يدل على وجوب تطابق قيم العمود مع القيم المدونة في عمود جدول آخر والذي يمثل غالباً مفتاحاً أساسياً
ومن المشاكل الشائعة التي يعاني منها المبتدئون والمتعلقة بسلامة البيانات هي التعامل الخاطئ مع المعاملات ، فإذا احتاجت مجموعة من العمليات المرتبطة مع بعضها البعض إلى تغيير مصدر البيانات نفسه فيجب أن يتم تغليفها بمعاملة تتيح التراجع عنها في حال حدوث خلل أو فشل في إحدى هذه العمليات
20) ابتكار عجلة برامج جديدة
في عالم البرمجة تتغير الأشياء بشكل مستمر ومتسارع وتتوفر الخدمات والمتطلبات بشكل يفوق قدرة فريق مواكبته كما يجب وعجلة البرامج شأنها كشأن هذه الخدمات المتغيرة لذا فقد لا تجد كمبرمج ضالتك في إحدى هذه العجلات لذا فاختراع عجلة جديد يبدو أمراً لا مفر منه ولكن في أغلب الحالات إن وجدت أن التصميم النموذجي للعجلة يلبي احتياجك فمن الأفضل أن لا تقوم بتصميم عجلة جديدة
هناك العديد من الخيارات لعجلات البرامج المتاحة عبر الإنترنت ويمكنك التجريب قبل الشراء وفق ما تحتاجه وتتميز بأنها تمكنك من رؤية تصميمها الداخلي علاوة على أنها مجانية
21) الفكرة السلبية عن مراجعات الكود
غالباً ما يتخذ المبرمجون المبتدئون موقفاً سلبياً من مراجعات الكود ظناً منهم أنها تمثل انتقاداً لهم ولكن يجب عليك كمبرمج مبتدئ إن كنت تتبنى هذا الموقف أن تغير نظرتك تماماً وأن تستثمر مراجعات الكود بالشكل الأمثل فهي فرصتك للتعلم واكتساب مزيد من الخبرة ففي كل مرة تتعلم فيها شيئاً جديداً سيشكل بالنسبة لك قيمة عملية في هذا المجال
وعلى العكس إن نظرت إلى الموضوع نظرة أشمل فلربما تخطئ مراجعات الأكواد وتقوم أنت بالتصحيح وبالتالي فأنت أمام فرصة للتعليم والتعلم وهذا بحد ذاته مفخرة لك كمبرمج تشق طريقك نحو الاحتراف
22) استبعاد فكرة استخدام التحكم بالمصدر
من السلبيات التي يقع بها بعض المبرمجين المبتدئين هي التقليل من قوة نظام التحكم بالمصدر، ربما يعود السبب لاعتقادهم أن التحكم بالمصدر يقتصر على تقديم تغييراتهم للآخرين والبناء عليها ولكن الموضوع يتعدى هذه الفكرة بكثير فرسائل الالتزام تقوم بتوصيل عمليات التنفيذ الخاصة بك كمبرمج مبتدئ واستخدامها لتساعد المشرفين على الكود الخاص بك في معرفة كيفية وصول الكود إلى وضعه الراهن
كما وأن من أوجه الاستفادة من التحكم في المصدر استخدام ميزات مثل خيارات التدريج والترميم الانتقائي والتخزين وإعادة الضبط والتعديل والعديد من الأدوات الأخرى القيمة لتدفق الترميز الخاص بك
23) التقليل من استخدام البلد المشترك قدر الإمكان
يعتبر البلد المشترك مصدر مشاكل ويجب تجنبه قدر الإمكان أو على أقل تقدير تقليل استخدامه إلى أقصى حد إذ أن كلما كان النطاق عالمياً ازداد نطاق هذه الحالة المشتركة سوءاً لذا يجب المحافظة على الحالات الجديدة في نطاقات ضيقة ومن الضروري التأكد من أنها لا تتسرب إلى الأعلى
24) عدم التعامل مع الأخطاء على أنها مفيدة
يكره الكثيرون رؤية رسائل الخطأ الحمراء الصغيرة أثناء البرمجة لكن في الحقيقة ظهور الأخطاء يدل على أنك تزداد معرفة وتتعرف أكثر على مواطن الخلل التي تحدث حتى مع المبرمجين المحترفين فتعمل على تداركها في المستقبل فمن لا يخطئ لا يتعلم وظهور رسالة الخطأ ليس دليل الفشل
25) الإرهاق المستمر ولفترات طويلة
يبقى عند المبرمج المبتدئ هاجس أنه يجب عليه إنجاز العمل الذي عليه مهما كلف الأمر وبأسرع وقت ممكن وهذا ما يدفعه للعمل لفترات طويلة ناسياً أنه بحاجة إلى الراحة فهذه الفترات الطويلة من الجلوس والتفكير تسبب الإرهاق ، وكثير من الأحيان يصل المبرمج بعد ساعات عمل طويلة إلى مرحلة لم يعد فيها قادراً على التفكير حتى أمام أبسط الأمور يقف عاجزاً لذا فأخذ قسط من الراحة أمر ضروري لاستعادة النشاط العقلي والتوازن الذهني
With the scientific and technological progress, especially the rapid and remarkable development in data science and its analysis, it has become necessary for the data analyst to have sufficient experience to make him the focus of attention of companies that pursue data analysis in the course of their affairs, but this expertise does not come between day and night, but data scientists spend a long time and make a double effort They take advantage of the smallest opportunities to obtain information to reach the degree of data analyst or data engineer
Analysis is the process of finding the most appropriate way to solve problems and process data
So we must touch on some ways to improve your data analysis skills:
Evaluate your skills:
Some numbers and results may deceive you after you carry out a marketing campaign. You will think that the conversion rate is 50%, for example, but you will be shocked later that the number of potential customers is small, so this percentage does not mean that the goal was achieved at the required rate.
The process depends on changing the ratios of the numerator and denominator in the percentage according to what is commensurate with the reality of the situation. For example, when the goal is real, the numerator can be increased, and if it is not intended, the denominator can be reduced.
Measuring growth rate and expectations:
Rely on a graphic line that measures the growth rate and determines the validity of expectations. With the passage of time, increasing the steady growth rate becomes difficult, as determining a percentage value that embodies performance measurement can lose the actual value of the work.
The rule is 80/20
The basic principle of this rule depends on focusing on a large value that represents 80% of the results and dealing with it in a manner that secures the development of performance and control of its course with complete flexibility, and this rule can be relied upon as a start to reduce the budget spent for this project
Advertisements
Enter the MECE system into your accounts
It is a systematic system for addressing problems with the aim of reducing galactic calculations that consume a lot of time and effort
3 areas of MECE can be identified:
* Problem tree:
The benefit of this process lies in its fragmentation of thorny and complex problems, thus facilitating their solution more easily, and to simplify this concept more, it can be said that it depends on analyzing user behavior according to certain classifications (age, profession, gender…)
* decision tree:
It relies on refuting decisions and potential outcomes and detailing them in the form of a graphical chart that facilitates the identification of the relative negatives and positives of each decision, to estimate the commercial value of the new plans, and then prioritizes and arranges them.
* probability tree:
It differs from the problem tree in that it coordinates the hypotheses more deeply and gives direct results compared to the problem tree
Cohorts represent quality value:
Cohorts are the groups that share certain features with each other, such as the start date, for example. They act as accurate analyzes by monitoring their persistence in using your applications and websites.
Avoid making false statements:
This is done before starting any process to verify the quality of data sets by monitoring and coordinating the statistics related to the data to exclude outliers and dealing with sound data. You can confirm the final results by comparing the resulting values with a similar analysis.
Advertisements
مجموعة نصائح لتحسين مهاراتك في تحليل البيانات
Advertisements
مع التقدم العلمي والتكنولوجي ولاسيما التطور المتسارع والملحوظ في علم البيانات وتحليلاتها أصبح من الضروري أن يمتلك محلل البيانات خبرة كافية تجعله محط أنظار الشركات التي تنتهج تحليل البيانات في تسير أمورها، ولكن هذه الخبرة لا تأتي بين يوم وليلة بل يمضي علماء البيانات أوقاتاً طويلة ويبذلون مجهوداً مضاعفاً ويستغلون أصغر الفرص للحصول على المعلومة للوصول إلى درجة محلل البيانات أو مهندس بيانات
فالتحليل هو عملية العثور على الطريقة الأنسب لحل المشكلات ومعالجة البيانات
لذا لابد من أن نتطرق إلى بعض الطرق التي تحسن مهاراتك في تحليل البيانات
:قيّم مهاراتك
قد تخدعك بعض الأرقام والنتائج بعد قيامك بحملة تسويقية ما، ستعتقد بأن نسبة التحويل مثلاً 50 % ولكنك ستنصدم لاحقاً بأن عدد العملاء المحتملين قليل لذا فتلك النسبة لا تعني أن الغاية تحققت بالمعدل المطلوب
فالعملية تعتمد على تغيير نسب البسط والمقام في النسبة المئوية وفق ما يتناسب مع واقع الحال فعلى سبيل المثال عندما يكون الهدف حقيقياً يمكن زيادة البسط وإذا كان غير مقصود يمكن تقليل المقام
:قياس معدل النمو والتوقعات
اعتمد على خط بياني يقيس معدل نمو ويحدد صحة التوقعات، فمع مرور الزمن يصبح زيادة معدل النمو الثابت أمراً صعباً إذا أن تحديد قيمة مئوية تجسد قياس الأداء يمكن أن يضيع القيمة الفعلية للعمل
القاعدة 20/80
يعتمد المبدأ الأساسي لهذه القاعدة على التركيز على قيمة كبيرة تمثل 80 % من النتائج والتعامل معها بما يؤمن تطوير الأداء والتحكم بمجرياته بمرونة تامة، ويمكن الاعتماد على هذه القاعدة كبداية لخفض الميزانية المبذولة لهذا المشروع
Advertisements
MECEأدخِل في حساباتك منظومة
وهي منظومة منهجية لمعالجة المشكلات بهدف تقليل الحسابات المجرات والتي تستهلك الكثير من الوقت والجهد
: MECE ويمكن التعرف على 3 مجالات لـ
:شجرة المشكلات *
تكمن الفائدة من هذه العملية في تجزيئها للمشكلات الشائكة والمعقدة فيسهل بذلك حلها بسهولة أكبر، ولتبسيط هذا المفهوم أكثر يمكن القول بأنها تعتمد على تحليل سلوكيات المستخدم وفق تصنيفات معينة (العمر، المهنة، الجنس …)
:شجرة القرار *
تعتمد على تفنيد القراراتوالنتائج المحتملة وتفصيلهاعلى شكل مخطط رسومي يسهل تحديد السلبيات والإيجابيات النسبية لكل قرار، لتقدير القيمة التجارية للخطط الجديدة ومن ثم يتم تحديد الأولويات وترتيبها
:شجرة الاحتمالات *
تختلف عن شجرة المشكلات في كونها تقوم تنسيق الفرضيات بشكل أعمق وتعطي نتائج مباشرة قياساً إلى شجرة المشكلات
:المجموعات النموذجية تمثل قيمة الجودة
المجموعات النموذجية هي المجموعات التي تشترك مع بعضها بمزايا معينة كتاريخ البدء مثلاً فهُم بمثابة تحليلات دقيقة من خلال مراقبة ثباتهم على استخدام تطبيقاتك ومواقعك الإلكترونية
:تجنب الوقوع في البيانات الخاطئة
ويتم ذلك قبل البدء بأي عملية للتحقق من جودة مجموعات البيانات عن طريق مراقبة الإحصائيات المتعلقة بالبيانات وتنسيقها لاستبعاد القيم المتطرفة والتعامل مع البيانات السليمة ويمكنك التأكد من النتائج النهائية عن طريق مقارنة القيم الناتجة مع تحليل مماثل
The Internet includes an endless number of websites of various disciplines and fields, with different content and topics, but the vast majority of them depend on artificial intelligence.
Which made the mechanism of using the Internet more useful and easier for users everywhere
In our article today, we will talk about 12 websites, all of which rely on artificial intelligence to automate various functions, and through which it is possible to create distinguished content in record time.
An important and summary tool for owners of commercial activities and for-profit institutions, as it allows them to know the behavior of competing companies, obtain information from the website, and follow the market movement. In addition, it suggests potential customers to you by tracking their interests that may be compatible with your services, and it is a free site for all
This site specializes in creating attractive designs by means of artificial intelligence. This site is distinguished by the fact that anyone can use this site to create beautiful designs with one click, whether he is an expert in design or not. This site creates wonderful content that can contain a mixture of images, graphics and texts.
This site is very suitable for developing public speaking skills through the techniques it provides that allow you to hear your voice with high accuracy, which makes you recognize the negatives and positives as a speaker in front of people, in other words, the site will enable you to listen to your voice and style of public speaking as if you were one of the audience and listeners
The site also includes videos that enable you to know the effect of body language to communicate the idea to the audience while speaking
This site enables its users to convert audio files, video clips, and live audio recording into texts that are available for editing and subtitles
All you have to do is enter the name of the file to be converted and the location where you want to save it, then the conversion process will start according to a specific time frame, with the ability to preview it during the conversion process.
However, what is wrong with this site is that it does not support all file types on the one hand, and on the other hand, if you want to convert a number of files, you cannot convert them together, rather you have to convert one file after the other, that is, you cannot convert a new file until after the file before it has finished.
This site is distinguished by its ability to find the search results accurately by offering an immediate answer to your questions, while excluding suggestions and guesses from the results.
Once you enter the words or phrases that you want to search for, this site will start searching within the framework of the topic to be found, and then you will have to choose the most appropriate result through the description resulting from the search process
This site saves time and effort, as it has an easy and simple interface, which makes it easier for the user to browse and search
This website makes it easy for users to transcribe notes online to take notes while avoiding losing focus resulting from moving between paragraphs. The user can also record the audio directly so that the audio is converted into text that allows the listeners to understand the meaning of the audio clip, which facilitates the exchange of information. between users
The story of this site seems incredible. Imagine that with texts you can create professional video clips. If the mechanism of this system depends on embodying the user’s personality by creating animated images in several different languages, you can also add sound and music effects to add to your video clip more distinction and excitement.
With all this professionalism and progress in the features provided by this site for creating video clips, its use is not limited to professionals only, but anyone can use it very easily to design videos that rely on artificial intelligence techniques.
A special site for designing memes, which allows users to choose a set of templates or create a template on demand using the creator of memes supported by artificial intelligence. It is enough to add text and images to make memes more professional with one click, and then publish this work on social media, and your product will be the focus of attention for those looking for unique ideas And dazzling works, and thus your sales will increase and your profits will increase
Also from the site distinguished by converting text into speech with the addition of several features such as obtaining the quality of studio recordings, determining the type of voice, translating sounds into texts and many additional free features that will impress you once you see the site and get to know it
The capabilities of this site depend on the creation of distinctive brands or the use of pre-made designs that allow you to obtain various ideas and fake logos in order to be able to determine the colors and titles that are most appropriate for your design.
We have known in the previous sites in this article about sites that convert sounds into texts, but the function of this site is the opposite, that is, it converts texts, i.e. sounds similar to the human voice to the extent that the listener will think that the reader is a human, so this tool is useful for creating audio libraries with the ability to control by votes
Using this site is smooth and simple, as the user has to download the text file so that the site converts it into an accurate and clear sound
In addition, one of the advantages of this site is that it is a gateway to making money by providing texts that are presented in the form of accurate audio recordings that are sold to those interested in buying audio books.
Advertisements
اثنا عشر موقع ذكاء اصطناعي مذهلون سينالون اهتمامك
Advertisements
تضم شبكة الإنترنت عدد لا متناهي من المواقع الإلكترونية متعددة الاختصاصات والمجالات وعلى اختلاف محتواها ومواضيعها إلا أن الغالبية العظمى منها تعتمد على الذكاء الاصطناعي
مما جعل آلية استخدام الإنترنت أكثر فائدة وسهولة للمستخدمين في كل مكان
وسنتناول في مقالتنا اليوم الحديث عن 12 موقع إلكتروني تعتمد جميعها على الذكاء الاصطناعي لأتمتة الوظائف المتنوعة كما وأصبح بالإمكان بواسطتها إنشاء محتوى متميز في زمن قياسي
أداة مهمة وخلاصة لأصحاب الأنشطة التجارية والمؤسسات الربحية فهي تتيح لهم معرفة سلوك الشركات المنافسة والحصول على المعلومات من الموقع الإلكتروني ومتابعة حركة السوق وبالإضافة إلى ذلك يقترح عليك العملاء المحتملين من خلال تتبع اهتماماتهم التي قد تتوافق مع خدماتك وهو موقع مجاني للجميع
هذا الموقع متخصص بإنشاء التصاميم الجذابة بواسطة الذكاء الاصطناعي ويمتاز هذا الموقع بأن بمقدور أي شخص أن يستخدم هذا الموقع لإنشاء التصاميم الجميلة وبنقرة واحدة سواء كان خبير بالتصميم أم لا , يبتكر هذا الموقع محتوى رائع يمكن أن يحوي مزيج من الصور والرسومات والنصوص
هذا الموقع مناسب جداً لتطوير مهارات التحدث أمام الجمهور من خلال ما يوفره من تقنيات تتيح لك سماع صوتك بدقة عالية مما يجعلك تتعرف على السلبيات والإيجابيات كمتحدِّث أمام الناس أي بمعنى آخر سيمكنك الموقع من الاستماع إلى صوتك وأسلوبك في الخطابة كما لو كنت أحد الحضور والمستمعين
كما يتضمن الموقع مقاطع فيديو تمكنك من معرفة تأثير لغة الجسد لإيصال الفكرة إلى الجمهور أثناء التحدث
يمكِّن هذا الموقع مستخدميه من تحويل الملفات الصوتية ومقاطع الفيديو والتسجيل الصوتي المباشر إلى نصوص متاحة للتحرير والترجمة
ما عليك إلا أن تُدخِل اسم الملف المراد تحويله والمكان الذي تريد حفظه فيه ثم تبدأ عمليه التحويل وفق إطار زمني معين مع إمكانية معاينتها أثناء عملية التحويل
إلا أن ما يعيب هذا الموقع أنه لا يدعم جميع أنواع الملفات من جهة , ومن جهة أخرى إذا أردت تحويل عدد من الملفات فلا يمكنك تحويلها مع بعضها بل يتوجب عليك تحويل ملف تلو الآخر أي لا يمكنك تحويل ملف جديد إلا بعد أن ينتهي الملف الذي قبله
يمتاز هذا الموقع بقدرته على العثور على نتائج البحث بدقة من خلال طرح إجابة فورية على أسئلتك مع استبعاد الاقتراحات والتخمينات من النتائج
بمجرد إدخالك للكلمات أو الجُمل التي تريد البحث عنها سيشرع هذا الموقع بالبحث ضمن إطار الموضوع المراد العثور عليه ثم يبقى أمامك اختيار النتيجة الأنسب من خلال الوصف الناتج عن عملية البحث
يوفر هذا الموقع الوقت والجهد فهو يمتاز بواجهة سهلة وبسيطة مما يسهل على المستخدم عملية التصفح والبحث
يسهل هذا الموقع على المستخدمين عملية النسخ عبر الإنترنت لتدوين الملاحظات مع تجنب الوقوع في فقدان التركيز الناتج عن الانتقال بين الفقرات , كما ويمكن للمستخدم بواسطة هذا الموقع أن يقوم بالتسجيل الصوتي مباشرة ليتم تحويل الصوت إلى نص يتيح للسامعين فهم المقصود من المقطع الصوتي مما يسهل تبادل المعلومات بين المستخدمين
تبدو قصة هذا الموقع لا تصدق , تخيل أنه بواسطة نصوص يمكنك إنشاء مقاطع فيديو احترافية إذا تعتمد آلية عمل هذا النظام على تجسيد شخصية المستخدم بواسطة إنشاء صور متحركة بعدة لغات مختلفة كما ويمكنك إضافة المؤثرات الصوتية والموسيقية ليضفي إلى مقطع الفيديو الخاصة بك مزيداً من التميز والإثارة
مع كل هذه الاحترافية والتقدم في الميزات التي يوفرها هذا الموقع لإنشاء مقاطع الفيديو إلا أن استعماله لا يقتصر على المحترفين فقط بل يمكن لأي شخص الاستعانة به بمنتهى السهولة لتصميم الفيديوهات التي تعتمد على تقنيات الذكاء الاصطناعي
موقع خاص لتصميم الميمات والذي يتيح للمستخدمين اختيار مجموعة من القوالب أو ابتكار قالب حسب الطلب باستخدام منشئ الميمات بالمدعوم بالذكاء الاصطناعي , ويكفي إضافة نصوص وصور لجعل الميمات أكثر احترافية وبنقرة واحدة ومن ثم نشر هذا العمل على وسائل التواصل الاجتماعي وسيكون منتجك محط اهتمام الباحثين عن الأفكار المتميزة والأعمال المبهرة وبالتالي سترتفع مبيعاتك وتزيد أرباحك
أيضاً من الموقع المتميزة بتحويل النص إلى كلام مع إضافة عدة ميزات كالحصول على جودة تسجيلات الاستوديو وتحديد نوع الصوت وترجمة الأصوات إلى نصوص والعديد من الميزات الإضافية المجانية التي ستبهرك بمجرد اطلاعك على الموقع والتعرف عليها
تعتمد إمكانيات هذا الموقع على إنشاء العلامات التجارية المميزة أو الاستعانة بتصاميم مجهزة مسبقاً تتيح لك الحصول على أفكار متنوعة وشعارات وهمية لتتمكن من تحديد الألوان والعناوين الأنسب بالنسبة لتصميمك
تعرفنا في المواقع السابقة في عذا المقال على مواقع تقوم بتحويل الأصوات إلى نصوص لكن وظيفة هذا الموقع هي العكس أي أنه يقوم بتحويل النصوص أي أصوات تشبه صوت الإنسان إلى درجة أن السامع سيعتقد أن القارئ هو إنسان , إذاً هذه الأداة مفيدة لإنشاء المكتبات الصوتية مع إمكانية التحكم بالأصوات
استخدام هذا الموقع سلس وبسيط إذ أن على المستخدم أن يحمل الملف النصي ليتولى الموقع تحويله إلى صوت دقيق وواضح أضف على ذلك أن من ميزات هذا الموقع أن يكون باباً لكسب المال من خلال تقديم نصوص تطرح على شكل تسجيلات صوتية دقيقة تباع للمهتمين بالشراء الكتب الصوتية
With the remarkable development and rapid growth witnessed by the data science and analytics community, the demand for this type of science increases, so that the family of data scientists expands at all levels, including beginners, including professional experts, and between those and those. Companies accept the appointment of qualified employees due to their experience in dealing with data, which is the backbone of the comprehensive system on which the general strategy of any company, institution or body is built.
Employment standards may differ from one company to another, but the main goal on which they are based is to obtain an integrated data employee. In general, most companies and institutions are exposed in their practical path to situations, circumstances, and perhaps problems that require good behavior at the right time and time. For them, the expert employee forms a stone with his colleagues. The basis on which the company depends to maintain its existence and progress.
We will study with the standards on which companies base their appointment of employees and managers specializing in data science:
The first stage: submitting applications
We can consider the stage of submitting an application for employment as the first step, which in turn is subject to screening and scrutiny by those in charge of employment based on several conditions:
1. If the applicant fulfills the conditions and qualifications required in the employment advertisement
2. The application should contain all the information that the hiring manager must know about the applicant, including the skills and experiences he possesses and the achievements he achieved in his previous work.
3. To mention in the application his ability to be present in any place specified by the company according to its requirements
4. The applicant should seek a recommendation from a member of the company if there is personal knowledge between them, as this helps the applicant to gain the confidence of the recruitment officials to some extent.
5. The applicant must be careful in predicting his monthly salary, taking into account his level of experience and his competence in leading the position he will assume in the company.
6. The applicant must mention his ability to work for periods that the company deems appropriate and fulfills the purpose, while taking care to choose the optimal time to apply for the job, which is usually during the graduation seasons of new batches of new graduates.
The second stage: CV checking
The application stage is followed, given that the application has been approved, so the stage of checking the applicant’s CV begins, on the basis of which a decision is taken, either with the applicant’s eligibility to attend the interview, or rejection and the exclusion of the applicant who does not meet the conditions.
Here are some points related to this step:
1. Recruiters prefer to see the date of graduation in detail on the resume because this helps them sort based on that date and thus makes it easier for them to make the appropriate decision that depends on the position they need.
2. Employment officials also prefer to get acquainted with the applicant’s skills and experience, in addition to the achievements he achieved in his previous job, as they contribute to improving the chances of acceptance and candidacy for an interview.
3. The applicant should make sure in his CV to arrange his works and projects related to the required and announced specializations first, from newest to oldest.
4. Avoid using flowery words that are useless, and only mention the appropriate words.
5. The applicant should be keen to mention the qualifications he possesses, especially with regard to his ability to continuously initiate the development of work and suggest additions that would raise the level of performance in general.
Advertisements
The third stage: the initial test (online interview)
One of the advantages of this type of tests is that the focus on body language that helps the testers to form an initial idea of the applicant’s personality in the traditional (face-to-face) interviews is non-existent, so the focus of the testers’ attention will be limited to focusing on the verbal signs in the remote interview.
In this context, several things are recommended for the applicant to follow during the interview:
1. This interview method serves introverted people in particular, as the fear of a direct meeting for the applicant here is greatly reduced, which provides greater comfort when answering and reduces confusion.
2. You will draw the interviewer’s attention in a positive way if you conclude the interview by asking about the nature of the tasks that may be entrusted to you if your appointment is approved, the level of the work team, and other questions that indicate that you are interested and excited to join them.
3. Avoid, as much as possible, talking about your virtues in a way that shows that you are arrogant, i.e. show some humility when you mention your skills and experience.
4. When you present your answers, you must be very observant that the tester takes notes while you speak, so pay close attention when he stops writing, so know that he is satisfied with your response, so do not prolong the conversation more than necessary
5. It has been noticed through several experiences that the applicants at the beginning of the interview are enthusiastic and speak fluently and confidently, but this tone gradually decreases with the passage of time until it is almost non-existent at the end of the interview, so beware of falling into this problem and maintain your steadfastness with which you started at the beginning.
The fourth stage: which is the articulation (Panel and coding)
It is almost the most important stage because it determines to a large extent the issue of accepting or rejecting the applicant.
Here, the testers prepare a board that tests the applicants’ ability to deal with difficulties and pressures by identifying their technical skills that they use to solve these problems, and they are often inspired by realistic conditions that companies usually go through by virtue of their practical career, so it is advised that applicants create a board at home or write a code during the interview.
Therefore, we recommend several points that must be taken into account in order to overcome this transitional stage:
1. Focus while presenting the task assigned to you
2. Don’t keep your attention on the person asking the questions, but try to interact with everyone on the board
3. Support your answers with various examples within the framework of stories that explain your skills and experience
4. Be prepared to answer any question that may be asked of you related to the skill mentioned in the job description
5. Create an accurate idea about each of the elements of the board in order to form a correct mechanism for dealing with each of them separately in an appropriate and appropriate manner for each case.
Stage 5: Recommended behaviors after the interview
It is not obligatory insofar as it reflects a positive impression of you on the part of the interviewer. Therefore, if you are interested in expanding your chances of gaining the satisfaction of the interviewer and leaving a good impression on himself, you must follow the following:
1. Do not forget to thank the tester for the time that the tester gave you, of course, in a short and simple way
2. Never end your current employment relationship on the grounds that you passed the interview for the new job until you are absolutely sure that you have already been hired so that you do not lose both.
3. Maintain the confidentiality of what happened in the interview and do not publish any information related to the company unless you are exposed to fraud or deception. Here you must alert others and help that this not be repeated with applicants other than you.
This was a quick overview of the steps and stages that recruitment officials adopt in their selection of applicants. If you know the criteria they adopt, it will be easy for you to form a future plan that will help you overcome this task, which is often an obsession for every job applicant in data science.
Advertisements
ما هي المعايير المعتمدة في توظيف محللي البيانات ؟
Advertisements
مع التطور الملحوظ والنمو المتسارع الذي يشهده مجتمع علم البيانات وتحليلاتها يزداد الإقبال على هذا النوع من العلوم ليزداد توسع عائلة علماء البيانات على كافة مستوياتهم فمنهم المبتدئين ومنهم الخبراء المحترفين وبين أولئك وهؤلاء يشهد قطاع التوظيف في علم البيانات طلباً متزايداً في الآونة الأخيرة ويبقى السعي المستمر والدؤوب من قبل الشركات لتعيين الموظفين أصحاب الكفاءات نظراً لما يتمتعون به من خبرة في التعامل مع البيانات التي هي عصب المنظومة الشاملة التي تبنى عليها الاستراتيجية العامة لأي شركة أو مؤسسة أو هيئة
ولربما تختلف معايير التوظيف بين شركة وأخرى إلا أن الهدف الأساسي الذي ترتكز عليه هو الحصول على موظف بيانات متكامل , فبالمجمل تتعرض أغلب الشركات والمؤسسات في مسيرتها العملية إلى مواقف وظروف وربما مشاكل تحتاج إلى حُسن التصرف في الوقت والزمان المناسبين وبالنسبة لهم الموظف الخبير يشكل مع زملائه حجر الأساس الذي تعتمد عليه الشركة في المحافظة على كيانها وتقدمها
: وسنقوم بدراسة مع المعايير التي ترتكز عليها الشركات في تعيين الموظفين والمدراء المتخصصين في علم البيانات
المرحلة الأول : تقديم الطلبات
يمكننا اعتبار مرحلة تقديم الطلب للتوظيف هي الخطوة الأولى وهي تخضع بدورها إلى الفرز والتدقيق من قبل القائمين على التوظيف بناءً على عدة شروط
في حال كان مقدم الطلب يحقق الشروط والمؤهلات المطلوبة في إعلان التوظيف
أن يحتوي الطلب على جميع المعلومات التي يجب على مدير التوظيف أن يعرفها عن مقدم الطلب بما فيها المهارات والخبرات التي يمتلكها والإنجازات التي حققها في عمله السابق
أن يذكر في الطلب قدرته على التواجد في أي مكان تحدده الشركة وفق متطلباتها
على مقدم الطلب أن يسعى للحصول على تزكية من أحد أفراد الشركة إذا كانت هناك بينهما معرفة شخصية فهذا يساعد في حصول مقدم الطلب على ثقة مسؤولي التوظيف نوعاً ما
يجب أن يحرص المتقدم على توخي الحذر في توقع راتبه الشهري آخذاً بعين الاعتبار مستوى خبرته وجدارته في قيادة المنصب الذي سيتولاه في الشركة
على المتقدم أن يذكر قدرته على العمل لفترات تراها الشركة مناسبة وتفي بالغرض مع الحرص على اختيار الوقت الأمثل للتقدم للوظيفة والذي عادة ما يكون خلال مواسم تخريج دفعات جديدة من الخريجين الجدد
المرحلة الثانية : تدقيق السيرة الذاتية
تلي مرحلة طلب التقدم على اعتبار أن الطلب قوبل بالموافقة فتبدأ مرحلة تدقيق السيرة الذاتية للمتقدم التي بناءً عليها يتم اتخاذ القرار إما بأحقية المتقدم لحضور المقابلة أو الرفض واستبعاد المتقدم الذي لا يحقق الشروط
: وفيما يلي توضيح لبعض النقاط المتعلقة بهذه الخطوة
يفضل مسؤولو التوظيف أن يروا على السيرة الذاتية تاريخ التخرج بشكل مفصل لأن هذا يساعدهم على الفرز بناءً على ذلك التاريخ وبالتالي يسهل عليهم اتخاذ القرار المناسب الذي يعتمد على المنصب الذي يحتاجونه
كما يفضل مسؤولو التوظيف أن يتعرفوا على مهارات المتقدم وخبراته التي اكتسبها إضافة إلى الإنجازات التي حققها في وظيفته السابقة فهي تسهم في تحسين فرص القبول والترشح للمقابلة
على المتقدم أن يحرص في سيرته الذاتية على ترتيب أعماله ومشاريعه التي تتعلق بالاختصاصات المطلوبة والمعلن عنها أولاً من الأحدث إلى الأقدم
تجنُّب ذِكر الألفاظ المنمقة التي لا طائل منها والاكتفاء بذكر الكلمات المناسبة
على المتقدم أن يحرص على ذِكر المؤهلات التي يمتلكها وخاصة فيما يتعلق بقدرته على المبادرة المستمرة على تطوير العمل واقتراح إضافات من شأنها رفع سوية الأداء بشكل عام
Advertisements
المرحلة الثالثة : الاختبار الأولي ( مقابلة أون لاين )
من إحدى مزايا هذا النوع من الاختبارات أن التركيز على لغة الجسد التي تساعد المختبرين على تكوين فكرة مبدئية عن شخصية المتقدم في المقابلات التقليدية ( وجهاً لوجه ) تكون معدومة لذا سينحصر جل اهتمام المختبرين على التركيز على العلامات اللفظية في المقابلة عن بعد
: وفي هذا السياق يُنصح بعدة أمور على المتقدم أن يتبعها أثناء المقابلة
تخدم طريقة المقابلة هذه على وجه الخصوص الأشخاص الانطوائيين , فرهبة اللقاء المباشر بالنسبة للمتقدم هنا تقل بنسبة كبيرة مما يوفر أريحية أكبر عند الإجابة وتقلل من الارتباك
ستلفت نظر المُحاور بطريقة إيجابية إذا ختمت المقابلة بالسؤال عن طبيعة المهام التي قد توكَل إليك في حال تمت الموافقة على تعيينك ومستوى فريق العمل وما إلى ذلك من الأسئلة التي تدل على أنك مهتم ومتحمس للانضمام إليهم
تجنب قدر الإمكان التحدث عن مناقبك بطريقة تظهر أنك مغرور , أي أظهر شيئاً من التواضع عند ذِكرك لمهاراتك وخبراتك
يجب عند طرحك لإجاباتك أن تكون شديد الملاحظة على أن المُختبِر يسجل الملاحظات أثناء تحدثك لذا انتبه جيداً عندما يتوقف عن الكتابة فاعلم أنه اكتفى بردِّك فلا تُطِلْ الحديث أكثر من اللازم
من الملاحظ من خلال عدة تجارب أن المتقدمين في بداية المقابلة يكونون متحمسين ويتحدثون بطلاقة وثقة ولكن هذه النبرة تنخفض تدريجياً مع مرور الوقت حتى تكاد تنعدم في آخر المقابلة لذا احذر من الوقوع في هذه المشكلة وحافظ على ثباتك الذي انطلقت به في البداية
المرحلة الرابعة : وهي المفصلية ( اللوحة والترميز )
وهي تكاد تكون أهم مرحلة لأنها تحدد إلى حد كبير مسألة قبول المتقدم أو رفضه
وهنا يقوم المختبرون بتجهيز لوحة تختبر مدى قدرة المتقدمين على التعامل مع الصعوبات والضغوط من خلال التعرف على مهاراتهم الفنية التي يستخدمونها في حل تلك المشاكل وغالباً ما تكون مستوحاة من ظروف واقعية تمر بها الشركات عادةً بحكم مسيرتها العملية لذا يُنصح المتقدمون بابتكار لوحة في المنزل أو كتابة رمز أثناء المقابلة
: لذا نوصي بعدة نقاط يجب مراعاتها لتجاوز هذه المرحلة الفاصلة
التركيز أثناء طرح المَهمة الموكلة إليك
لا تبقي تركيز واهتمامك على الشخص الذي يطرح الأسئلة بل حاول أن تتفاعل مع الجميع في اللوحة
ادعم إجاباتك بأمثلة متنوعة ضمن إطار قصص تشرح ما تتمتع به من مهارات وخبرات
هيء نفسك للإجابة على أي سؤال يمكن أن يطرح عليك يتعلق بالمهارة المذكورة في الوصف الوظيفي كوّن فكرة دقيقة عن كل عنصر من عناصر اللوحة لتتشكل لديك آلية صحيحة في التعامل مع كل منها على حدى بشكل مناسب وملائم لكل حالة
المرحلة الخامسة : سلوكيات موصى بها بعد المقابلة
وهي ليست اجبارية بقدر ما تعكس انطباعاً إيجابياً عنك لدى القائم على المقابلة لذا إن كنت مهتماً بتوسيع فرصك بنيل رضا المُحاور وترك أثر طيب في نفسه فعليك اتباع التالي
لا تنسَ أن تتوجه بالشكر على الوقت الذي منحك إياه المُختبِر وطبعاً بشكل موجز وبسيط
إياك أن تنهي علاقتك الوظيفية الحالية على اعتبار أنك تجاوزت المقابلة في الوظيفة الجديدة حتى تتأكد تماماً أنه قد تم تعيينك بالفعل حتى لا تفقد الاثنين معاً
حافظ على سرية ما جرى في المقابلة ولا تنشر أي معلومات تتعلق بالشركة إلا إذا تعرضت لعملية احتيال أو خداع فهنا يجب أن تنبه الآخرين وتساعد على أن لا يتكرر هذا مع متقدمين غيرك
كانت هذه لمحة سريعة عن الخطوات والمراحل التي يعتمدها مسؤولو التوظيف في اختيارهم للمتقدمين , فإذا عرفت المعايير التي يعتمدونها فيسهل عليك تكوين خطة مستقبلية تعينك على تجاوز هذه المهمة التي غالباً ما تشكل هاجس لدى كل متقدم إلى وظيفة في علم البيانات
Data has become the driving nerve of global trade at all levels, whether at the level of large companies or at the level of a small profitable project. Accordingly, data science has become the science of the times, so data analysis skills have the largest share of attention among various bodies and business events, and international seminars and conferences related to science are held. Data, and what we will discuss in this article is to talk about the best conferences in the field of data science.
How to find the best conference:
Any place or organization that presents important ideas and information related to data science and its analysis is the destination for those looking for knowledge and experience in this field. Therefore, scientific conferences that discuss data science are considered one of the important outlets for them to gain valuable information.
Strata is considered one of the largest conferences concerned with data science topics and its analytics in all its branches. Many are keen to attend the scientific events held by Strata due to the exchange of experiences and communication with technicians and senior data scientists and gaining experience from them.
The important role of data science conferences cannot be neglected, especially for those who are about to take a new job in data science, through which they get advice and instructions that will benefit them at the beginning of their practical and professional lives. related to data science and analytics.
So we will learn about the three best conferences for data science and analytics.
Top Three Data Science Conferences:
Data science employees are among the highest paid employees, and this increases the demand for a job like this, and obtaining it is the dream of every data scientist, so learners spare no time or effort to obtain any information that increases their experience and expands their skills to obtain a good balance of information that increases their chances when applying. Therefore, we advise those who wish to raise their academic credentials in data science with three conferences that are considered the best in the field of data science and analytics, according to the vote of the data science community: 1- ODSC East 2- Strata 3- KDD.
In these conferences, you find a lot of experiences that others have gone through and you hear about success stories that people have experienced in their professional lives. Experts present the obstacles and difficulties that they faced during their journey in data science and analytics and talk about their methods and methods in addressing those problems so that the attendees gain experience and learn the best ways to become data scientists. Experts and seasoned.
The same applies to the industrial community, as conferences are the best place to learn data science, so whoever has the opportunity to attend one of these conferences must take advantage of his presence by acquiring as much information as possible.
Advertisements
How do you invest your presence in the data science conference?
Fortunately, these conferences are held throughout the year, but it may be difficult for you to find exactly what you need in one of the scientific events held by one of these conferences. Therefore, you must know how to choose the appropriate conference that you should attend in order to obtain the desired benefit.
For beginners in data science, it is recommended to view Strata + Hadoop World, through which you can keep abreast of modern technologies and successive developments. As for experts in data science, they recommend KDD conferences on visual analytics. As for those wishing to acquire more specialized skills, they must review the Data Science Unconference or the Analytics Summit. for innovation.
Once we talk about data science conferences, you should know that the choice will not be easy. The scientific benefit that you aspire to obtain must be in line with the material value that you spend in order to obtain that information when you attend these conferences.
In the end, it should be noted that there are many data science conferences, but these conferences that we mentioned are approved in the Defacto standard in the world of data science.
Advertisements
أفضل 3 مؤتمرات لعلوم البيانات والتحليلات
Advertisements
أصبحت البيانات العصب المحرك للتجارة العالمية على كافة المستويات سواء على مستوى الشركات الكبرى أو على مستوى مشروع ربحي صغير وبناء عليه أصبح علم البيانات علم العصر لذا تحوز مهارات تحليل البيانات على النصيب الأكبر من الاهتمام لدى مختلف الهيئات والفعاليات التجارية , وأصبحت تعقد الندوات والمؤتمرات العالمية المتعلقة بعلم البيانات , وما سنتناوله في هذه المقالة هو الحديث عن أفضل المؤتمرات في مجال علم البيانات
كيفية العثور على المؤتمر الأفضل
أي مكان أو هيئة تطرح أفكاراً ومعلومات هامة تخص علم البيانات وتحليلاتها هو مقصد الباحثين عن المعرفة والخبرة في هذا المجال لذا تعتبر المؤتمرات العلمية التي تبحث في علم البيانات واحداً من المنافذ الهامة بالنسبة لهم لاكتساب المعلومات القيمة
وتعتبر “ستراتا” من كبرى المؤتمرات التي تهتم بمواضيع علم البيانات وتحليلاتها بكافة فروعها ويحرص الكثيرين على حضور المناسبات العلمية التي تقيمها شركة “ستراتا” نظراً لما يوفره هذا المؤتمر من تبادلٍ للخبرات والتواصل مع الفنيين وكبار علماء البيانات واكتساب الخبرة منهم
لا يمكن إهمال الدور الهام لمؤتمرات علوم البيانات ولاسيما للمقبلين على وظيفة جديدة في علم البيانات فمن خلالها يحصلون على نصائح وتعليمات تفيدهم في مستهل حياتهم العملية والمهنية ولا تقتصر فائدة هذه المؤتمرات على المبتدئين بل وعلى الخبراء والمخضرمين في مجال الصناعة فهذه فرصة كبيرة لهم للاطلاع على أحدث التطورات المتعلقة بعلم البيانات والتحليلات
لذا سنتعرف على أفضل ثلاث مؤتمرات لعلوم البيانات والتحليلات
أفضل ثلاث مؤتمرات لعلوم البيانات
يعتبر موظفو علوم البيانات من أعلى الموظفين أجراً وهذا ما يزيد الإقبال على وظيفة كهذه ويعتبر الحصول عليها هو حلم كل عالِم بيانات , لذا لا يدَّخر المتعلمون وقتاً ولا جهداً للحصول على أي معلومات تزيد من خبراتهم وتوسع مهاراتهم لينالوا رصيداً جيداً من المعلومات التي تزيد فرصهم عند التقدم للوظيفة , لذا ننصح من يرغبون برفع رصيدهم العلمي في علم البيانات بثلاث مؤتمرات تعتبر الأفضل في مجال علم البيانات والتحليلات وفق تصويت مجتمع علم البيانات
1- ODSC East 2- Strata 3- KDD : هي
في هذه المؤتمرات تجد الكثير من التجارب التي خاضها الآخرين وتسمع عن قصص النجاح التي عاشها الناس في حياتهم المهنية , يطرح الخبراءُ العقبات والمصاعب التي واجهتهم أثناء رحلتهم في علم البيانات والتحليلات ويتحدثون عن أساليبهم وطرقهم في معالجة تلك المشاكل ليكتسب الحضور الخبرة ويتعلموا أفضل الطرق ليصبحوا علماء بيانات خبراء ومتمرسين
وكذلك ينطبق الأمر على المجتمع الصناعي فالمؤتمرات هي المكان الأفضل لتعلم علوم البيانات لذا يجب على من أُتيحت له الفرصة بحور أحد هذه المؤتمرات أن يستغل تواجده باكتساب أكبر قدر ممكن من المعلومات
Advertisements
كيف تستثمر حضورك في مؤتمر علم البيانات ؟
ومن حسن الحظ أن هذه المؤتمرات تُعقد على مدار العام ولكن قد يكون من الصعب عليك أن تجد ضالتك تحديداً في إحدى المناسبات العلمية التي تقيمها أحد هذه المؤتمرات
لذا يجب عليك أن تعرف كيف تختار المؤتمر المناسب الذي ينبغي عليك حضوره لتُحصِّل الفائدة المرجوة
فبالنسبة للمبتدئين في علم البيانات يُنصح بالاطلاع
Strata + Hadoop World على
فمن خلالها يمكنك مواكبة التقنيات الحديثة والتطورات المتلاحقة , أما بالنسبة الخبراء في علم البيانات فينصحون
KDD بمؤتمرات
الخاصة بالتحليلات المرئية , أما بالنسبة للراغبين باكتساب مهارات أكثر تخصصاً فلابد من
Data Science Unconference مراجعة
للابتكار Analytics أو قمة
وبمجرد الحديث عن مؤتمرات علم البيانات يجب أن تعلم أن الخيار لن يكون سهلاً فالفائدة العلمية التي تطمح للحصول عليها يجب أن تتماشى بالتوازي مع القيمة المادية التي تنفقها في سبيل الحصول على تلك المعلومات عند حضورك لتلك المؤتمرات
وفي النهاية يجب التنويه إلى أن هناك العديد من مؤتمرات علم البيانات ولكن هذه المؤتمرات التي ذكرناها هي المعتمدة
In this article, we will show the similarities and differences between business intelligence and data analysis, with a brief overview of each.
In the beginning, we talk about data analysis, which in general represents data science, which is summarized in the process of extracting useful information from a data set that is examined and processed according to a specific technique in order to obtain a formula that helps take the necessary and appropriate measures to ensure the functioning of the business process or the work of government institutions or scientific bodies. or educational sectors optimally.
Data analytics provides highly efficient techniques in developing the work of the commercial system as a whole, such as improving the buying and selling processes, identifying the most popular and selling products, customer behavior, etc., based on the data resulting from the analysis processes, within the framework of two types of data analysis:
Confirmed Data Analytics (CDA), which relies on statistics to determine the validity of a data set, and Exploratory Data Analytics (EDA), which relies on choosing models and types of data.
Based on the above, we can identify four types of data analysis:
Descriptive analytics: includes descriptions that are based on facts about a prior event, event A, and then event B
Diagnostic analytics: focuses on why these facts occurred, regardless of what happened in the past. B did not happen because of A, but C caused B to happen
Predictive analytics: based on future predictions based on historical data. Because B happened because of C, we expect that B will happen in the future because C happens
Descriptive analytics: depends on directing executive actions towards a specific goal. To prevent B from happening, we must take action Z
As for business intelligence, it includes the plans and techniques adopted by companies and institutions in dealing with business-related data to derive positive results that lead to sound decisions. Data forms, and it allows them to automate data collection and analysis, which makes it easier to carry out all tasks with the least possible time and effort.
Business intelligence to extract key information depends on the data warehouse known as (EDW), which is the main store of primary databases collected from several sources and integrated into a central system used by the company to help it generate reports and build analyzes that in turn lead to taking the right actions.
Based on the aforementioned, we can determine the course of the procedures that make up business intelligence according to the following:
Collecting and converting data from different sources:
Business intelligence tools rely on the collection of regular and random data from various sources, then they are coordinated and classified according to the requirements of companies’ strategies to keep them in the central data store to facilitate their use later in the analysis and exploration processes.
Determine paths and recommendations:
Business intelligence techniques contain an extensive data identification system, and thus the forecasting process by offering proposals and solutions is more accurate and effective.
Presentation of the results in the form of graphic visualizations:
The data visualization process is one of the techniques that has proven effective in understanding the content of the results and sharing them with others. It is a process on which business intelligence relies heavily due to the availability of charts and graphs that enable business owners to form a more comprehensive and accurate view of the results presented.
Advertisements
Take the appropriate measures according to the data generated in a timely manner:
This step is usually done by comparing the previous results with the results presented at the present time for businesses and commercial activities in general, which makes it easier for the owners of these businesses to take the necessary and appropriate measures and make adjustments in record time and build a sound base for future plans.
Differences between business intelligence and data analysis:
We must first touch on the configurational interface of the EDW data warehouse
The data warehouse is the basic environment for storing multi-source data in order to deal with it later, if it has absolutely no connection with the database system used in daily transactions, so the data store is intended to be used by companies and institutions to generate insights for solutions and suggestions for specific practical issues in a timely manner.
Since the data stored within the data warehouse is multi-source and processed via the Internet, this requires that it be extracted from those sources and employed within a strategy that is compatible with the company’s work and then loaded into OLAP (i.e. online processing and analysis), and the Operational Data Store (ODS) is used to prepare Operational and commercial reports, which has a longer storage period than OLAP.
If we want to make a simple representation of the above, we notice that the data market is a miniature model of the data warehouse, but it diverts its attention to a specific functional aspect such as sales, production and promotion plans, and this is done by a specialized branch within the general system.
Advertisements
مقارنة بين ذكاء الأعمال وتحليل البيانات
Advertisements
سنبين في هذا المقال أوجه التشابه والاختلاف بين ذكاء الأعمال وتحليل البيانات مع ذكر نبذة مختصرة عن كل منهما
تنطرق في البداية إلى الحديث عن تحليل البيانات الذي يمثل بالمجمل علم البيانات والذي يتلخص في عملية استخراج المعلومات المفيدة من مجموعة بيانات يتم فحصها ومعالجتها وفق تقنية معينة بغية الحصول على صيغة تساعد على اتخاذ الإجراءات اللازمة والمناسبة لضمان سير العملية التجارية أو عمل المؤسسات الحكومية أو الهيئات العلمية أو القطاعات التعليمية بالشكل الأمثل توفر تحليلاتُ البيانات تقنياتٍ ذات كفاءة عالية في تطوير عمل المنظومة التجارية ككل مثل تحسين عمليات البيع والشراء وتحديد المنتجات الأكثر طلباً وبيعاً وسلوك العملاء وغيرها وذلك بالاعتماد على البيانات الناتجة من عمليات التحليل وذلك في إطار نمطين من تحليل البيانات
(CDA) تحليلات البيانات المؤكدة
التي تعتمد على الإحصاء لتحديد مدى صحة مجموعة البيانات
(EDA) وتحليلات البيانات الاستكشافية
التي تعتمد على اختيار نماذج وأنواع البيانات
:وبناءً على ما سبق يمكننا تحديد أربع أنواع من تحليل البيانات
تحليلات وصفية : تتضمن الوصف الذي يعتمد على الوقائع المتعلقة بحدث سابق
B ثم حدث A حدث
تحليلات تشخيصية : تركز على السبب وراء حدوث تلك الحقائق بغ النظر عما حدث في السابق
, A بسبب B لم يحدث
B كان سبب حدوث C ولكن
تحليلات تنبؤية : تعتمد على التنبؤات المستقبلية بالاعتماد على البيانات التاريخية
, C حدث بسبب B لأن
سيحدث في المستقبل B نتوقع أن
يحدث C لأن
تحليلات وصفية : تعتمد على توجيه إجراءات تنفيذية نحو غاية معينة
B لمنع حدوث
Z يجب علينا اتخاذ الإجراء
أما ذكاء الأعمال فيتضمن الخطط والتقنيات التي تعتمدها الشركات والمؤسسات في التعامل مع البيانات المتعلقة بالأعمال لاستخلاص نتائج إيجابية تفضي إلى قرارات سليمة , وتتيح تقنيات ذكاء الأعمال لأصحاب العمل إيجاد صيغ متنوعة للبيانات لتحديد الأداء الفني للعمل كالبيانات السابقة والبيانات الحالية والبيانات الخارجية والبيانات الداخلية والبيانات المنظمة وغيرها من أشكال البيانات , كما وتتيح لهم أتمتة تجميع البيانات وتحليلاتها مما يسهل القيام بجميع المهمات بأقل وقت وجهد ممكن
يعتمد ذكاء الأعمال لاستخراج المعلومات الرئيسية على مستودع البيانات
(EDW) الذي يعرف باسم
والذي هو المخزن الرئيسي لقواعد البيانات الأولية المجمَّعة من عدة مصادر والمدمجة في نظام مركزي تستخدمه الشركة ليعينها على إنشاء التقارير وبناء التحليلات التي بدورها تفضي إلى اتخاذ الإجراءات الصائبة
: وبناءً على ما ذكر آنفاً يمكن أن نحدد مسار الإجراءات المكوِّنة لذكاء الأعمال وفق ما يلي
:تجميع البيانات وتحويلها من مصادر مختلفة
تعتمد أدوات ذكاء الأعمال على تجميع البيانات المنتظمة والعشوائية من مصادر مختلفة ثم يتم تنسيقها وتصنيفها وفق متطلبات استراتيجيات الشركات لتحفظ بعدها في المخزن البيانات المركزي ليسهل استخدمها لاحقاً في عمليات التحليل والاستكشاف
:تحديد المسارات والتوصيات
تحوي تقنيات ذكاء الأعمال نظام تحديد البيانات بشكل موسع وبالتالي تكون عملية التنبؤ بطرح الاقتراحات والحلول أكثر دقة وفاعلية
:عرض النتائج على شكل تصورات بيانية
تعتبر عملية تصور البيانات من التقنيات التي أثبتت فاعليتها في فهم مضمون النتائج وتشاكرها مع الآخرين وهي عملية يعتمد عليها ذكاء الأعمال بشكل كبير نظراً لما توفره من إعداد المخططات والرسوم بيانية التي يمكن أصحاب الأعمال من تكوين نظرة أكثر شمولية ودقة للنتائج المطروحة
Advertisements
:اتخاذ الإجراءات المناسبة وفقاً للمعطيات الناتجة في الوقت المناسب
وعادة ما تتم هذه الخطوة بمقارنة النتائج السابقة مع النتائج المطروحة في الوقت الراهن للأعمال والأنشطة التجارية بشكل عام مما يسهل على أصحاب هذه الأعمال اتخاذ الإجراءات اللازمة والمناسبة وإجراء التعديلات في زمن قياسي وبناء قاعدة سليمة للخطط المستقبلية
:أوجه الاختلاف بين ذكاء الأعمال وتحليل البيانات
لابد لنا في البداية أن نتطرق إلى البينية التكوينية
EDW لمستودع البيانات
مستودع البيانات هو البيئة الأساسية لتخزين البيانات متعددة المصادر بغية التعامل معها لاحقاً إذا أن لا صلة له إطلاقاً بمنظومة قاعدة البيانات المستخدمة في بالتعاملات اليومية إذاً مخزن البيانات معد لتستخدمه الشركات والمؤسسات لتكوين رؤى لحلول واقتراحات لقضايا عملية محددة في الوقت المناسب
وبما أن البيانات المخزنة داخل مستودع البيانات هي متعددة المصادر ومعالجة عبر الإنترنت فهذا يتطلب أن يتم استخراجها من تلك المصادر وتوظيفها ضمن استراتيجية تتوافق مع عمل الشركة
OLAP ثم يتم تحميلها في
( أي المعالجة والتحليل عبر الإنترنت )
(ODS) كما ويستخدم مخزن البيانات التشغيلية
لتجهيز التقارير التشغيلية والتجارية وهو يتمتع
OLAP بمدة تخزين أطول من
وإذا أردنا إجراء تمثيل بسيط لما سبق نلاحظ أن سوق البيانات هو نموذج مصغر من مستودع البيانات إلا أنه يصرف اهتمامه إلى جانب وظيفي معين كالمبيعات والإنتاج وخطط الترويج وذلك يتم بواسطة فرع مختص ضمن المنظومة العامة
There is no doubt that a job in data science constitutes a dream for many students of this type of science, which is considered the science of the era. The skills required by this functional work or by addressing the problems and obstacles that impede the workflow in general, on its own or with the help of colleagues who exchange experiences and skills among themselves, so this job is a dream that data scientists everywhere aspire to achieve.
What we mentioned above is the bright side of talking about a job in data science, but if we look at the other side, we will find ourselves talking about the existence of statistics indicating that large numbers of data scientists, especially machine learning specialists, spend a long time searching for new jobs.
In this article, we will shed light on the most prominent reasons that drive many data scientists to search for new jobs, of which we chose four reasons:
1. Colliding with a reality contrary to expectations:
Data scientists initially believe that dealing with data is about addressing the obstacles and problems they face with the help of machine learning algorithms that have valuable and diverse characteristics that benefit the field of business in general, but they collide with a reality that is contrary to the prevailing belief. For example, we can talk For a specific company that hires employees regardless of whether they have experience in artificial intelligence or not, this company may tend to hire young people at the expense of those with experience and expertise in this field. A balance of information that enables him to use machine learning algorithms in addressing problems whose solution requires the use of other techniques that he has not mastered yet. Dealing with databases of all kinds and creating analytical bulletins in this case was not at the required level, which creates a kind of dissatisfaction among administrators towards the data scientist. incumbent
Therefore, some specialists give useful instructions to novice data scientists to help them avoid falling into such predicaments, such as the novice data scientist taking into account the appropriate environment for his technical level, such as searching for companies that match the skills he has reached until he develops his skills with continuous practice, given that he is not yet used to Facing all challenges and problems that require high efficiency and speed in addressing them
It is also advised that the novice data scientist not get involved in applying to companies that do not place machine learning among their most basic strategies in their dealings and analyzes, because this will negatively affect the development of experience and skill of the data scientist, who certainly aspires to reach the competence that enables him to obtain a better job.
2. The right person in the right place:
Employment decision-makers must have a positive impression of you when you apply for a job in their company, as this increases your chances of obtaining priority in acceptance, and this impression is formed when they discover your skills that they really need by presenting the projects that you have done, especially your method of dealing with a life problem that confronts A certain category of people, because the impression they will have on you will determine for them the extent of their need for your services in their company and the extent to which these skills are compatible with the general policy of the company.
Advertisements
3. You are a data scientist who is able to handle all types of data:
For recruiters and those in charge of the test and interview, you are a data scientist, and therefore, from their point of view, you are able to deal with all types of data, including databases, especially preparing analytical bulletins and preparing appropriate reports.
Even your co-workers will assume that you can handle all the data analytics tools, big data, and everything related to machine learning and artificial intelligence.
So when a company hires you, you are definitely an expert in all these matters, so be clear from the beginning and inform them of your skills that you have mastered well on the one hand, and of your information that you think you need to refine and develop, in order to avoid a defect in what is expected of you to present in your work and between what you might They are surprised by the weakness in some of the skills that I brought them. Some companies resort to setting certain specifications for applicants that make it easier for hiring officials to choose those who see themselves as fulfilling these conditions and possessing the competence to be active members within a cadre of experts and distinguished in data science.
When the work is based on the exchange of experiences and joint cooperation between all specializations, you undoubtedly see satisfactory results and you can clearly see the professionalism in the general environment of the work as a whole, and therefore it will reflect positively on the users as it provides them with benefit and comfort in dealing with it.
For example, a data scientist who is an expert in machine learning techniques is considered part of an integrated work system that is able to utilize time and effort optimally, and vice versa. Solo work for a specific specialty in isolation from an integrated team with diverse experiences will cost significant time and effort, which negatively affects the workflow.
4. Integrated work among team members:
However, some companies resort to using their employees to create their own projects away from focusing on the diversity of experiences, so any employee can write many codes that help solve a specific problem or make analytical charts, and if that consumes a lot of time, then this is not important to them, but On the contrary, for large companies, the time factor is very important, so they use integrated teams to accomplish complex tasks, as they are in a constant race against time, so the diversity of specializations is very important for them.
And in application of the aforementioned, your right choice of the type of company in which you are looking for a job represents a fundamental and important pillar in the extent to which you adapt to the general environment in that company, so that your experience in a specific field in a company that relies on the diversity of experiences will make you work with full comfort within your specialization, that is, your work will be integrated with the rest The competencies of the team members, and thus you will avoid falling into the trap of work pressure and exhaustion, which will eventually lead you to search again for a suitable job.
From the foregoing, we conclude that the successful selection of the appropriate job will greatly contribute to providing an appropriate and comfortable work environment that allows the employee to employ his skills and develop his experiences in a complete manner, avoiding the specter of the persistent search and movement for a better job. Psychological stability and comfort at work at all levels are the key to success and creativity, so do not skimp on Yourself and be careful in choosing, with our best wishes.
Advertisements
الأسباب التي تدفع الكثير من علماء البيانات إلى ترك وظائفهم
Advertisements
مما لاشك فيه أن وظيفة في علم البيانات تشكل حلم للكثيرين من دارسي هذا النوع من العلوم الذي يعتبر علم العصر فهذه نظراً لكون هذه الوظيفة تعود على صاحبها بالعائد المادي الكبير الذي يؤمن له حياة كريمة علاوة على الفائدة التي يجنيها باكتسابه الخبرات سواء جراء تعامله مع كافة أنواع المهارات التي يتطلبها هذا العمل الوظيفي أو من خلال معالجته للمشاكل والمعوقات التي تعترض سير العمل بشكل عام وذلك بمفرده أو بمساعدة زملاء يقومون بتبادل الخبرات والمهارات فيما بينهم , إذاً تعتبر هذه الوظيفة حلم يطمح لتحقيقه علماء البيانات في كل مكان
ويعتبر ما أسلفنا هو الجانب المضيء من الحديث عن وظيفة في علم البيانات ولكن إذا نظرنا إلى الجانب الآخر فسنجد أنفسنا نتحدث عن وجود إحصائيات تشير إلى أن أعداد كبيرة من علماء البيانات وخاصة المتخصصين بالتعلم الآلي يقضون وقتاً طويلاً في البحث عن وظائف جديدة
وسنسلط الضوء في هذا المقال عن أبرز الأسباب التي تدفع كثير من علماء البيانات للبحث عن وظائف جديدة والتي اخترنا منها أربعة أسباب
1. الاصطدام بواقع مغاير للتوقعات :
يعتقد علماء البيانات في بادئ الأمر أن التعامل مع البيانات هو عبارة عن معالجة العوائق والمشكلات التي تواجههم بالاستعانة بالخوارزميات الخاصة بالتعلم الآلي والتي تتمتع بخصائص قيّمة ومتنوعة تفيد مجال الأعمال بشكل عام , إلا أنهم يصطدمون بواقع مغاير للاعتقاد السائد فعلى سبيل المثال لا الحصر يمكننا أن نتناول الحديث عن شركة معينة تقوم بتعيين موظفين بغض النظر عن امتلاكهم لخبرات في الذكاء الاصطناعي أم لا , فقد تكون هذه الشركة تميل لتوظيف الشباب على حساب ذوي الخبرة والمحنكين في هذا المجال , بالطبع هذا سيؤدي إلى علاقة غير مستقرة وظيفياً بين الموظف ورئيسه , فالموظف الشاب يحمل في جعبته رصيد من المعلومات التي تمكنه من استخدام خوارزميات التعلم الآلي في معالجة مشاكل يتطلب حلها استخدام تقنيات أخرى لم يكن قد أتقنها بعد فالتعامل مع قواعد البيانات بشتى أنواعها وإنشاء نشرات تحليلية في هذه الحالة لم يكن بالمستوى المطلوب مما يخلق نوعاً من عدم الرضا لدى الإداريين اتجاه عالم البيانات القائم بالعمل
لذا يوجه بعض المتخصصين إرشادات مفيدة لعماء البيانات المبتدئين تساعدهم على تجنب الوقوع في مثل هذه المآزق كأن يأخذ عالِم البيانات المبتدئ بعين الاعتبار البيئة المناسبة لمستواه الفني كالبحث عن الشركات التي توازي المهارات التي وصل إليها إلى أن يطور مهاراته بالممارسة المستمرة على اعتبار أنه لم يعتاد بعد على مواجهة جميع التحديات والمشاكل التي تتطلب الكفاءة العالية والسرعة في معالجتها
كما ويُنصَح عالِم البيانات المبتدئ بعدم التورط في التقدم لشركات لا تضع التعلم الآلي ضمن أهم استراتيجياتها الأساسية في تعاملاتها وتحليلاتها لأن ذلك سيؤثر سلباً على تطور الخبرة والمهارة لدى عالِم البيانات الذي يطمح بكل تأكيد إلى الوصول إلى الكفاءة التي تمكنه من الحصول على وظيفة أفضل
2. الشخص المناسب في المكان المناسب :
يجب أن يأخذ صناع القرار في مسألة التوظيف انطباعاً إيجابياً عنك عند تقدمك لوظيفة في شركتهم فهذا يزيد فرصك في الحصول على أولوية في القبول , وهذا الانطباع يتشكل لديهم عند اكتشافهم لمهاراتك التي يحتاجونها فعلاً من خلال عرض المشاريع التي قمت بها ولاسيما أسلوبك في معالجة مشكلة حياتية تعترض فئة معينة من الناس فالانطباع الذي سيكونه عنك سيحدد بالنسبة لهم مدى احتياجهم لخدماتك في شركتهم ومدى توافق هذه المهارات مع السياسة العامة للشركة وهذا سيكون له دور كبير في اختيار موفق لكلا الطرفين تطبيقاً للقاعدة القائلة ” الشخص المناسب في المكان المناسب “
Advertisements
3. أنت عالِم بيانات قادر على التعامل مع جميع أنواع البيانات :
بالنسبة لمسؤولي التوظيف والقائمين على الاختبار والمقابلة أنت عالِم بيانات وبالتي فمن وجهة نظرهم أنك قادر على التعامل مع كافة أنواع البيانات بما فيها قواعد البيانات ولاسيما تجهيز النشرات التحليلية وإعداد التقارير المناسبة
حتى زملاؤك في العمل سيفترضون أنك قادر على التعامل مع جميع أدوات تحليل البيانات والبيانات الضخمة وكل ما له صلة بالتعلم الآلي والذكاء الاصطناعي
لذا عندما تقوم شركة ما بتعيينك فأنت قطعاً بنظرهم خبير في كل هذه الأمور لذا كن واضحاً منذ البداية وأعلمهم بمهاراتك التي تقنها جيداً من جهة وبمعلوماتك التي باعتقادك أنك بحاجة إلى صقلها وتطويرها , وتجنباً لحصول خلل في ما هو مأمول منك أن تقدمه في عملك وبين ما قد يفاجؤون به من ضعف في بعض المهارات التي جئتهم بها تلجأ بعض الشركات إلى وضع مواصفات معينة للمتقدمين تسهل على مسؤولي التوظيف اختيار من يرون في أنفسهم أنهم يحققون هذه الشروط ويمتلكون الكفاءة في أن يكونوا أعضاء فاعلين ضمن كادر خبير ومتميز في علم البيانات
4. العمل المتكامل بين أعضاء الفريق :
عندما يستند العمل على تبادل الخبرات والتعاون المشترك بين جميع الاختصاص فإنك ترى دون شك نتائج مُرضية وتستطيع أن تلمس بوضوح الاحترافية في البيئة العامة للعمل ككل وبالتالي ستنعكس بشكل إيجابي على المستخدمين بحيث توفر لهم الفائدة والأريحية في التعامل معها
فمثلاً عالِم البيانات الخبير في تقنيات التعلم الآلي يعتبر جزء من منظومة عمل متكاملة قادرة على استغلال الوقت والجهد بالشكل الأمثل والعكس صحيح فالعمل المنفرد لاختصاص معين بمعزل عن فريق متكامل متنوع الخبرات سيكلف الوقت والجهد الكبيرين ما يؤثر سلباً على سير العمل
ومع ذلك تلجأ بعض الشركات إلى استعمال موظفيها لإنشاء مشاريع خاصة بها بعيداً عن التركيز على التنوع في الخبرات فيمكن لأي موظف كتابة العديد من الكودات البرمجية التي تساعد في حل مشكلة معينة أو إجراء مخططات تحليلية وإن استهلك ذلك الكثير من الوقت فهذا غير مهم بالنسبة لهم , ولكن على العكس تماماً بالنسبة للشركات الكبيرة فعامل الوقت مهم جداً لذا تستعين بفرق متكاملة لإنجاز مهام معقدة فهي في سباق دائم مع الزمن لذا فتنوع الاختصاصات مهم جداً بالنسبة لها
وتطبيقاً لما ذُكر آنفاً يمثل اختيارك الصائب لنوع الشركة التي تبحث عن وظيفة فيها ركيزة أساسية ومهمة في مدى تكيفك مع البيئة العامة في تلك الشركة إذا أن خبرتك في مجال معين في شركة تعمد على تنوع الخبرات سيجعلك تعمل بأريحية كاملة ضمن اختصاصك أي سيكون عملك متكاملاً مع باقي اختصاصات أعضاء الفريق وبالتالي ستتجنب الوقوع في مصيدة ضغط العمل والإرهاق اللذان سيقودانك في النهاية إلى البحث مجدداً عن وظيفة ملائمة
مما سبق نستنتج أن الاختيار الموفق للوظيفة المناسبة سيسهم بشكل كبير في توفير بيئة عمل ملائمة ومريحة تتيح للموظف أن يوظف مهاراته ويطور خبراته بسلاسة تامة متجنباً شبح البحث والتنقل المتسمرين عن عمل أفضل فالاستقرار النفسي والراحة في العمل على جميع الأصعدة هما مفتاح النجاح والإبداع , فلا تبخل على نفسك وكن حذراً في الاختيار , مع تمنياتنا بالتوفيق
While there is no secret formula to success, many thriving businesses do attempt to follow a few standard best practices to help them stay in the fast lane. Digital marketing is one area that many companies are focusing on because they see the value of concentrating their efforts online.
A consultation with DATA World will ensure that you stay a step ahead with proven data science and mentoring services.
Keeping on top of technology
It’s safe to say businesses can’t succeed without relying on technology to a large degree.
Data visualization is a rising software platform that more and more businesses are using to communicate better.
Keeping the lines of communication open is especially vital in this digital age when more and more people are working remotely.
Focusing on self-improvement
Business owners realize the importance of self-improvement. Hence, the reason why many seasoned entrepreneurs still take it upon themselves to continue upskilling themselves.
Advertisements
A business degree is always useful to have if you want to enhance the skills you already have. Try this to see why an online degree in business can help you push further.
A mentor can help you reach your goals much quicker than you might do on your own.
Networking with the right people can also broaden your horizons.
Staying with the plan
You will most probably have derived a plan right at the beginning of your business venture.
A S.W.O.T analysis can help to identify your strengths as well as your weaknesses, your opportunities, and your threats, so you don’t get caught off guard by anything you weren’t expecting.
Best business practices might seem like a complex formula to follow. Reminding yourself to take that course or a degree can help to enhance your focus on the strategic elements of growing your business even more.
Written by: Lance Cody-Valdez
Advertisements
أفضل ممارسات العمل التي يجب مراعاتها
Advertisements
على الرغم من عدم وجود صيغة سرية للنجاح ، تحاول العديد من الشركات المزدهرة اتباع بعض أفضل الممارسات القياسية لمساعدتهم على البقاء في المسار السريع. التسويق الرقمي هو أحد المجالات التي تركز عليها العديد من الشركات لأنها ترى قيمة تركيز جهودها على الإنترنت
أن تظل متقدمًا بخطوة في خدمات علم البيانات والتوجيه التي أثبتت جدواها
مواكبة التكنولوجيا
من المهم أن ننوه إلى إن الشركات لا يمكنها النجاح دون الاعتماد على التكنولوجيا بدرجة كبيرة
تصور البيانات عبارة عن منصة برمجية متنامية يستخدمها المزيد والمزيد من الشركات للتواصل بشكل أفضل *
تعد ثقافة الشركة القوية أيضًا جانبًا آخر يجب مراعاته عندما يتعلق الأمر ببناء فريق أكثر تزامنًا مع بعضه البعض. يمكن أن تساعد أدوات إدارة المشروع في ذلك
يعد إبقاء خطوط الاتصال مفتوحة أمرًا حيويًا بشكل خاص في هذا العصر الرقمي حيث يعمل المزيد والمزيد من الأشخاص عن بُعد *
Advertisements
التركيز على تطوير الذات
يدرك أصحاب الأعمال أهمية تحسين الذات. ومن ثم ، فإن السبب الذي يجعل العديد من رواد الأعمال المخضرمين لا يزالون يأخذون على عاتقهم مواصلة تطوير مهاراتهم
إن الحصول على درجة علمية مفيد دائمًا إذا كنت ترغب في تعزيز المهارات التي لديك بالفعل جرب هذا لترى لماذا يمكن أن تساعدك شهادة في الأعمال التجارية عبر الإنترنت في المضي قدمًا
يمكن أن يساعدك المرشد في الوصول إلى أهدافك بشكل أسرع بكثير مما قد تفعله بمفردك
يمكن للتواصل مع الأشخاص المناسبين أيضًا توسيع آفاقك
البقاء على الخطة
من المحتمل أن تكون قد اشتقت خطة مباشرة في بداية مشروعك التجاري
يعد الالتزام بالخطة مع الحفاظ على المرونة للتغيير أمرًا حيويًا لأنه لا ينبغي أن تراوح مكانك دون مواكبة التطور السريع
يجب أن تحدد خطة عملك أهداف شركتك
S.W.O.T يمكن أن يساعد تحليل
في تحديد نقاط قوتك بالإضافة إلى نقاط ضعفك ، وفرصك ، وتهديداتك ، حتى لا تتفاجأ بأي شيء لم تكن تتوقعه
خصص وقتًا لمراجعة أدائك لتقيم مستوى النجاح قد تبدو أفضل الممارسات التجارية كصيغة معقدة يجب اتباعها. يمكن أن يساعد تذكير نفسك بأخذ هذه الدورة أو الحصول على درجة علمية في تعزيز تركيزك على العناصر الإستراتيجية لتنمية عملك بشكل أكبر
To define this data set: Netflix is a media and video broadcasting platform that includes a large number of movies and TV shows, and according to statistics, its subscribers exceeded 200 million subscribers in 2021 from all over the world.
In this case, the tabular dataset consists of lists of all the movies and TV shows available on Netflix, plus information about actors, directors, audience ratings, and other information.
Here are some important ideas:
* Content available in different countries
* Choose similar content by matching attributes related to the text
* Finding valuable and interesting content by analyzing the network of actors and directors
* A comparison of the most popular broadcasts in recent years (movies – TV shows) on the Netflix platform.
(real or imaginary): Predicting the imaginary job description:
This dataset includes 18,000 job attributes, of which 800 are fictitious descriptions. The data consists of text and descriptive information about jobs. The dataset can be used to build screening models that detect the fictitious attribute of fictitious jobs.
The dataset can be used to answer the following questions:
* You have to build a screening model based on the characteristics of the text data to determine whether the job description is real or fraudulent.
* Focusing on words and phrases that express description and deception, adjusting and identifying them.
Determine the characteristics of similar jobs.
* You have to perform exploratory data analysis on the data set to find useful values from said data set.
In our example, the datasets are player data represented by their abilities and skills from FIFA 15 to FIFA 22 (“players_22.csv”). This data provides procedures for finding several comparisons for specific players through the eighth version of the FIFA game
The following are available analytical models:
* A comprehensive comparison between Messi and Ronaldo (compared to the statistics of their working lives – changes in skill over time)
* The appropriate liquidity to build a team that competes on the level of the European continent, and at this point the budget does not allow the purchase of distinguished players from the eleven-man squad.
* Analyzing a model for the most efficient n% of players (for example, we deal with the largest percentage of 5% of players) to determine the presence of basic features in the game versions such as speed, agility, and ball control. As a live example, we note that the best 5% of players in FIFA 20 version are faster And agility from the FIFA 15 version, and through this kind of comparisons, we can conclude that with more than 5% of the best players who have obtained high statistics with ball control, this means that the game’s interest in the skill and technical aspect is greater than the interest in the physical aspect.
Specifically, we see that:
* The URL of the excluded players.
* The URL of the uploaded face of the player with the club or national team logo
* Information about the player, such as nationality, the team he plays for, date of birth, salary, and others.
* Statistics of the player’s skills, which are related to attack, defense, goalkeeper skill, and other skills.
* Every player present in FIFA 15 through 22 versions of the game
* More than 100 features
* The position in which the player plays and his mission in the club and the national team
The main success of a bookstore that sells various books lies in the high demand for effective purchases of the right books at the right time. In this context, one of the leading business events in the field of books and libraries organizes a competition to support booksellers that allows them to compete in the market.
So the competition here is to predict the purchase quantities of a clearly defined property portfolio for each site by means of simulated data.
Occupation :
Being competitive requires forecasting purchase quantities for eight addresses for 2418 different locations. To build the model, simulated purchasing data will be available from an additional 2349 locations, with all data referring to a limited time period. possible.
data :
There are two auxiliary files available to solve the problem:
The densely populated areas are more prevalent for supermarkets, and this creates commercial competition among them, which reflects positively on the market movement and contributes to the growth of the economy in general.
In our research today, we will discuss the data set that represents sales of three branches of a supermarket company for a period of ninety days. This group was chosen due to the ease of its predictive data analysis models.
Classification data:
Invoice ID: This is an identification number for the sales invoice
Branch: Super Center branch (out of three branches indicated by symbols A, B and C).
City: the most lively locations
Customer Type: Members classify the type of customers based on membership card users and non-users.
Gender: Specifies the gender of the customer
Production line: It depends on distributing basic components such as food, beverages, tourism, sports, electronic accessories, decorative accessories, fashion, and others
Product price: It is estimated in US dollars
Quantity: It is the number of products that the customer has purchased
Tax: It is a 5% tax fee added to the purchase value
Total Price: The total price including tax
Date: The date of purchase (which is the period between May and July of 2019)
Time: which is the time of purchase (from 9 am to 8 p.m.)
Payment: The payment method used by the customer upon purchase, and it is one of three methods (direct payment – credit card – electronic business archive).
COGS: The value of products sold
Total Margin Ratio: Total Margin Ratio
Total return: the total income
Classification: It is based on the classification of customer levels based on shopping traffic, according to a ratio estimated from 1 to 10
6. Control fraudulent procedures related to credit cards:
The process of controlling fraud in credit card transactions is very important for credit companies, which is to obtain fees from customers for products that they did not purchase
The data set includes transactions that were carried out in two days by credit cards in September of 2013, so that several forged transactions were caught out of thousands of transactions, and thus we find a large percentage of imbalance in this data set, and fraud recorded a rate of 0.172% of the total transactions.
The basic elements, which are the features V1, V2, … V28, were obtained using the PCA transformation, which results in the numeric input variables. However, the features that were not converted are represented by the amount and time, so that the amount represents the amount (transaction cost), and the time represents the seconds spent between one transaction and the other. As for the category attribute, it is variable according to the state of the transaction. In the case of fraud, the category takes a value of 1 and takes a value of zero if the transaction is valid.
7. The 50 most famous fast food chains in America:
It is the food that is sold in a restaurant or shop, and it consists of frozen or pre-cooked foods and is presented in special packages for immediate external orders. It is produced in large quantities, taking into account the speed of presentation and delivery. According to 2018 statistics, the value of fast food production reached hundreds of billions of dollars all over the world. .
The hamburger outlets, as is the case with McDonald’s, are the most common and sought-after in the world, and other fast food outlets that depend on the on-demand assembly of basic ingredients prepared in advance in large quantities.
It can be available in the form of kiosks, mobile cars, or quick service restaurants.
Content :
In our case, this data set is a study of information about the 50 best restaurant chains in America for the year 2021, and we can identify the main points of this data set:
Fast Food Chains – Sales in America in Millions of Dollars – Average Sales Per Unit in Thousands of Dollars – Licensed Stores – Total Number of Units for 2021
The vertical format of the dataset:
• Fast-Food Chains – the name of the fast food chain
• U.S. Systemwide Sales (Millions – U.S Dollars) Systemwide sales are estimated in the millions of dollars
• Average Sales per Unit (Thousands – U.S Dollars)
• Franchised Stores – the number of licensed stores
• Company Stores – the number of company stores
• 2021 Total Units – The number of total units in 2021
• Total Change in Units from 2020 – the number of total changes from the previous year 2020
You will have in your hands the sales data of a number of Wal-Mart stores spread in many regions, so that each store includes several departments, and the task entrusted to you will be to forecast sales related to the department of each store.
In addition, Wal-Mart carries out many promotional campaigns on an ongoing basis, especially the offers that coincide with the major official holidays, and these weeks, including holidays, receive a rating five times higher than the holidays. There is no complete historical data.
csv stores:
This file includes anonymous data for forty-five stores indicating the type and size of the store
train. csv
It is a historical training data file that includes the period between 5/2/2010 to 1/11/2012.
It contains the following fields:
• Store – the store number
• Dept – the department number
• Date – the week
• Weekly_Sales: Sales of a specific department in a particular store
• IsHoliday: Is it a holiday week or not
test. csv
This file differs from train.csv only in that sales must be forecasted for each three departments of the store, date and department in this file, otherwise it is completely identical to the train.csv file
features. csv
This file includes more information, such as the store, department, and the activity of the specified dates, and it contains the following fields:
• Store – the store number
• Date – the week
• Temperature – the average temperature in the area
• Fuel_Price – the price of fuel in the region
• MarkDown1-5 – Anonymous data for marketing write-offs operated by Wal-Mart
• CPI – a value indicating consumer prices
• Unemployment – Unemployment rate
• IsHoliday – Is it a week off or not?
For the break, the four holidays coincide in the following weeks in the data set, noting that not all holidays were included in the data.
For every beginner in data analysis, here are the simple steps for collecting, cleaning, and analyzing data:
In terms of data collection, we wrote a script in the Python language to go through Linkedin, and we collected all the necessary data, and the choice fell on 3 sites: Africa, Canada, and America
Advantages :
* Designation: Job title
Company: The name of the company
* Description: Description of the job and the company
* On site – remotely
* The employee’s workplace
Salary: The salary of the position
* The company’s website
* Standards: Terms of employment such as experience and nature of work
We’ll take reviews of fifty an electronic product from online stores such as Amazon and Best Buy.
Datafiniti includes a data set of revision history, location, classification, and metadata of references. We note that it is a huge data set, so we will learn about the best way to use this data and benefit from it as it should:
The point of benefiting from this data lies in knowing the consumer’s opinion about the process of purchasing the product. For clarification, we define the following points:
* What are the main uses of electronic products?
* Determine the link between ratings and positive reviews.
* How good is the variety of online brands?
What is the function of Datafiniti?
Allows direct access to website data by collecting it from a large number of websites to build common databases for commercial activity, products, and property rights.
تضم عدداً كبيراً من الأفلام والبرامج التلفزيونية ووفق إحصائية فإن المشتركين لديهم تجاوز عددهم 200 مليون مشترك في عام 2021 من جميع أنحاء العالم . تتكون مجموعة البيانات المجدولة في حالتنا هذه قوائم بجميع الأفلام والبرامج التلفزيونية
Netflix المتوفرة على
أضف عليها معلومات عن الممثلين والمخرجين وتقييم الجمهور وغيرها من المعلومات الأخرى
: وفيما يلي بعض الأفكار المهمة
المحتوى المتوفر في بلدان مختلفة *
اختيار محتوى شبيه بواسطة مطابقة السمات المتعلقة بالنص *
إيجاد محتوى قيِّم وممتع من خلال تحليل شبكة الممثلين والمخرجين *
إجراء مقارنة على البث الأكثر شيوعاً في السنوات الأخيرة ( أفلام – البرامج التلفزيونية ) *
تضم مجموعة البيانات هذه 18 ألف سمة وظيفية منها 800 وصف وهمي , تتألف البيانات من نصوص ومعلومات وصفية عن الوظائف , ومن الممكن استخدام مجموعة البيانات لبناء نماذج فرز تكشف السمة المزيفة للوظائف الوهمية
يمكن استخدام مجموعة البيانات للإجابة عن الأسئلة التالية
عليك بناء نموذج فرز يعتمد على خصائص البيانات النصية لتحديد ماهية الوصف الوظيفي حقيقي كان أم احتيالي*
التركيز على الكلمات والعبارات التي تعبر عن وصف وخادع وضبطها والتعرف عليها *
تحديد خصائص الوظائف المتماثلة *
عليك القيام بإجراء تحليل البيانات الاستكشافية على مجموعة البيانات لمعرفة القيم المفيدة من مجموعة البيانات المذكورة *
تشكل مجموعات البيانات في مثالنا هذا بيانات اللاعبين ممثلة بقدراتهم ومهاراتهم من إصدار
FIFA 22 إلى FIFA 15
(“players_22.csv”)
بحيث تتيح هذه البيانات إجراءات إيجاد عدة مقارنات للاعبين معينين وذلك من خلال الإصدار الثامن
FIFA من لعبة
مقارنة شاملة بين ميسي ورونالدو ( مقارنة بإحصائيات حياتهم العملية – المتغيرات في المهارة مع مرور الزمن ) *
* السيولة المناسبة لبناء فريق ينافس على مستوى القارة الأوروبية وعند هذه النقطة لا تتيح الميزانية شراء لاعبين متميزين من تشكيلة الفريق المؤلف من أحد عشر لاعباً .
n٪ تحليل نموذج لأكفأ *
من اللاعبين ( كأن نتناول أكبر نسبة حاصلة على 5% من اللاعبين ) لتحديد وجود الميزات الأساسية في إصدارات اللعبة كالسرعة وخفة الحركة والتحكم بالكرة وبمثال حي على ذلك نلاحظ أن أفضل 5% من اللاعبين الموجودين
FIFA 20 في إصدار
أكثر سرعة وخفة في الحركة
FIFA 15من إصدار
ومن خلال هذا النوع من المقارنات يمكننا استنتاج أنه بوجود أكثر من 5% من أفضل اللاعبين الذين نالوا إحصائيات مرتفعة بالتحكم بالكرة هذا يعني أن اهتمام اللعبة بالجانب المهاري والتقني أكبر من الاهتمام بالجانب البدني وعلى وجه التحديد نرى أن
للاعبين المستبعدين URL عنوان *
لملامح الوجه URL عنوان *
المحملة للاعب مع الشعار الخاص بالنادي أو المنتخب
المعلومات الخاصة باللاعب مثل الجنسية , الفريق الذي يلعب له , تاريخ التولد , الراتب وغيرها *
الإحصائيات الخاصة بمهارات اللاعب والتي تتعلق بالهجوم والدفاع ومهارة حارس المرمى وغيرها من المهارات الأخرى *
كل لاعب موجود في إصدارات *
من الإصدار 15 حتى 22 FIFA لعبة
ميزات كثيرة تفوق الـ 100 *
المركز الذي يلعب به اللاعب ومهمته في النادي والمنتخب *
يكمن النجاح الرئيسي لمكتبة تبيع الكتب المتنوعة في الإقبال الكبير على عمليات الشراء الفعالة للكتب المناسبة في الوقت المناسب وفي هذا السياق تقوم إحدى الفعاليات التجارية الرائدة في مجال الكتب والمكتبات بتنظيم مسابقة لدعم بائعي الكتب تتيح لهم المنافسة في السوق
لذا المنافسة هنا تتمثل بالتنبؤ بكميات الشراء لمحفظة ملكية معينة بوضوح لكل موقع بواسطة بيانات محاكاة
: الوظيفة
خوض غمار المنافسة يتطلب التنبؤ بكميات الشراء لثمانية عناوين لـ 2418 موقعاً متنوعاً , ولبناء النموذج سيتم إتاحة بيانات الشراء المحاكاة من 2349 موقعاً إضافياً مع إشارة جميع البيانات إلى فترة زمنية محدودة , والغاية هي تقدير كميات الشراء لهذه العناوين الثمانية المتنوعة للمواقع المقدر عددها بـ 2418 بأعلى دقة ممكنة
تُعدُّ المناطق المكتظة بالسكان أكثر انتشاراً لمحلات السوبر ماركت وهذا يخلق فيما بينها تنافساً تجارياً ينعكس إيجاباً على حركة السوق ويساهم في نمو الاقتصاد إجمالاً
وسنتناول في بحثنا اليوم مجموعة البيانات التي تمثل مبيعات لثلاثة فروع تابعة لشركة سوبر ماركت لمدة تسعين يوماً وقد اختيرت هذه المجموعة نظراً لسهولة نماذج تحليل البيانات التنبؤية الخاصة بها
:البيانات الخاصة بالتصنيف
معرِّف الفاتورة : وهو عبارة عن رقم تعريفي لفاتورة المبيعات
الفرع : فرع السوبر سنتر ( من أصل ثلاث فروع تم الإشارة إليها
( C و B و A بالرموز
المدينة : المواقع الأكثر حيوية
نوع العميل : يصنف الأعضاء نوع العملاء على أساس المستخدمين لبطاقة العضوية وغير المستخدمين لها
الجنس : يحدد جنس العميل
خط الإنتاج : يعتمد على توزيع المكونات الأساسية كالأطعمة والمشروبات والسياحة والرياضة والإكسسوارات الإلكترونية وإكسسوارات الزينة والأزياء .. وغيرها
سعر المنتج : ويقدر بالدولار الأمريكي
الكمية : وهي عدد المنتجات التي قام العميل بشرائها
الضريبة : وهي رسوم ضريبية تقدر بقيمة 5 % تضاف لقيمة الشراء
السعر الإجمالي : المجموع الكلي للسعر بما فيه الضريبة
التاريخ : تاريخ الشراء ( وهي الفترة المحصورة بين مايو ويوليو من عام 2019 )
الوقت : وهو وقت الشراء ( من 9 صباحاً إلى 8 مساءً )
الدفع : طريقة الدفع التي يستخدمها العميل عند الشراء وهي واحدة من ثلاثة طرق ( دفع مباشر – وبطاقة ائتمان – أرشيف أعمال إلكتروني )
قيمة المنتجات المباعة : COGS
نسبة الهامش الكلّي : نسبة الهامش الكلي
المردود الكلي : الدخل الإجمالي
التصنيف : يعتمد على تصنيف مستويات العملاء بناء على حركة التسوق وفق نسبة تقدر من 1 إلى 10
6. ضبط الإجراءات الاحتيالية الخاصة ببطاقات الائتمان :
تعتبر عملية ضبط عمليات التزوير في معاملات بطاقات الائتمان من الأمور بالغة الأهمية لشركات الائتمان والمتمثلة بالحصول على رسوم من العملاء مقابل منتجات لم يقوموا بشرائها
تضم مجموعة البيانات معاملات نُفِّذَت في يومين بواسطة بطاقات الائتمان في أيلول من عام 2013 بحيث ضُبِطَت عدة معاملات مزورة من أصل آلاف المعاملات , وبهذا نجد نسبة كبيرة من عدم التوازن في مجموعة البيانات هذه , وسجلت عمليات التزوير نسبة 0.172٪ من أصل إجمالي المعاملات
تم الحصول على العناصر الأساسية
V1 ، V2 ، … V28 وهي الميزات
PCA باستخدام تحويل
الذي ينتج عنه متغيرات الإدخال الرقمية , إلا أن السمات التي لم يتم تحويلها تتمثل بالمبلغ والوقت بحيث يمثل المبلغ ( كلفة المعاملة ) , والوقت يمثل الثواني المستهلكة بين المعاملة والأخرى , أما سمة الفئة فهي متغيرة وفقاً للحالة التي عليها المعاملة ففي حالة الاحتيال تأخذ الفئة قيمة 1 وتأخذ قيمة صفر في حال كانت المعاملة سليمة
7. أشهر 50 سلسلة مطاعم للوجبات السريعة في أمريكا :
هو الطعام الذي يباع في مطعم أو متجر وهو مؤلف من أطعمة مجمدة أو مطهوة مسبقاً وتُقدم في عبوات خاصة للطلبات الفورية الخارجية ويتم إنتاجها بكميات كبيرة مع مراعاة السرعة في التقديم والتوصيل ووفق إحصائيات عام 2018 وصلت قيمة إنتاج الوجبات السريعة مئات المليارات من الدولارات في جميع أنحاء العالم
وتعتبر منافذ بيع الهامبرغر كما هو الحال عند ماكدونالدز الأكثر شيوعاً وطلباً في العالم وغيرها من الوجبات السريعة الأخرى التي تعتمد على تجميع وفق الطلب للمكونات الأساسية المعدّة مسبقاً بكميات كبيرة
ويمكن أن تتوفر على شكل أكشاك أو سيارات متنقلة أو مطاعم الخدمة السريعة
المحتوى
في حالتنا هذه تعتبر مجموعة البيانات هي دراسة لمعلومات عن أفضل 50 سلسلة مطاعم في أمريكا لعام 2021 , ويمكننا تحديد النقاط الرئيسية لمجموعة البيانات هذه
سلاسل الوجبات السريعة – المبيعات في أمريكا مقدرة بملايين الدولارات – المعدل الوسطي للمبيعات في كل وحدة مقدرة بآلاف الدولارات – المتاجر المرخصة – العدد الكلي للوحدات لعام 2021
: التنسيق العمودي لمجموعة البيانات
Fast-Food Chains – اسم سلسلة الوجبات السريعة
U.S. Systemwide Sales (Millions – U.S Dollars) – المبيعات على مستوى النظام الأمريكي مقدرة بملايين الدولارات
Average Sales per Unit (Thousands – U.S Dollars) – المعدل الوسطي للمبيعات لكل وحدة مقدرة بآلاف الدولارات
Franchised Stores – عدد المتاجر المرخصة
Company Stores – عدد مخازن الشركة
2021 Total Units – عدد الوحدات الإجمالية في عام 2021
Total Change in Units from 2020 – عدد التغيرات الكلية عن العام السابق 2020
سيكون بين يديك بيانات المبيعات الخاصة بعدد من المتاجر التابعة لـوول مارت والمنتشرة في العديد من المناطق بحيث يتضمن كل متجر عدة أقسام وستكون المهمة الموكلة إليك هي التنبؤ بالمبيعات المتعلقة بالقسم الخاص بكل متجر .
كما وأن وول مارت يقوم بالعديد من الحملات الترويجية بشكل مستمر ولاسيما العروض التي تتزامن مع الأعياد الرسمية الكبرى وتنال هذه الأسابيع بما فيها الإجازات تقييم أعلى بخمس مرات من أيام العطلات ويكمن إثبات الكفاءة في خوض هذه التجربة من خلال تحديد نتائج عمليات الشطب في أسابيع العطلات في ظل عدم وجود بيانات تاريخية كاملة .
مخازن csv
يضم هذا الملف بيانات غير معلومة المصدر لخمس وأربعون متجراً تدل على نوع وحجم المتجر
train.csv
وهو ملف بيانات التدريب التاريخية تشمل الفترة بين 5/2/2010 ولغاية 1/11/2012
: وهو يحوي الحقول التالية
Store – the store number
Dept – the department number
Date – the week
Weekly_Sales : مبيعات قسم معين في متجر معين
IsHoliday : هل هو أسبوع عطلة أما لا
test.csv
train.csv هذا الملف يختلف عن
فقط في وجوب التنبؤ بالمبيعات لكل ثلاثة أقسام من المتجر والتاريخ والقسم في هذا الملف , وعدا ذلك هو مطابق
train.csv تماماً لـملف
features.csv
يتضمن هذا الملف المزيد من المعلومات كالمخزن والقسم ونشاط التواريخ المحددة وهو يحوي الحقول التالية
Store – the store number
Date – the week
Temperature – معدل درجة الحرارة في المنطقة
Fuel_Price – ثمن المحروقات في المنطقة
MarkDown1-5 – بيانات غير معلومة المصدر خاصة بإجراءات الشطب التسويقية التي يشغلها وول مارت
CPI – قيمة تدل على أسعار السمتهلك
Unemployment – معدل البطالة
IsHoliday – هل هو أسبوع عطلة أم لا ؟
للاستراحة تصادف العطلات الأربعة في الأسابيع التالية في مجموعة البيانات مع ملاحظة أنه لم تُدرج جميع العطل في البيانات
Super Bowl: 12 فبراير 10 ، 11 فبراير 11 ، 10 فبراير 12 ، 8 فبراير ، 13
Labor Day: 10 سبتمبر – 10 ، 9 سبتمبر – 11 ، 7 سبتمبر – 12 ، 6 سبتمبر – 13
Thanksgiving: 26-نوفمبر -10 ، 25-نوفمبر -11 ، 23-نوفمبر -12 ، 29-نوفمبر -Christmas: 31 ديسمبر 10 ، 30 ديسمبر 11 ، 28 ديسمبر 12 ، 27 ديسمبر 13
لكل مبتدئ في تحليل البيانات إليك الخطوات البسيطة والتي تتمثل في جمع البيانات وتنظيفها وتحليلها أما من ناحية جمع البيانات فقد قمنا بكتابة نص برمجي بلغة بايثون
Linkedin للانتقال عبر
وقمنا بجمع كل البيانات اللازمة ووقع الاختيار على 3 مواقع : إفريقيا وكندا وأمريكا
سنتناول تقييمات لـخمسين منتجاً إلكترونياً من متاجر إلكترونية عبر الإنترنت مثل أمازون وبيست باي
تشمل مجموعة بيانات Datafiniti
تاريخ المراجعة والموقع والتصنيف والبيانات الوصفية للمراجع , نلاحظ أنها مجموعة بيانات ضخمة لذا سنتعرف على الطريقة المثلى لاستخدام هذه البيانات والاستفادة منها كما يجب
يكمن وجه الاستفادة من هذه البيانات في معرفة رأي المستهلك في عملية شراء المنتج وللتوضيح نحدد النقاط التالية
ما هي الاستخدامات الرئيسية للمنتجات الإلكترونية ؟ *
تحديد الصلة بين التقييمات والمراجعات الإيجابية *
ما مدى جودة الماركات التجارية المتنوعة عبر الإنترنت ؟ *
؟ Datafiniti ما وظيفة
يتيح الوصول المباشر إلى بيانات الموقع الإلكتروني وذلك بتجميعها من عدد كبير من المواقع لبناء قواعد بيانات مشتركة للنشاط التجاري والمنتجات وحقوق الملكية
Data analytics provide key insights and information to support your business planning, growth, and operational efficiencies. Marketing campaigns, product development, and customer recruitment and retention are critical business activities that benefit it when customer relationship management (CRM) data analytics are used to understand trends, reveal subtle patterns, and identify new opportunities and leads.
This article illustrates several ways in which successful business operations gain a competitive advantage with a comprehensive CRM data analytics approach.
Baseline CRM Data Analytics
Data on business sales, marketing, and customers are the foundation for your business operations and strategy. Successful use of CRM software appropriate for your business size and type is key to collecting and analyzing these data. Baseline CRM data analytics are descriptive and diagnostic and are developed automatically from a wide range of sales and customer service performance data.
A good place to start is to relate marketing and product inventory statistics to your customer demographics, experience, behavior, preferences, and sentiments. Important presale data inputs include website click compilations, chat summaries, and social media tracking information. Post-sale metrics incorporate customer satisfaction and tracking data, such as additional purchases, spending pattern changes, and customer churn rates.
Needless to say, this data is valued not just by you and your company, but to others operating for nefarious purposes. Cyber criminals pose a huge and continuous risk, and the more data that’s collected online the bigger the risk of sensitive data being hacked and stolen. As important as gathering customer data, you should protect your business from cyberattacks like malware, viruses and worms, ransomware, and man-in-the-middle attacks. Seek out a reputable IT security company that can help plug any holes in your security and monitor your systems 24/7.
Traditional business analytics analyze average sales and market segments, but CRM data analytics go much deeper to reveal subtle patterns, map long-term customer and product value, and create market predictions. Sales reports document product life cycles and predict future profitability and volume. CRM.org explains that customer life cycle data analytics provide insights to improve customer loyalty and impact. Geographic CRM analytics map customer locations, behavior, and experience to make distribution networks and territory management visually dynamic and easier to plan and execute. Baseline CRM data analytics are a proven commodity in servicing, retaining, and understanding existing customers.
If you plan to make upgrades to your CRM system, it may be expensive for a small business. If your business lacks the necessary financial history to qualify for business loans, you may be forced to explore personal loan options. Before doing so, be sure to check your credit report for irregularities. A ding on your credit history that catches you unaware may scuttle your planned upgrades.
Advertisements
Looking to the Future with Business Process Management and Automation Tools
Advanced CRM data analytics really shine in understanding your target audience’s personality, intentions, and likely behaviors. When integrated with automation tools and business process management (BPM), processes across the organization can be implemented to improve and optimize many aspects of BPM, including new process workflows.
By improving the efficiency of CRM processes, BPM can help businesses save time and money while also improving the quality of their customer service. In addition, BPM can help businesses to better understand their customers’ needs and expectations, leading to improved customer satisfaction. If you’re incorporating BPM for managing your digital processes, it’s important to constantly monitor its effectiveness and act on this information to make improvements.
A forward-looking analysis is needed to guide and shape new marketing campaigns, generate customer leads, and acquire new customers. Market segmentation, targeted content, and personalized messaging are all enhanced with knowledge gleaned from your existing customer database and mapped or projected into the future. Predicting customer characteristics and decision-making processes support your strategy for customer engagement and conversion of leads.
Analyze the factors that led to new customer acquisition and study feedback to learn what worked to pull them in. Wharton School of the University of Pennsylvania notes that sophisticated analytics use big data and artificial intelligence tools to understand where the market is heading and predict emerging market segments and new customer profiles.
Get the most out of your existing customer database by using these tools to sift through detailed, fine-grained website cookie tracking and large-scale patterns hidden in consumer behavior databases. Advanced CRM data analytics dashboards integrate diverse sources of information to help you shape marketing campaigns, product development, and product placement efforts. Use a risk management approach to mitigate any reputational and regulatory issues associated with potential algorithm bias and data privacy concerns.
Be sure to have a plan for how your content integrates with your CRM system. You can learn more here about how to create engaging content for your website. A high-quality content strategy can help boost your business’s profile and customer engagement.
Resources and Planning Improve your business strategy and operations using baseline and advanced CRM data analytics. Understand how CRM analytics fits into a larger-scope BPM, as well as the importance of cybersecurity, and use all the different business tools at your disposal. This will help you gain insight and information on future market trends to guide marketing plans, customer retention, and customer recruitment initiatives.
Written by : Cameron Ward
Advertisements
التحليل العميق للبيانات الخاصة بإدارة علاقات العـملاء
Advertisements
توفر تحليلات البيانات رؤى ومعلومات أساسية لدعم تخطيط أعمالك والنمو والكفاءات التشغيلية. تعد الحملات التسويقية ، وتطوير المنتجات ، وتوظيف العملاء والاحتفاظ بهم من الأنشطة التجارية الهامة التي تفيدها عند استخدام تحليلات بيانات إدارة
(CRM) علاقات العملاء
لفهم الاتجاهات ، وكشف الأنماط الدقيقة ، وتحديد الفرص الجديدة والعملاء المتوقعين
توضح هذه المقالة العديد من الطرق التي تكتسب بها العمليات التجارية الناجحة ميزة تنافسية من خلال نهج
CRM تحليل بيانات شامل
:الأساسيةCRMتحليلات بيانات
البيانات المتعلقة بمبيعات الأعمال والتسويق والعملاء هي الأساس لعمليات واستراتيجية عملك
CRM يعد الاستخدام الناجح لبرنامج
المناسب لحجم ونوع عملك هو المفتاح لجمع هذه البيانات وتحليلها
CRM تعد تحليلات بيانات
الأساسية وصفية وتشخيصية ويتم تطويرها تلقائيًا من مجموعة واسعة من بيانات أداء المبيعات وخدمة العملاء
أفضل مكان للبدء هو ربط إحصاءات مخزون المنتجات والتسويق بالتركيبة السكانية للعملاء ، والخبرة ، والسلوك ، والتفضيلات ، والمشاعر. تتضمن مدخلات بيانات ما قبل البيع الهامة مجموعات نقرات موقع الويب وملخصات الدردشة ومعلومات تتبع الوسائط الاجتماعية. تتضمن مقاييس ما بعد البيع رضا العملاء وبيانات التتبع ، مثل عمليات الشراء الإضافية وتغييرات نمط الإنفاق ومعدلات تضاؤل العملاء
ويجدر الذكر بأن هذه البيانات لا تقدر قيمتها أنت وشركتك فحسب ، بل للآخرين الذين يعملون لأغراض شائنة. يشكل مجرمو الإنترنت خطرًا كبيرًا ومستمرًا ، وكلما زادت البيانات التي يتم جمعها عبر الإنترنت ، زادت مخاطر اختراق البيانات الحساسة وسرقتها. على الرغم من أهمية جمع بيانات العملاء ، يجب عليك حماية عملك من الهجمات الإلكترونية مثل البرامج الضارة والفيروسات
man-in-the-middle وبرامج الفدية وهجمات
ابحث عن شركة أمن تكنولوجيا معلومات حسنة السمعة يمكنها المساعدة في سد أي ثغرات في أمنك ومراقبة أنظمتك على مدار الساعة طوال أيام الأسبوع
تحلل تحليلات الأعمال التقليدية متوسط المبيعات وقطاعات السوق
CRM لكن تحليلات بيانات
تتعمق أكثر لتكشف عن أنماط دقيقة ، وتعيين قيمة العملاء والمنتج على المدى الطويل ، وإنشاء توقعات السوق. توثق تقارير المبيعات دورات حياة المنتج وتتنبأ بالربح والحجم في المستقبل
CRM.org يوضح
أن تحليلات بيانات دورة حياة العميل توفر رؤى لتحسين ولاء العملاء وتأثيرهم
CRM تحدد تحليلات
الجغرافية مواقع العملاء وسلوكهم وخبراتهم لجعل شبكات التوزيع وإدارة المناطق ديناميكية بصريًا وأسهل في التخطيط والتنفيذ
CRM تعد تحليلات بيانات
الأساسية سلعة مثبتة في خدمة العملاء الحاليين والاحتفاظ بهم وفهمهم
إذا كنت تخطط لإجراء تحديثات
الخاص بك CRM لنظام
فقد يكون ذلك مكلفًا بالنسبة إلى شركة صغيرة . إذا كان عملك يفتقر إلى أرضية مالية تؤهلك للحصول على قروض تجارية ، فقد تضطر إلى استكشاف خيارات القروض الشخصية. قبل القيام بذلك ، تأكد من مراجعة تقرير الائتمان الخاص بك لمعرفة المخالفات. قد يؤدي الخلل في وضعك الائتماني الذي يجهلك إلى إفساد ترقياتك المخطط لها
Advertisements
:التطلع إلى المستقبل باستخدام أدوات إدارة عمليات الأعمال والأتمتة
CRM تتألق تحليلات بيانات
المتقدمة حقًا في فهم شخصية جمهورك المستهدف ونواياك وسلوكياته المحتملة. عند التكامل مع أدوات الأتمتة
(BPM) وإدارة عمليات الأعمال
يمكن تنفيذ العمليات عبر المؤسسة لتحسين
BPM العديد من جوانب
بما في ذلك عمليات سير عمل العمليات الجديدة
CRM من خلال تحسين كفاءة عمليات
BPM يمكن أن تساعد
الشركات في توفير الوقت والمال مع تحسين جودة خدمة العملاء أيضًا. بالإضافة إلى ذلك ، يمكن أن تساعد الشركات على فهم احتياجات .وتوقعات عملائها بشكل أفضل ، مما يؤدي إلى تحسين رضا العملاء
BPM إذا كنت تقوم بدمج
لإدارة عملياتك الرقمية ، فمن المهم أن تراقب فعاليتها باستمرار وتتصرف بناءً على هذه المعلومات لإجراء تحسينات
هناك حاجة إلى تحليل دقيق لتوجيه حملات التسويق الجديدة وتشكيلها ، وإنشاء عملاء محتملين ، واكتساب عملاء جدد. يتم تحسين تجزئة السوق والمحتوى المستهدف والرسائل الشخصية من خلال المعرفة المستخلصة من قاعدة بيانات العملاء الحالية الخاصة بك وتعيينها أو توقعها في المستقبل. يدعم التنبؤ بسلوك العملاء وعمليات اتخاذ القرار استراتيجيتك لمشاركة العملاء وتحويل العملاء المحتملين
قم بتحليل العوامل التي أدت إلى اكتساب عملاء جدد ودراسة التعليقات لمعرفة ما نجح في جذبهم. تلاحظ مدرسة وارتون بجامعة بنسلفانيا أن التحليلات المتطورة تستخدم البيانات الضخمة وأدوات الذكاء الاصطناعي لفهم توجه السوق والتنبؤ بالأسواق الناشئة شرائح وملفات تعريف العملاء الجديدة
احصل على أقصى استفادة من قاعدة بيانات العملاء الحالية باستخدام هذه الأدوات للتدقيق في تتبع ملفات تعريف ارتباط موقع الويب المفصل والدقيق والأنماط المخفية واسعة النطاق في قواعد بيانات سلوك المستهلك. تعمل لوحات معلومات
CRMتحليلات بيانات
المتقدمة على دمج مصادر متنوعة للمعلومات لمساعدتك في تشكيل حملات التسويق وتطوير المنتجات وإجراءات وضع المنتج. استخدم نهج إدارة المخاطر للتخفيف من أي مشكلات تتعلق بالسمعة والتنظيم مرتبطة بتحيز الخوارزمية المحتمل ومخاوف خصوصية البيانات
تأكد من وجود خطة لكيفية تكامل المحتوى الخاص بك
الخاص بك CRM مع نظام
يمكنك معرفة المزيد هنا حول كيفية إنشاء محتوى جذاب لموقعك على الويب. يمكن أن تساعد استراتيجية المحتوى عالي الجودة في تعزيز الملف الشخصي لنشاطك التجاري ومشاركة العملاء
الموارد والتخطيط
قم بتحسين استراتيجية عملك وعملياتك باستخدام
الأساسية والمتقدمة CRM تحليلات بيانات
CRM افهم كيف تتناسب تحليلات
أوسع نطاقًا BPM مع
بالإضافة إلى أهمية الأمن السيبراني ، واستخدم جميع أدوات الأعمال المختلفة الموجودة تحت تصرفك. سيساعدك هذا على اكتساب نظرة ثاقبة ومعلومات حول اتجاهات السوق المستقبلية لتوجيه خطط التسويق والاحتفاظ بالعملاء ومبادرات توظيف العملاء
Today we will learn to create attractive and valuable bar charts with a simple set of code backed by some experience and technical skill.
There is no doubt that mastering the design of graphic visualizations is an important factor for any data scientist, so in this article we will learn about the most important procedures necessary to complete these designs using Python (Matplotlib & Seaborn).
Dataset:
In our research today, we will discuss a data set that includes information about Pokemons due to the diversity of its characteristics.
They are characterized by continuity (Pokemons are characterized by defense, attack and other combat skills).
It is characterized by a variety of groups (species, name and genes).
And logical (legendary) and thus we have a balance of a variety of models to create charts.
And to get this set of data immediately from the store by the main code related to our search as shown in this table:
Knowing the purpose of the analysis process is the initial stage for designing strong graphic representations by finding solutions to the questions raised about the data available to us.
Our data set can represent answers to many of the questions posed, and what the creation of an excellent chart depends on is finding a solution to the question asked about categorical values such as determining the type of Pokemon:
In our example presented in this research, the most appropriate question to be answered is:
What types of Pokemons have the highest attack values?
To prepare for the answer to this question we will start by preparing the data and creating the first “master” bar chart using Group by and we can plot the data using Seaborn
Observing what resulted in the scheme, it becomes clear to us that the information calls into question the validity of the answer to the question posed above, as it does not show us an accurate answer about the type of the highest attacking Pokemon.
In order to reach an accurate answer, we must adjust the data according to an ascending or descending pattern and determine the number of available items. When we reach the top ten positions, for example, we can exclude random data and make the chart more organized and useful.
With more coordination and organization, we should not neglect the aspect of choosing the most appropriate colors, and this is embodied in selecting only one color. The value of the chart is derived from the appropriateness of the colors, and choosing different colors loses this value. This is done through a few code formats that enable us to add a title, change the font size, and adjust the image size.
We can make use of the color selection feature using Hex code.
Here is an explanation of how to write the code:
Advertisements
We notice that we are beginning to see a more organized result, and here we are about to achieve a more accurate answer by identifying the type of pokemon that is the best attacker, and what increases the graphic representation is more quality, the reset dimensions, in addition to the appropriate title that attracts the attention of the reader.
Despite the quality that we have achieved, it is possible to show a more organized and accurate scheme. This is done by removing redundant information that is useless. In our scheme, we note for each axis a name that indicates it, and it is also shown in the title. So here, repetition is useless.
The direction of the graph also has implications that help the reader to identify the chart before reading the data itself. The prevailing definition is that reading the visualizations from left to right or from top to bottom enables the viewer to know the information that will be read first, and this is called the Z pattern.
Applying this pattern to our chart, we will move the title to the left to be read first and shift the X axis to the top for the same reason.
We have the following codes:
Thus, we have obtained an ordered and understandable graphic representation, and it can be said that we have obtained the required goal by creating an ideal bar chart visualization.
Advertisements
أنشئ المخطط الشريطي الخاص بك للوصول إلى مستوى متقدم بواسطة بايثون
Advertisements
سنتعلم اليوم إنشاء مخططات شريطية جذابة وقيِّمة وبمجموعة بسيطة من التعليمات البرمجية مدعومة ببعض الخبرة والمهارة الفنية
مما لا شك فيه أن إتقان تصميم المخططات البيانية هو عامل مهم لدى أي عالِم بيانات لذا سنتعرف في هذا المقال على أهم الإجراءات اللازمة لإنجاز هذه التصاميم على أكمل وجه
(Matplotlib & Seaborn) باستخدام بايثون
:مجموعة البيانات
في بحثنا اليوم سنتناول مجموعة بيانات تضم معلومات عن البوكيمونات نظراً لتنوع خصائصها
فهي تتصف بالاستمرارية ( فالبوكيمونات تتصف بالدفاع والهجوم وغيرها من المهارات القتالية )
وتتصف بزمر متنوعة ( الأنواع والاسم والجينات )
والمنطقية ( الأسطورية ) وبهذا يصبح لدينا رصيد من نماذج متنوعة لإنشاء المخططات البيانية
وللحصول على مجموعة البيانات هذه بشكل فوري من المخزن بواسطة الكود الرئيسي المتعلق ببحثنا هذا كما هو موضح في هذا الجدول
معرفة الهدف من عملية التحليل هو المرحلة الأولية لتصميم تمثيلات بيانية قوية وذلك عن طريق إيجاد الحلول للأسئلة المطروحة حول البيانات المتاحة لدينا
مجموعة البيانات الموجودة لدينا يمكن أن تمثل إجابات للعديد من الأسئلة المطروحة , وما يعتمد عليه إنشاء مخطط بياني ممتاز هو إيجاد حل للتساؤل المطروح عن قيم فئوية كتحديد نوع البوكيمون
وفي مثالنا المطروح في هذا البحث السؤال الأنسب المراد الإجابة عليه هو
ما هي أصناف البوكيمونات التي تمتلك أعلى قيم من حيث الهجوم ؟ *
“وللتحضير للإجابة عن هذا السؤال سنبدأ بتجهيز البيانات وإنشاء المخطط الشريطي الأول ” الرئيسي
Group by باستخدام
Seaborn ويمكننا رسم البيانات باستخدام
بملاحظة ما نتج عنه المخطط يتضح لنا أن المعلومات وتدعو إلى الشك في صحة الإجابة على السؤال المطروح آنفاً إذ لا تظهر لنا إجابة دقيقة عن نوع البوكيمون الأعلى هجوماً
وللوصل إلى إجابة دقيقة لابد لنا من ضبط البيانات وفق نسق تصاعدي أو تنازلي وتحديد عدد الأصناف المتاحة وعند الوصول إلى تحديد المراكز العشر الأولى مثلاً يصبح بإمكاننا استبعاد البيانات العشوائية وجعل المخطط أكثر تنظيماً وفائدة
وبمزيد من التنسيق والتنظيم لا يجب أن نهمل جانب الاختيار الأنسب للألوان ويتجسد ذلك بتحديد لون واحد فقط فقيمة المخطط مستمدة من مناسبة الألوان واختيار الألوان المختلفة تفقده هذه القيمة وهذا يتم من خلال بضعة أنساق من التعليمات البرمجية تمكننا من إضافة عنوان وتغيير حجم الخط وتعديل قياس الصورة يمكننا الاستفادة من خاصية اختيار الألوان
Hex باستخدام كود
: وفيما يلي توضيح لطريقة كتابة الكود
Advertisements
نلاحظ أننا بدأنا نلمس نتيجة أكثر تنظيماً وها نحن على وشك تحقيق إجابة أكثر دقة بتحديد نوع البوكيمون الأفضل هجوماً , ومما زاد التمثيل البياني أكثر جودة إعادة ضبط الأبعاد إضافة إلى العنوان المناسب الذي يلفت انتباه القارئ
ورغم الجودة التي وصلنا إليها إلا أنه بالإمكان إظهار مخطط أكثر تنظيماً ودقة ويتم ذلك عن طريق إزالة المعلومات المكررة التي لا فائدة منها وفي مخططنا نلاحظ لكل محور اسم يدل عليه وهي موضحة أيضاً في العنوان إذاً هنا التكرار لا فائدة منه كما وأن لاتجاه الرسم البياني مدلولات تعين القارئ على التعرف على المخطط قبل قراءة البيانات نفسها فالتعريف السائد أن قراءة التصورات من اليسار إلى اليمين أو من الأعلى إلى الأسفل يمكن الناظر من معرفة المعلومات التي سيتم قراءتها أولاً
Z وهذا ما يسمى بالنمط
وبتطبيق هذا النمط على مخططنا سنقوم بنقل العنوان إلى اليسار لتتم قراءته أولاً
X وإزاحة المحور
: إلى الأعلى للسبب ذاته فينتح لدينا الرموز التالية
وبهذا نكون قد حصلنا على تمثيل بياني مرتب ومفهوم ويمكن القول أننا حصلنا على الغاية المطلوبة بإنشاء تمثيل بياني شريطي مثالي
There is no work, project, or commercial activity that does not need analysis or statistics, even if it is on a small scale, whether to know the movement of buying and selling, customer interaction, the type of product required, the reasons for profit and loss, and other elements of commercial activity.
However, with the development of commercial activities techniques such as marketing, selling and buying, it became necessary to study the analysis processes of the data that make up the project in more depth and to acquire the necessary experience to conduct advanced statistical operations that yield more accurate and effective results.
Start learning coding and building code:
As a person who does not have any knowledge or experience in the basics of programming that starts from coding and building codes, you must find it difficult to start learning coding, but this thinking is not suitable for those who aspire to be a data scientist, as the determination and insistence on learning coding is an essential pillar in initiating the process This learning, no matter how complicated it may seem at first, and what also contributes to the correct learning of coding is the help of a person who has sufficient experience in programming who directs you to the right path in the learning journey and draws your attention to errors and helps you on how to avoid them, and perhaps the best programming language for a learner to start with is Python They are excellent for data analysis due to their multiple characteristics that can be employed to deal with different types of data
Learn programming:
1. Codecademy platform:
Codecademy platform is the best place to start learning programming and Python will be the best choice to start learning data analysis
The advantage of this platform lies in several points, including that it allows writing code on the browser directly, and this is not easily available in other platforms. That in the event that there is a defect resulting from your writing a software code, then you will know that the error is in the structure of the code itself and not as a result of an error in preparing the program that you need to install on the computer
Also, the smooth sequence and flexible transition between learning stages is very comfortable for beginners and removes some of the fear from learning programming
Interestingly, the courses on this platform are free, of high quality, and are a very good starting point for new learners
Advertisements
Learn to analyze data:
2. Coursera Majored in Data Science from Johns Hopkins :
The free version of the Coursera Data Science specialization provides learners with a free token certificate, but it is not officially accredited, but its importance lies in the moral value that you get as a data science learner, as it will qualify you to show the skills you acquired in the training course in dealing with technical interviews
Since this educational series includes teaching the R language as well, given that it is an excellent language for statistical analysis, and it is the preferred language for academics, however, most analysts prefer the Python language to perform the data analysis process, especially in companies and private and public bodies.
It is clear from the quality of these Python courses that they are directed to the category of software engineers who have a desire to advance to data science, so you find these courses assume that you have high programming skills in advance
What distinguishes Coursera data science is that it starts from the beginning and helps to understand the main principles of the data science mechanism, especially addressing programming in R, and establishes the general concept of master data technology, analysis and machine learning in a broader sense through which you can start completely comfortably with the use of code to analyze data, which gives motivation Larger to complete educational courses.
Learn to query databases:
3. Stanford Online Course
In fact, Data Science Coursera did not include SQL in its training curriculum, so it is advised to go to the Stanford platform to learn SQL on your own via the Internet. This platform is run by professional trainers who use simple explanatory models in a variety of ways.
Learning SQL is very important for data scientists in terms of extracting data from databases, and once you have completed the Stanford SQL course, you can apply for a job in data science
Install information:
4. edx Principles of Data Analysis:
It is important for those who study data science to learn the basic principles of data analysis by edx, and most importantly, to review each learner’s principles and concepts to consolidate and consolidate the information he received in the training courses.
One of the most important elements of correct learning is training at the hands of different trainers, so the learner acquires various skills and becomes able to present wide options in processing and analysis, so it becomes easier when the learner intends to turn to machine learning and advanced statistics.
Applying to a job in data science:
It can be said that having sufficient experience and the required technical skills enhances your chance of passing the final interview and thus obtaining a suitable job in data science. You are the person that the bosses will look for, as the basic requirement for them is a person with capabilities that raise the technical and material level of the company, relying on those experiences that you have gained. In the training courses and in your practical experiences that they will learn about at the interview, and they know full well that your balance of knowledge and experience is a valuable treasure that they will never neglect.
This qualitative transition constitutes an important stage in your scientific and practical life. Here you are now a data scientist that everyone is looking for, so be sure to choose a suitable company that will open new horizons for you full of success and permanent development. In the end, we can conclude from the aforementioned that the difficulties and challenges that will stand in your way during the beginning of the journey of learning programming should not be an obstacle that makes you feel frustrated by several attempts that may fail, but on the contrary, you should invest every bump in searching for solutions that refine your expertise, you will not You will learn only if you make a mistake, and you will not get up unless you fall. Know that if you pass the stage of fear and dread and start to gain the necessary confidence, your motivation will grow and your desire to complete the path that will lead you to the goal you aspire to will increase.
Advertisements
كيف تنتقل من مستوى صفر في البرمجة إلى عالِم بيانات
في 6 أشهر ؟
Advertisements
هناك أربع أدوات يمكنك تعلمها مجاناً
المبادئ الأساسية لتنمية المهارات
لا يوجد عمل أو مشروع أو نشاط تجاري لا يحتاج إلى تحليل أو إحصاء وإن كان على نطاق ضيِّق سواء لمعرفة حركة البيع والشراء وتفاعل الزبائن ونوعية المنتج المطلوب وأسباب الربح والخسارة وغيرها من مقومات النشاط التجاري
ولكن ومع تطور تقنيات الفعاليات التجارية من تسويق وبيع وشراء أصبح لابد من التعمق أكثر في دراسة عمليات التحليل للبيانات المكوِّنة للمشروع واكتساب الخبرة اللازمة لإجراء عمليات الإحصاء المتقدمة التي تعود بنتائج أكثر دقة وفاعلية
البدء في تعلم الترميز وبناء الكودات البرمجية : كشخص لا يملك أي معرفة أو خبرة في أساسيات البرمجة التي تبدأ من الترميز وبناء الكودات لابد وأنك ستجد صعوبة في بدء تعلم الترميز ولكن هذا التفكير لا يناسب من يطمح لأن يكون عالِم بيانات , إذ أن العزيمة والإصرار على تعلم الترميز هي ركن أساسي في الشروع في عملية التعلم هذه مهما بدا الأمر معقداً في البداية , ومما يسهم أيضاً في التعلم الصحيح للترميز هو الاستعانة بشخص يمتلك الخبرة الكافية في البرمجة يوجهك إلى الطريق الصحيح في رحلة التعلم ويلفت نظرك إلى الأخطاء ويساعدك على كيفية تلافيها , ولعل أفضل لغة برمجة يبدأ بها المتعلم هي لغة بايثون فهي ممتازة لتحليل البيانات نظراً لما لها من خصائص متعددة يمكن توظيفها للتعامل مع مختلف أنواع البيانات
تعلم البرمجة
1. Codecademyمنصة
Codecademy تعتبر منصة
المكان الأفضل لبدء تعلم البرمجة وستكون بايثون الخيار الأفضل لبدء تعلم تحليل البيانات
تكمن ميزة هذه المنصة في عدة نقاط منها أنها تتيح كتابة التعليمات البرمجية على المتصفح مباشرة وهذا مالا يتوفر بسهولة في منصات أخرى فعملية تنصيب بيئات البرمجة على جهاز الكمبيوتر تشكل صعوبة لدى بعض المستخدمين لذا فهذه الميزة التي توفرها هذه المنصة تعتبر بداية مثالية مريحة للمبتدئين أضف على ذلك أنه في حال وجود خلل نتج عن كتابتك لكود برمجي فستعلم عندها أن الخطأ في بنية الكود نفسه وليس نتيجة خطأ في إعداد البرنامج الذي تحتاج إلى تنصيبه على الكمبيوتر
كما أن التسلسل السلس والانتقال المرن بين مراحل التعلم يعتبر مريحاً جداً للمبتدئين ويزيل بعض الرهبة من تعلم البرمجة
والمثير للاهتمام أن هذه الدورات في هذه المنصة مجانية وهي ذات جودة عالية وتعتبر نقطة بدء ممتازة جداً للمتعلمين الجدد
Advertisements
:تعلم تحليل البيانات
2. تخصص كورسيرا في علم البيانات
:Johns Hopkinsمن جامعة
تتيح النسخة المجانية من تخصص علم بيانات كورسيرا للمتعلمين شهادة رمزية مجانية ولكنها ليست معتمدة رسمياً إلا أن أهميتها تكمن في القيمة المعنوية التي تحصل عليها كمتعلم لعلم البيانات بحيث ستؤهلك لإظهار المهارات التي اكتسبتها في الدورة التدريبية في التعامل مع المقابلات التقنية
بما أن هذه السلسلة التعليمية يدخل في منهاجها
أيضاً على اعتبار R تعليم لغة
أنها لغة ممتازة للتحليل الإحصائي وهي اللغة المفضلة لدى الأكاديميين إلا أن أغلب المحللين يفضلون لغة بايثون لإجراء عملية تحليل البيانات وخاصة في الشركات والهيئات الخاصة والعامة
يتضح من خلال نوعية هذه الدورات الخاصة ببايثون أنها موجهة لفئة مهندسي البرمجيات الذين لديهم الرغبة في الارتقاء إلى علم البيانات لذا تجد هذه الدورات تفترض أنك تملك مهارات عالية في البرمجة مسبقاً ما يميز علوم بيانات كورسيرا هو أنها تنطلق منذ البداية وتساعد على استيعاب المبادئ الرئيسية لآلية علم البيانات ولاسيما التطرق إلى
R البرمجة في
وترسخ المفهوم العام لتقنية البيانات الرئيسية والتحليل والتعلم الآلي بمعنى أشمل يمكنك من خلالها أن تبدأ بأريحية تامة مع استعمال الكود لتحليل البيانات مما يعطي دافع أكبر لإتمام الدورات التعليمية
:تعلم الاستعلام قواعد البيانات
3. دورة ستانفورد عبر الإنترنت
في الواقع لم يقم تخصص علوم البيانات كورسيرا
ضمن منهجه التدريبي SQL بإدخال
لذا ينصح بالتوجه إلى
ذاتياً SQL لتعلم Stanford منصة
عبر الإنترنت فهذه المنصة يديرها مدربون محترفون يستخدمون نماذج توضيحية بسيطة بأساليب متنوعة
SQL يعتبر تعلم
مهم جداً لعلماء البيانات من جهة استخلاص البيانات من قواعد البيانات , وما إن تنتهي من استكمال
SQL دورة ستانفورد
يمكنك التقدم لوظيفة في علم البيانات
تثبيت المعلومات
4. مبادئ تحليل البيانات edx
من المهم لمن يدرس علم البيانات أن يتعلم المبادئ الأساسية لتحليل البيانات بواسطة edx والأهم مراجعة كل متعلمه من مبادئ ومفاهيم لتثبيت وترسيخ المعلومات التي تلقاها في الدورات التدريبية
ومن أهم مقومات التعلم الصحيح هو التدرب على أيدي مدربين مختلفين فبذلك يكتسب المتعلم مهارات متنوعة فيصبح قادر على طرح خيارات واسعة في المعالجة والتحليل فيصبح الأمر أسهل عندما ينوي المتعلم التوجه إلى التعلم الآلي والإحصاء المتقدم
:التقدم إلى وظيفة في علم البيانات
يمكن القول أن امتلاكك للخبرة الكافية والمهارات التقنية المطلوبة يعزز فرصتك في تجاوز المقابلة النهائية وبالتالي حصولك على وظيفة مناسبة في علم البيانات , أنت الشخص الذي سيبحث عنه رؤساء العمل فالمطلب الأساسي بالنسبة لهم هو شخص يتمتع بقدرات ترفع المستوى الفني والمادي للشركة معتمدين على تلك الخبرات التي اكتسبتها في الدورات التدريبية وفي تجاربك العملية التي سيتعرفون عليها عند المقابلة وهم يعرفون تمام المعرفة أن رصيدك من المعارف والخبرات هو بمثابة كنز ثمين لن يفرطوا به أبداً
هذا الانتقال النوعي يشكل مرحلة هامة في حياتك العلمية والعملية , ها أنت الآن أصبحت عالِم بيانات يبحث عنه الجميع فاحرص على اختيار شركة مناسبة تفتح لك آفاق جديدة مكللة بالنجاح والتطور الدائم
وفي النهاية يمكن أن نستخلص مما ذُكر آنفاً أن الصعوبات والتحديات التي ستعترض طريقك أثناء بداية رحلة تعلم البرمجة لا يجب أن تشكل عائقاً يجعلك تشعر بالإحباط جراء عدة محاولات ربما تبوء بالفشل , بل على العكس يجب أن تستثمر كل عثرة في البحث عن الحلول التي تصقل خبراتك فلن تتعلم إلا إذا أخطأت ولن تنهض إلا إذا سقطت واعلم أنك إذا تجاوز مرحلة الخوف والرهبة وبدأت تكتسب الثقة اللازمة وسينمو عندك الدافع وستزيد الرغبة في إكمال الطريق الذي سيوصلك إلى هدفك الذي ترنو إليه
Today, we will discuss the basic concepts that data analysts rely on while practicing their job in data science, and we will go together to identify the main stages that we will pass through during our research from examples of work in the VBO Bootcamp / Miuul project.
1. Forming an idea of the problem to be addressed:
The most important thing that a data scientist begins to do in addressing any issue related to his professional work is to understand the problem that he must solve, and then understand the benefits that result from that solution to the institution or entity in which he works.
A correct understanding of the type of problem or the nature of the work required helps to determine the most appropriate mechanism to address the problems and thus enhance the experiences gained through experience and practice. In our example, we will see different solutions with two different mechanisms.
The data set used:
The data that we will use in this project includes outputs in order to determine the budget necessary to attract the largest possible number of customers, classify them, and prepare advertising programs according to their requirements. Therefore, we followed the regression method to determine the value of the budget, and we followed the aggregation method to classify customers.
The importance of this strategy lies in our ability to determine the level of production based on our knowledge of the profit rates that we will reach
2- Determine the type of data we deal with
In order to carry out this stage accurately, it requires knowledge of several points:
A. What is the type of correlation between the data in our example?
B. What is the primary origin of this data?
C. Are there any null values in this data?
D. Is there a defect in the data?
E. Is there a specific time for the origin of this data?
F. What are the meanings of the columns in the data set?
And your use of the Kaggle data set will make your identification of the data type more necessary to obtain accurate results.
* It is necessary to familiarize yourself with the instructions of the main source of data, and through this you can determine the outliers and empty records, if any.
* Verifying all variables (categorical, numerical, and numeric) that are primarily related to the data of our project.
* Checking the numerical variables that have been identified to assign outliers, if any.
* Identifying the categories that are frequently present within the data and the categories that are hardly present, by exploring the locations of the categorical variables.
* Analyze the correlation between variables to see their effect on each other, and this procedure helps us to keep the variable with the highest correlation with the dependent variable during selection.
* Formation of a general idea of the characteristics and advantages of each element of the project.
This is a practical application of the compilation that we conducted on the information indicating the relationship between the producer and the consumer in a specific population unit and one of the shops located in that area:
The results show that we have: STORE_SALES=UNIT_SALES*SRP
Under normal circumstances, you cannot understand the meaning of this concept, so you will have to search on Google to make sure that the assembly is correct.
3- Data Preprocessing
In our example, it is clear to us through the chart that there were no outliers or null records in the data, but we removed a duplicate column that was detected in the table.
Through our expectation of the correlation, it became clear to us that the information is strongly related to each other:
Grossy_sqft x Meat_sqft → Negative High Correlation
Store_sales x Store_cost → High positive correlation
Store_sales x SRP → High positive correlation
Gross_weight x Net_weight → High positive correlation
Salad_bar x Prepared_food x Coffee_bar x Video_store x Florist → positive median correlation
Advertisements
4. Data Engineering :
It is essential to understand the problems that the organization you work in faces. You need to create value added from data, create key tool indicators, and other necessary tasks.
The main goal of our project is to determine the budget necessary to obtain clients, and this is necessary in order to estimate an appropriate value for the budget that is supposed to be spent in the future at the lowest possible cost.
We have created a number of new variants with Onehot technology
So first we need to convert the categorical variable values into a numeric value so that we can use them in the algorithms, as shown below:
We have obtained new columns by separating the columns by more than one value with the following operations as in the case of the arguments column.
Here we notice the media channels that are used a lot and that directly affect the cost variable.
Motivational words that attract customers as promotional offers have been added to the column related to the promotion category containing words such as “today” and “weekend” and other words that inform the user of the need to obtain a product during a certain period.
We also notice that the columns passed through Onehot are within columns that have a few different values such as: country, profession.
5. Monotheism:
A necessary study so that no variable affects the data and to obtain effective training within the shortest possible period.
We note that we used the StandardScaler model because our data did not contain an exception.
If the data happens to contain an exception, then the RobustScaler model is recommended
6. Estimation:
Indeed, we can say that we succeeded in estimating each model by varying the different skills of machine learning, and we worked on adjusting the Hyperparameter, and before that we had excluded weakly correlated variables, and the purpose of that was to remove the correlation to obtain training in less time.
7. Compilation:
The second plan that we are working on in our project is to obtain customers and keep them as permanent customers, so we classified customers and worked to estimate the value needed for that
This image shows what is meant:
8- Graphic representation:
Data loses its value if we do not deal with it properly. The basis on which successful analysis is built is the correct description of the data, and the best way to achieve this is to visualize the data.
In our project we made a control panel by Microstrategy
Project elements:
Store sales according to its type and cost: The purpose is to determine the sales value and cost based on the type of store.
Stores location map: This map shows the distribution of stores within the city.
Customer Chart: It is a map that shows the classification of customers by country.
Distribution of customers by brand: Depending on the WORD-CLOUD model, we can count the brands of customers.
The media channel staff and the annual AVG: After doing the marketing offers, we were able to determine the appropriate membership and the audience that earns profits from that membership.
Classification of customers: using the dispersion chart.
Based on the division of the resulting five groups, you are now able to deal with them closely and form appropriate strategies to work according to the plans of the company in which you work
Here are examples of the plans that we have created based on the ratios between spending and financial return:
High cost and high financial return: It is represented in spending large amounts of money in exchange for attracting customers, then what you spent on me will return with abundant profit. By analogy, it is possible to determine the channel that receives the largest possible number of communications and exploit that by saving spending as much as possible.
High cost and low financial return: I spend a large amount of money to attract customers, but the financial return is low. This is due to several reasons, including that customers do not find their need in my store.
Low cost and low financial return: I spend a very small amount to get customers, but I may be the target of a specific audience who prefers a specific type of my products, whose financial returns are low. To follow the best strategy in this case, it is advisable to create a marketing campaign for preferred products based on statistics on the quantity and types of materials required.
Low cost and high financial return: This case embodies the speed of my access to customers in the shortest possible time, which brings me a large financial profit through marketing tours for this type of customer.
Medium cost and low financial return: I spend money to get customers, but the financial return is low. My store does not have enough materials that customers require. This problem can be solved by conducting some statistics to remedy the defect.
Advertisements
معالجة شاملة لمشروع علم البيانات
Advertisements
سنتناول اليوم المفاهيم الأساسية التي يرتكز عليها محللو البيانات أثناء ممارستهم لوظيفتهم فيما يتعلق بعلم البيانات وسنمضي سوياً لنتعرف على المراحل الرئيسية التي سنمر عليها تباعاً أثناء بحثنا هذا من أمثلة
VBO Bootcamp / Miuul عن العمل في مشروع
1. تكوين فكرة عن ماهية المشكلة المطلوب معالجتها :
أهم ما يبدأ به عالِم البيانات في معالجة أي قضية متعلقة بعمله الوظيفي هو فهم المشكلة التي يتوجب عليه حلها ثم فهم ما ينتج عن ذلك الحل من فوائد تعود على المؤسسة أو الكيان الذي يعمل فيه
يساعد الفهم الصحيح لنوع المشكلة أو ماهية العمل المطلوب على تحديد الآلية الأنسب لمعالجة المشاكل وبالتالي تعزيز الخبرات المكتسبة من خلال التجربة والممارسة , وفي مثالنا سنشاهد حلول مختلفة بآليتين مختلفتين
مجموعة البيانات المستخدمة
تتضمن البيانات التي سنستخدمها في هذا المشروع مخرجات من أجل تحديد الميزانية اللازمة لجذب أكبر عدد ممكن من العملاء وتصنيفهم وتجهيز برامج دعائية حسب متطلباتهم , لذا اتبعنا طريقة الانحدار لتحديد قيمة الميزانية واتبعنا أسلوب التجميع لتصنيف العملاء
تكمن أهمية هذه الاستراتيجية قدرتنا على تحديد مستوى الإنتاج بناءً على معرفتنا بنسب الربح التي سنصل إليها
2- تحديد نوع البيانات التي نتعامل معها
:وللقيام بهذه المرحلة بدقة يتطلب ذلك معرفة عدة نقاط
أ. ما نوع الترابط بين البيانات في مثالنا ؟
ب. ما هو المنشأ الأساسي لهذه البيانات ؟
ج. هل يوجد ضمن هذه البيانات قيم فارغة ؟
د. هل يوجد خلل في البيانات ؟
و. هل يوجد زمن محدد لمنشأ هذه البيانات ؟
ز. ما هي مدلولات الأعمدة في مجموعة البيانات ؟
Kaggle واستخدامك لمجموعة بيانات
سيجعل تحديدك لنوع البيانات أكثر ضرورة للحصول على نتائج دقيقة
* من الضروري التعرف على تعليمات المصدر الرئيسي للبيانات ومن خلال ذلك تتمكن من تحديد القيم المتطرفة والسجلات الخالية إن وجدت
التحقق من جميع المتغيرات ( الفئوية والعددية والرقمية ) التي تتعلق بصفة أساسية بالبيانات الخاصة بمشروعنا *
تدقيق المتغيرات العددية التي تم تحديدها لتعيين القيم الشاذة إن وجدت *
تعيين الفئات المتواجدة بكثرة ضمن البينات والفئات التي بالكاد تكون موجودة وذلك استكشاف أماكن تموضع المتغيرات الفئوية *
* تحليل الترابط بين المتغيرات لمعرفة تأثيرها على بعضها البعض , ويفيدنا هذا الإجراء في الاحتفاظ بالمتغير ذو الارتباط الأعلى مع المتغير التابع أثناء الاختيار
* تكوين فكرة عامة عن خصائص وميزات كل عنصر من عناصر المشروع *
وهذا تطبيق عملي على التجميع الذي أجريناه على المعلومات الدالة العلاقة بين المنتج والمستهلك في وحدة سكانية معينة وأحد المحلات التجارية المتواجدة في تلك المنطقة
: تظهر النتائج أنه يوجد لدينا
STORE_SALES=UNIT_SALES*SRP
بالأحوال العادية لا يمكنك إدراك معنى هذا المفهوم لذا ستضطر للبحث
للتأكد من صحة التجميع Google في
3. استكشاف القيم المتطرفة والسجلات الخالية :
في مثالنا يتضح لنا من خلال المخطط أنه لم تكن هناك قيم متطرفة أو سجلات خالية في البيانات ولكن أزلنا عموداً مكرراً تم اكتشافه في الجدول
من خلال توقعنا لعلاقة الارتباط اتضح لنا أن المعلومات مرتبطة بقوة بين بعضها
Grossy_sqft x Meat_sqft → ارتباط عالي سلبي
Store_sales x Store_cost → ارتباط عالي إيجابي
Store_sales x SRP → ارتباط عالي إيجابي
Gross_weight x Net_weight → ارتباط عالي إيجابي
Salad_bar x Prepared_food x Coffee_bar x Video_store x Florist → ارتباط متوسط إيجابي
Advertisements
4. هندسة البيانات :
من الضروري فهم المشاكل التي تواجهها المؤسسة التي تعمل بها فأنت بحاجة إلى إنشاء القيم المضافة من البيانات وإنشاء مؤشرات الأداة الرئيسية وغيرها من المهام الضرورية الأخرى
والغاية الأساسية في مشروعنا هو تحديد الميزانية اللازمة للحصول على العملاء وهذا ضروري من أجل تقدير قيمة مناسبة للميزانية المفترض صرفها في المستقبل بأقل تكلفة ممكنة
قمنا بإنشاء عدد من المتغيرات الجديدة
Onehot عن طريق تقنية
إذاً نحن بحاجة أولاً إلى تحويل القيم المتغيرة الفئوية إلى قيمة عددية لكي نتمكن من استخدامها في الخوارزميات , وذلك كما على النمطالموضح أدناه
لقد حصلنا على أعمدة جديدة عن طريق فصل الأعمدة بأكثر من قيمة مع العمليات التالية كما هو الحال في عمود الوسائط
هنا نلاحظ القنوات الإعلامية التي تُستعمل كثيراً والتي تؤثر تأثيراً مباشراً على متغير التكلفة
تم طرح ألفاظ تحفيزية تجذب الزبائن كعروض ترويجية أضيفت للعمود المرتبط بفئة الترويج تحوي كلمات مثل ” اليوم ” و” عطلة نهاية الأسبوع ” وغيرها من ألفاظ التي تُشعِر المستخدم بضرورة الحصول على منتج ما خلال فترة معينة
Onehot نلاحظ أيضاً أن الأعمدة التي مرت عبر
موجودة ضمن أعمدة حازت على عدد قليل من القيم المختلفة مثل : البلد , المهنة
5. التوحيد :
دراسة ضرورية لكي لا يقوم أي متغير بالتأثير على البيانات وللحصول على تدريب فعال خلال أقصر فترة ممكنة
StandardScaler نلاحظ أننا استخدمنا نموذج
لأن بياناتنا لم تحتوي على استثناء
وإن حدث واحتوت البيانات على استثناء فعندها يوصى
RobustScaler باستخدام نموذج
6. التقدير :
, بالفعل نستطيع القول بأننا نجحنا في تخمين كل نموذج عن طريق تنوع المهارات المختلفة للتعلم الآلي
Hyperparameter وعملنا على ضبط
وقبل ذلك كنا قد استثنينا المتغيرات ضعيفة الترابط , والغاية من ذلك إزالة علاقة الارتباط للحصول على تدريب في وقت أقل
7. التجميع :
الخطة الثانية التي نعمل عليها في مشروعنا هي الحصول على الزبائن والمحافظة عليهم كعملاء دائمين لذا صنفنا العملاء وعملنا على تقدير القيمة اللازمة لذلك
: وهذه الصورة توضح المقصود
8. التمثيل البياني :
تفقد البيانات قيمتها إن لم نكن نحسن التعامل معها كما يجب فالأساس الذي يبنى عليه التحليل الناجح هو الوصف الصحيح للبيانات وأفضل طريقة لتحقيق ذلك هو تصور البيانات
Microstrategy في مشروعنا قمنا بصنع لوحة تحكم بواسطة
:عناصر المشروع
مبيعات المتجر قياساً إلى نوعه وتكلفته : الغاية هي تحديد قيمة المبيعات والتكلفة على أساس نوع المتجر
خريطة تموضع المتاجر : تظهر هذه الخريطة توزع المتاجر ضمن المدينة
مخطط العملاء : عبارة عن خريطة توضح تصنيف العملاء حسب البلد
:توزيع العملاء حسب العلامة التجارية
WORD-CLOUD بالاعتماد على نموذج
يمكننا إحصاء العلامات التجارية الخاصة بالعملاء
كادر القناة الإعلامية و AVG السنوي : بعد قيامنا بالعروض التسويقية استطعنا تحديد العضوية المناسبة والجمهور الذي يكسب أرباح من تلك العضوية
تصنيف العملاء : باستخدام مخطط التشتت
استناداً إلى تقسيم المجموعات الخمسة الناتجة أصبح بمقدورك التعامل معها عن قرب وتكوين استراتيجيات مناسبة للعمل وفق خطط الشركة التي تعمل بها
: إليك نماذج عن الخطط التي أنشأناها مبنية على النسب بين الإنفاق والعائد المادي
تكلفة مرتفعة وعائد مادي مرتفع : تتمثل في إنفاق مبالغ كبيرة من المال مقابل جذب العملاء ثم يعود ما أنفقت علي بالربح الوفير , يمكن قياساً إلى ذلك تحديد القناة التي تستقبل أكبر من عدد ممكن من اتصالات واستغلال ذلك بتوفير الإنفاق أكبر قدر ممكن
تكلفة مرتفعة وعائد مادي منخفض : أقوم بإنفاق مبلغ مالي كبير لجذب العملاء ولكن المردود المادي منخفض , يعود هذا لعدة أسباب منها أن الزبائن لا يجدون حاجتهم في متجري
تكلفة قليلة وعائد مادي منخفض : أقوم بإنفاق مبلغ قليل جداً للحصول على العملاء ولكن قد أكون مقصد لجمهور معين يفضل نوع محدد من منتجاتي عوائدها المادية قليلة ولاتباع أفضل استراتيجية حول هذه الحالة يُنصح بإنشاء حملة تسويقية للمنتجات المفضلة استناداً إلى إحصائيات بمكية وأنواع المواد المطلوبة
تكلفة قليلة وعائد مادي مرتفع : تجسد هذه الحالة سرعة وصولي إلى العملاء بأقل وقت ممكن مما يعود علي بربح مادي كبير عن طريق جولات تسويقية لهذا النوع من العملاء
تكلفة متوسطة وعائد مادي منخفض : أنفق المال للحصول على العملاء ولكن المردود المادي قليل , لا تتوفر في متجري المواد التي يطلبها العملاء بشكل كافي , يمكن حل هذه المشكلة بإجراء بعض الإحصائيات لتدارك الخلل
This program allows you to learn how to work with data over the Internet at a pace that is proportional to the extent to which you interact and understand the information you receive from learning the basics of non-coding skills to data science and machine learning, this program allows you to learn how to work with data online at a pace commensurate with your interaction and understanding of the information you receive.
DataCamp Learning Strategy:
• Complete Learning: You must complete the interactive courses
• Continuous training: Dealing with daily problems continuously
• Practical application: search for the most prominent problems on the ground and work to address them.
• Evaluate yourself: identify your weaknesses and work to rectify them, identify your strengths and strive to develop them.
Advertisements
Here is a simple example of the effective exercises included in the platform:
This is an example of the practical application of your learned skills:
After learning and acquiring sufficient skill, you can start working as follows:
Your professional start will start as a data scientist, then you will move to data analysis. Your mastery of the previous skills will qualify you to enter the world of machine learning, then you will move to data engineering, then work as a statistician and programmer.
Advertisements
ما الذي يجعل منصة
DataCamp
الأفضل لتعلم علوم البيانات في عام 2023 ؟
Advertisements
؟DataCamp ما هو برنامج
يتيح هذا البرنامج تعلم كيفية التعامل مع البيانات عبر الإنترنت بوتيرة تتناسب مع مدى تفاعلك وفهمك للمعلومات التي تتلقاها ابتداءً من تعلم القواعد الأساسية لمهارات عدم الترميز وصولاً إلى علوم البيانات والتعلم الآلي
:DataCampاستراتيجية التعلم في
إتمام التعلم : عليك إتمام الكورسات التفاعلية
التدريب المستمر : التعامل مع المشاكل اليومية بشكل مستمر
التطبيق العملي : البحث عن أبرز المشاكل الموجودة على أرض الواقع والعمل على معالجتها
قيّم نفسك : تعرّف على مواطن الضعف واعمل على تداركها وحدّد على نقاط القوة واحرص على تطويرها
Advertisements
:وهذا نموذج بسيط عن التمارين التفاعلية التي تحتويها المنصة
:وهذا نموذج للتطبيق العملي لمهاراتك التي تعلمتها
:بعد تعلمك واكتسابك للمهارة الكافية أصبح بإمكانك البدء بالعمل على النحو التالي
ستنطلق بدايتك المهنية كعالِم بيانات ثم ستنتقل إلى تحليل البيانات فإتقانك للمهارات السابقة سيؤهلك للدخول إلى عالم التعلم الآلي لتنتقل بعدها إلى هندسة البيانات ثم العمل كإحصائي ومبرمج
Through several studies conducted on a group of beginners looking for a suitable job in data science, it was noted that the majority of them suffer from difficulty even in reaching the interview, despite the fact that the demand for jobs and work in this field is constantly increasing and accelerating, and it is very easy for those who have Experience in data science, and through continuous research, it became possible to identify two main factors to explain the cause of this problem:
* The first problem lies in the weakness of presenting yourself as a specialist in data science.
* The second problem lies in the difficulty of finding you as a data scientist, as according to advanced search systems, new employees are searched according to a mechanism applied by pre-programmed techniques.
Here are three tips that will increase your chances of finding a suitable job in data science:
First tip: Create your own business portfolio:
There is no doubt that the demand for vacancies in data science companies is constantly increasing, and according to a report by one of the employment officials in one of the developing companies, that within one month the company received more than 40 resumes from applicants, this is at the level of a developing company, let alone the giant companies that receive Too many resumes per day?
Based on these statistics, we note that with this number of applicants, the number of those who get a job in a company are those who were distinguished by discrimination over their peers from the applicants. With data science, statistics, programming languages, machine learning and other related sciences.
Second tip: Use appropriate words when describing your experiences:
As we mentioned at the beginning of the article, finding you is related to searches that perform software technologies, and the extent to which these automated technologies can find you as an applicant depends on the type of keywords that you choose in presenting yourself as an applicant. For example, if you are proficient in programming languages such as Python, just by mentioning the name of this language in Your account on Linkedin or in your CV will create a great opportunity to find you, and you will have preference if you mention more than one programming language in business platforms and job applications, and your selection of encouraging or motivational phrases that indicate your level of experience in data science have a role in drawing the attention of recruiters and researchers. For young elements with enthusiasm and vitality.
Advertisements
Third Tip: Demonstrate high competence in problem-solving:
After completing the previous steps, you need to show yourself as a data scientist who is able to deal with all the problems that hinder your work and provide your own methods in dealing with any emergency matter through your projects that you have conducted in presenting a specific problem from the real world and your suggestions for solving that problem in a simplified scientific and practical manner This would prove to your potential manager that you are distinguished and experienced, thus increasing your chances of getting a suitable job.
People view a data scientist differently. People who are not related to data science see him as that super-intelligent person who deals with any scientific issue, no matter how difficult it is. But other data scientists know very well that a data scientist is someone who solves any issue using data. Business, for example, is a data scientist whose task is to employ his experiences that he has learned in order to avoid any kind of loss and to find everything that would increase the profits of the company in which he works through models that he provides
In his field of specialization, he intuitively uses algorithms, programming languages, and all the scientific techniques that he masters, and then presents solutions and suggestions in a way that is easy for the recipient to understand.
But the situation is different when you present your skills to the recruitment officials. Here you are required to mention the numbers and statistics of the solutions and suggestions that you provided in your previous experiences, and know that you are in front of people who are professionals in data science and they will stand on every word you say, as it means to them the true measure of the extent of your experience and skills.
Your expansion in explaining your scientific method in dealing with all kinds of fields of data science and the extent of the interaction of recruiters with what you offer will be a strong indication of your acceptance in the end, as your information will turn in their view into the technical value they are looking for.
In the end, some may find that these tips are not enough to create a real opportunity for the applicant to get the job of his dreams, but in fact, adhere to it and implement its content, whether by presenting a typical business portfolio and choosing expressive keywords that indicate your skills, which will have a major role in your joining a distinguished work team in Data science.
Advertisements
ثلاث نصائح تمكنك من الحصول على وظيفة مناسبة في علم البيانات
Advertisements
ما هي معوقات العثور على وظيفة مناسبة ؟
من خلال عدة دراسات أجريت على فئة من المبتدئين الباحثين على وظيفة مناسبة في علم البيانات لوحظ أن الأغلبية منهم يعانون من صعوبة حتى في الوصول إلى المقابلة على الرغم من أن الإقبال على الوظائف والعمل في هذا المجال في تزايد وتسارع مستمرين وهو أمر بالغ السهولة بالنسبة للذين يملكون الخبرة في علم البيانات ومن خلال البحث المستمر أصبح في الإمكان تحديد عاملين رئيسيين لتوضيح سبب هذه المشكلة
تكمن المشكلة الأولى في ضعف طرحك لنفسك كمتخصص في علم البيانات
* أما المشكلة الثانية تكمن في صعوبة إيجادك كعالم بيانات حيث أنه وفق أنظمة البحث المتطورة يتم البحث عن موظفين جدد وفق آلية تطبق من قبل تقنيات مبرمجة مسبقاً
: سنقدم بين يديك ثلاث نصائح من شأنها أن تزيد فرصك في العثور على وظيفة مناسبة في علم البيانات
:النصيحة الأولى : قم بإنشاء محفظة أعمال خاصة بك
لا شك أن الإقبال على الوظائف الشاغرة في شركات علم البيانات يزداد بشكل مستمر ووفق تقرير لأحد مسؤولو التوظيف في واحدة من الشركات النامية أنه خلال شهر واحد استقبلت الشركة ما يزيد عن 40 سيرة ذاتية من المتقدمين , هذا على مستوى شركة نامية فما بالك بالشركات العملاقة التي تستقبل عدد كبير جداً من السير الذاتية يومياً ؟
استناداً لهذه الإحصائيات نلاحظ أنه مع هذا الكم من المتقدمين فإن عدد اللذين يحظون بوظيفة في إحدى الشركات هم ممن كانوا يتسمون بالتمييز على أقرانهم من المتقدمين , هذا التميز كان أبرز عوامله هو امتلاكهم لمحفظة أعمال قوية تتحدث عن خبرة أصحابها من المتقدمين ولاسيما عن مهاراتهم الفنية في التعامل مع علوم البيانات والإحصاء ولغات البرمجة والتعلم الآلي وغيرها من العلوم ذات الصلة
:النصيحة الثانية : استخدام الكلمات المناسبة في طرحك لخبراتك
كما أسلفنا في بداية المقال فإن العثور عليك مرتبط بعمليات البحث التي تقوم التقنيات البرمجية , ومدى إمكانية عثور تلك التقنيات الآلية عليك كمتقدم مرهون بنوعية الكلمات الرئيسية التي تختارها في طرحك لنفسك كمتقدم فعلى سبيل المثال إن كنت متقناً للغات برمجة مثل بايثون
فمجرد ذكرك لاسم هذه اللغة
Linkedinفي حسابك على
أو في سيرتك الذاتية سيخلق فرصة كبيرة للعثور عليك وستمتلك الأفضلية في حال ذكرك لأكثر من لغة برمجة في منصات الأعمال وطلبات التوظيف , كما وأن انتقائك لعبارات تشجيعية أو تحفيزية تدل على مستوى خبرتك في علم البيانات لها دور في لفت نظر القائمين على التوظيف والباحثين عن عناصر شابة تتحلى بالحماس والحيوية
Advertisements
:النصيحة الثالثة : إثبات الكفاءة العالية في حل المشكلات
بعد إتمام الخطوات السابقة أنت بحاجة إلى إبراز نفسك كعالم بيانات قادر على التعامل مع كافة المشكلات التي تعترض عملك وتقديم أساليب خاصة بك في معالجة أي أمر طارئ من خلال مشاريعك التي أجريتها في طرح مشكلة معينة من العالم الحقيقي واقتراحاتك في حل تلك المشكلة بأسلوب علمي وعملي مبسط , هذا من شأنه أن يثبت لمديرك المحتمل أنك متميز ومتمرس فتزداد فرصك في الحصول على وظيفة مناسبة
تختلف نظرة الناس إلى عالِم البيانات فالأناس الذين ليس لديهم صلة بعلوم البيانات ينظرون إليه على أنه ذلك الشخص فائق الذكاء الذي يتعامل مع أي قضية علمية مهما لغت صعوبتها ولكن يعرف علماء البيانات الآخرون تمام المعرفة أن عالِم البيانات هو شخص يقوم بحل أي قضية باستخدام البيانات ففي مجال الأعمال مثلاً , عالِم البيانات مهمته توظيف خبراته التي تعلمها في تفادي أي نوع من أنواع الخسارة وإيجاد كل ما شأنه أن يزيد أرباح الشركة التي يعمل بها من خلال نماذج يقدمها
ففي مجال تخصصه يقوم بشكل بديهي باستخدام الخوارزميات ولغات البرمجة وجميع التقنيات العلمية التي يتقنها ثم يقوم بطرح الحلول والاقتراحات بشكل يسهل على المتلقي فهمها أي بمعنى آخر يستطيع كل من ليس له دراية بعلوم البيانات ان يستوعب تلك الحلول المقدمة له
ولكن الوضع يختلف عند طرحك لمهاراتك أمام مسؤولو التوظيف فهنا أنت مطالب بذكر الأرقام والإحصائيات للحلول والاقتراحات التي قدمتها في تجاربك السابقة واعلم أنك أمام أشخاص محترفين في علم البيانات وسيقفون على كل كلمة تتفوه بها فهي تعني لهم المقياس الحقيقي لمدى خبراتك ومهاراتك
توسعك في شرح أسلوبك العلمي في التعامل مع كافة أنواع مجالات علوم البيانات ومدى تفاعل القائمين على التوظيف مع ما تقدمه سيكون مؤشر قوي على قبولك في نهاية المطاف فمعلوماتك ستتحول في نظرهم إلى القيمة الفنية التي يبحثون عنها
وفي النهاية قد يجد البعض أن هذه النصائح غير كافية لأن تخلق فرصة حقيقية أمام المتقدم لينال وظيفة أحلامه لكن في الحقيقة الالتزام بها وتنفيذ مضمونها سواء من تقديم محفظة أعمال نموذجية واختيار كلمات رئيسية معبرة تدل على مهاراتك سيكون لها دوراً رئيسياً في انضمامك إلى فريق عمل متميز في علم البيانات
You must create a file to archive your work and expertise, so that others can see and know your level and skills. This is an important step for you as a data scientist, as it is a means of communication for data scientists, so you have to evaluate your skills, determine your technical level, and embody that in the form of works that you save to highlight them when needed. The strength of your work archive increases your chances of success. Get priority admission in any field you apply for as a beginner in data science
Below, we present the importance of creating a business portfolio that includes several projects, in addition to several tips that will help you as an applicant
The importance of creating this portfolio is highlighted by the fact that the experience factor is very necessary when applying for a job in data science. It can be said that the greater the number of years of experience, the greater the chances of getting a job. The certificate alone is not sufficient if it is not supported by several years of experience.
This experience is gained by following several intensive educational courses from experienced sources in this field. Add after that you have to build your business portfolio based on projects from the ground that you carry out based on what you have learned. This step is very important to get the job you want.
The projects that you will undertake must focus on data science skills and how to deal with data sets in general. You can present your projects for public use on the GithHub platform, and do not forget to write summaries showing your results that you obtained.
Your projects and work will be the focus of attention of other data scientists, and it will be your window through which they see your skills in data science, and it will be your opportunity for recruiters to see your potential
data science projects:
There are many ways to get online to start data science projects for free
Once you learn the rules and principles of statistics related to data science, the subject of creating your own projects will be easier and more flexible, and you will find that your experience has increased significantly.
When you create data science projects, you will notice that you need to learn programming, implement statistical analysis techniques, provide solutions, and build data representations to reach the best results.
Speaking about the importance of data science projects and then establishing a business portfolio, we address the following points:
Practical experience: Your creation of a project in data science will raise the ceiling of your ambitions, as working on it will enhance your confidence in yourself and in showing what you have reached.
Forum of experts and specialists in data science: Here, a very important point emerges, if you can exchange experiences and skills with experts and specialists in this field by being present on several platforms, including kaggle, Stack Overflow, Reddit, which is considered a meeting place for data scientists
Open Source Contributions: If the data scientists in your portfolio find that your projects are expertly designed, they may ask you to make open source contributions.
Training: The projects in your portfolio will likely be valuable material when looking for practical projects to use for training
Secure Job Opportunities: Showcasing outstanding projects in a portfolio of high artistic value. Ignore the factors for your guaranteed getting a good job in data science.
Advertisements
It is necessary to take a comprehensive look at the foundations and rules of learning data science through which you can implement projects that give your portfolio great technical value
Like any other profession, in order to master any profession, you must fully understand all its details, and the same applies to data science. In order to master a specific specialization, you must do your best and invest your time to the fullest extent in research, learning, and how to deal with various types of data.
And through our research on the most important ways through which you can display your business in a distinguished portfolio that indicates your experience, we have found several points:
* The quality of the projects: You are not required to start with difficult and complex projects of a higher level than what you learned as a beginner.
Perhaps one of the most important things you do before starting is defining the project, its objective, and what may benefit the users, using your capabilities and the tools available in your hands. Do not forget that as a beginner, you learn the basic principles and at the beginning of the learning journey. Therefore, embarking on a project with undefined goals will be doomed to failure. In answering the following questions, the main rules are built to properly define the objectives of the project:
Determine the type of problem that you have to address?
What are the benefits of your analyzes?
What kind of skills will you get after this experience?
And always remember that your implementation of projects has no value if you do not have sufficient experience, and in return you will not be able to prove your skills and show your expertise except by implementing projects, as both are complementary to the other. Learn data science
Portfolio of projects and files:
The process of documenting projects is a very important process, as this process will greatly help in giving your projects the status of importance and will be classified in the category of successful projects, and this really depends on the quality of the code in terms of clarity and coherence
In the example below, we show an ideal programming model in the Python language
The quality of your business portfolio indicates the extent of your skill and smooth handling of all technical matters, and this, from the point of view of business managers and potential technical officials, is evidence of the experience that everyone is looking for.
You can also write down your skills in an article in which you explain what you have done while working to facilitate access to it by creating a store that contains your project that you spent a long time completing, with links to the basic ideas and concepts on which the construction of the project that you implemented was based.
So, through the above, we conclude that the factors of coordination and ease are two main factors in the formation of a successful project that forms, along with other projects, a professional work portfolio.
We come to the publishing stage:
One of the most important factors for the success of the publishing process is learning good code writing skills, which includes a proper balance between the codes that you include and the codes that you should avoid. An understanding of the content of educational books for the Python language helps you in this, which programmers are keen to fully master, and with more reading and research, your experience will increase. in coding significantly
The GitHub platform is considered one of the most important platforms suitable for creating a Jupyter environment and presenting your projects in it, as it has the ability to add information and formulas intended for repetition and sharing, and be careful in your work to show others the extent of your experience in simplifying complex concepts
Now we can recommend three steps to creating a professional business portfolio:
You have to be careful when creating your business portfolio to move away from stereotypes, in other words, many data scientists and on many platforms have their own business portfolios, so your uniqueness with a professional business portfolio distinguishes you from others and makes your business a bright spot in a space in which there are many widespread business models that vary between difference similarity
These tips will help you excel in creating your own professional business portfolio:
* Become a member of Kaggle:
Why should you join Kaggle? Simply because it is a huge community that includes data scientists of all categories. Through it, you can exchange experiences and advice with others. You can also find and publish data sets, and you can have the opportunity to participate in skills challenges related to data science, so you gain experience and expand your skills.
It is worth noting that employers are keen to view your profile on the Kaggle platform, and know very well that your opportunity to get a junior job in data science is proportionate to the technical level of your profile.
In addition, it contains great value in machine learning, for free, as well as all the interactions that you can do on the site, in addition to the ability to communicate with those in charge of selecting employees in a smooth and flexible manner.
datasets:
As we previously recommended the implementation of projects that find appropriate solutions to practical problems taken from real life, it should be noted that the Kaggle platform is ideal for learning the mechanism of dealing with this type of problem, by using the realistic data sets provided by this platform, you can create a unique project that pushes you to pursue brilliance and constantly develop your performance
Competitions :
Google and other companies involved organize Kaggle competitions, which usually last for a period of three months, in which huge financial prizes are offered, so seizing this opportunity and participating in these competitions will give an impression of the extent of your skill and efficiency in dealing with problems that hinder the proper functioning of work
Make sure to use GitHub regularly:
GitHub automatically keeps up with your work to keep it visible to your followers, so they can keep up to date with your work and achievements.
The benefit of GitHub is that it stores all the data science libraries and repositories and receives and maintains a huge amount of various software resources.
Your active and continuous presence on GitHub helps a lot to keep you in constant contact with your peers, and therefore cooperation and exchange of experiences remains an open process, especially when you have an effective profile
You can also create a website using GitHub pages and thus allow you to host your blog and portfolio on it for free
Write down what you learned:
Your distinguished style of presenting your analyzes and visualizations will have an important and influential role for the learners, who will form an audience following your articles that seem valuable to them based on what you have learned.
And do not stop here, but it is better to publish your articles with direct links on the Medium and Dev.to platforms
And at the end:
The attractiveness of your portfolio depends on the valuable content it contains, from specialization to effective skills and projects
Then others will be attracted to view your portfolio and this will lead them to consider your content more useful
Advertisements
كيف تنشئ محفظة أعمال خاصة بك في مجال علم البيانات ( دليل المبتدئين )
Advertisements
لابد لك من إنشاء ملف لأرشفة اعمالك وخبراتك كل يطلع الآخرون ويتعرفوا على مستواك ومهاراتك فهذه خطوة مهمة لك كعالم بيانات فهي وسيلة تواصل علماء البيانات , لذلك عليك تقييم مهاراتك وتحديد مستواك الفني وتجسيد ذلك على شكل أعمال تحفظها لإبرازها عند الحاجة , فقوة أرشيف أعمالك يزيد فرصك في الحصول على الأولوية في القبول في أي مجال تتقدم له كمبتدئ فيما يخص علم البيانات
ونقدم فيما يلي أهمية إنشاء محفظة أعمال تضم عدة مشاريع بالإضافة إلى عدة نصائح تساعدك كمتقدم
تبرز أهمية إنشاء هذه المحفظة كون عامل الخبرة ضروري جداً عند التقدم لوظيفة في علم البيانات ويمكن القول بأن كلما زادت عدد سنوات الخبرة كلما ازدادت فرص الحصول على الوظيفة فالشهادة وحدها لا تكفي إن لم تكن مدعومة بعدة سنوات من الخبرة
هذه الخبرة تكتسب من خلال اتباع عدة دورات تعليمية مكثفة من مصادر تتسم بالخبرة في هذا المجال أضف بعد ذلك عليك بناء محفظة أعمالك بناءً على مشاريع من أرض الواقع تقوم بها استناداً إلى ما تعلمته , هذه الخطوة بالغة الأهمية لتحصل على الوظيفة التي ترغب
المشاريع التي ستقوم بها يجب أن تركز على مهارات علوم البيانات وكيفية تعامل مع مجموعات البيانات بشكل عام ويمكنك عرض مشاريعك للاستخدام العام
GithHub في منصة
ولا تنسى كتابة ملخصات تبيِّن فيها نتائجك التي حصلت عليها
مشاريعك وأعمالك ستكون محط أنظار علماء بيانات آخرون وستكون نافذتك التي يرون من خلالها مهاراتك في علم البيانات كما وستكون فرصتك ليرى مسؤولو التوظيف من خلالها ما تتمتع به من إمكانيات
:مشاريع علوم البيانات
وهناك عدة أوجه للحصول على الإنترنت للبدء بمشاريع علم البيانات بشكل مجاني
وبمجرد تعلم قواعد ومبادئ الإحصاء الخاصة بعلوم البيانات سيكون موضوع إنشائك لمشاريعك الخاصة أكثر سهولة ومرونة وستجد خبرتك قد ازدادت بشكل ملموس
وستلاحظ عند إنشائك لمشاريع علم البيانات أنك بحاحة لتعلم البرمجة وتنفيذ تقنيات التحليل الإحصائي وتقديم الحلول وبناء تمثيلات بيانية للبيانات للوصول إلى أفضل النتائج
: وبالحديث عن أهمية مشاريع علم البيانات ثم إنشاء محفظة الأعمال نتطرق إلى النقاط التالية
الخبرة العملية : سيرفع إنشائك لمشروع في علم البيانات من سقف طموحاتك إذا أن العمل به سيعزز ثقتك بنفسك وفي إظهار ما توصلت إليه
ملتقى الخبراء والمتخصصين في علم البيانات : وهنا تبرز نقطة بالغة الأهمية إذا يمكنك تبادل الخبرات والمهارات مع الخبراء والمتخصصين في هذا المجال من خلال التواجد على عدة منصات منها
Stack Overflow , Reddit , kaggle
التي تعتبر ملتقى علماء البيانات
المشاركات مفتوحة المصدر : في حال وجد علماء البيانات في محفظتك أن مشاريعك صُممت بخبرة وكفاءة عالية قد يطلبون منك إجراء مساهمات مفتوحة المصدر
التدريب : على الأرجح ستكون المشاريع المطروحة في محفظتك مادة قيمة عند البحث عن مشاريع عملية تستخدم للتدريب
فرص عمل مؤمنة : إظهارك لمشاريع متميزة في محفظة أعمال ذات قيمة فنية عالية أهمل عوامل حصولك المضمون على وظيفة جيدة في علم البيانات
Advertisements
لابد من إلقاء نظرة شاملة على أسس وقواعد تعلم علوم البيانات التي من خلالها تستطيع تنفيذ مشاريع تضفي على محفظتك قيمة فنية كبيرة
شأنها كشأن أي مهنة أخرى , لكي تتقن أي مهنة يجب عليك أن تحيط بكل تفاصيلها بشكل كامل وكذلك الأمر في علوم البيانات فلكي تتقن اختصاصاً معيناً فعليك أن تبذل قصار جهدك وتستثمر وقتك إلى أبعد الحدود في البحث والتعلم وكيفية التعامل مع مختلف أنواع البيانات
: ومن خلال بحثنا في أهم الطرق التي يمكنك من خلالها عرض أعمالك في محفظة متميزة تدل على خبرتك تَبيَّن لدينا عدة نقاط
* نوعية المشاريع : ليس مطلوباً منك أن تبدأ بمشاريع صعبة ومعقدة ذات مستوى أعلى مما تعلمته كمبتدئ بل يمكنك أن تختار مشاريع بسيطة تنفذها مستعيناً ببعض بأفكار لمشاريع قام بها مبتدؤون آخرون
ولعل من أهم تقوم به قبل البداية هو تحديد المشروع والهدف منه وما قد يعود بالفائدة على المستخدمين مستعيناً بإمكانياتك وبالأدوات المتاحة بين يديك ولا تنسى أنك كمبتدئ أنك تتعلم المبادئ الأساسية وفي بداية رحلة التعلم للاذا فالشروع في تنفيذ مشروع غير محدد الأهداف سيكون محكوم عليه بالفشل . وفي الإجابة على التساؤلات التالية تُبنى القواعد الرئيسية لتحديد أهداف المشروع بشكل سليم
ما نوع المشكلة التي يتوجب عليك معالجتها ؟ *
ما هي أوجه الفائدة من التحليلات التي قمتَ بها ؟ *
ما نوع المهارات التي ستحصل عليها بعد خوض هذه التجربة ؟ *
وتذكر دائماً أن تنفيذك للمشاريع ليس له أي قيمة إن لم تكن تتمتع بالخبرة الكافية وبالمقابل لن تتمكن من إثبات مهاراتك وإظهار خبراتك إلا عن طريق تنفيذ المشاريع فكلاهما مكمِّل للآخر فإن توفرا معاً في عالِم البيانات المبتدئ بالشكل الأمثل , فيمكن القول عندها أنه يسير بالطريق الصحيح في رحلة تعلم علم البيانات
: محفظة المشاريع والملفات *
تعتبر عملية توثيق المشاريع عملية بالغة الأهمية فهذه العملية ستساعد بشكل كبير في إكساب مشاريعك صفة الأهمية وستصنف من فئة المشاريع الناجحة وهذا يتوقف حقيقةً على جودة الكودات البرمجية من ناحية الوضوح والترابط
: وفي المثال أدناه نوضح نموذج برمجي مثالي في لغة بايثون
تدل جودة محفظة أعمالك على مدى مهارتك وتعاملك السلس مع كافة الأمور الفنية وهذا من وجهة نظر مدراء العمل والمسؤولين الفنيين المحتملين هو دليل الخبرة التي يبحث عنها الجميع
كما ويمكنك تدوين المهارات الخاصة بك في مقال تشرح فيه ما قمت بفعله مع العمل على تسهيل الوصول إليه وذلك بإنشاء مخزن يحوي مشروعك الذي أمضيت وقتاً طويلاً في إنجازه , مع وضع روابط للأفكار والمفاهيم الأساسية التي ارتكز عليها بناء المشروع الذي قمت بتنفيذه
إذاً ومن خلال ما سبق نستخلص أن عاملي التنسيق والسهولة هما عاملان رئيسيان في تكوين مشروع ناجح يشكل مع غيره من المشاريع محفظة عمل احترافية
نأتي إلى مرحلة النشر : من أهم عوامل نجاح عملية النشر هو تعلم مهارات كتابة الكودات البرمجية الجيدة والتي تتضمن التوازن السليم بين الكودات التي إدراجها والكودات التي عليك تجنبها , يساعدك على ذلك مفهم محتوى الكتب التعليمية للغة بايثون الذي يحرص المبرمجون على إتقانها بشكل كامل , ومع المزيد من الاطلاع والبحث ستزداد خبرتك في الترميز بشكل ملحوظ
واحدة من أهم GitHub وتعتبر منصة
Jupyter المنصات مناسبة لتشكيل بيئة
وعرض مشاريعك فيها فهي تتمتع بقابلية إضافة المعلومات والصيغ المعدّة للتكرار والمشاركة , واحرص في عملك أن يبيّن للآخرين مدى خبرتك في تبسيط المفاهيم المعقدة
:أصبح الآن بإمكاننا أن نوصي بثلاث خطوات لإنشاء محفظة أعمال احترافية
عليك أن تحرص عند إنشاء محفظة أعمالك أن تبتعد عن النمطية , بمعنى آخر إن الكثير من علماء البيانات وعلى العديد من المنصات يملكون مِحفظات أعمال خاصة بهم فتفردك بمحفظة أعمال احترافية يميزك عن الآخرين ويجعلك من أعمالك نقطة مضيئة في فضاء تكثر فيه نماذج الأعمال المنتشرة والتي تتنوع بين التشابه الاختلاف
: وهذه النصائح ستعينك على التميز في ابتكار محفظة أعمال احترافية خاصة بك
:Kaggleكن عضواً في *
؟ Kaggle لماذا ينبغي عليك أن تنضم إلى
ببساطة لأنه مجتمع ضخم يضم علماء البيانات من جميع الفئات فمن خلاله يمكنك تبادل الخبرات والنصائح مع الآخرين كما ويمكنك إيجاد مجموعات البيانات ونشرها ويمكن أن تتاح لك الفرصة للمشاركة في تحديات المهارات المتعلقة بعلوم البيانات فتكتسب الخبرة وتتوسع مهاراتك والجدير بالذكر أن أصحاب العمل يحرصون على الاطلاع
Kaggle على ملف التعريفي على منصة
واعلم جيداً أن فرصتك للحصول على وظيفة مبتدئ في علم البيانات تتناسب طرادً مع المستوى الفني لملفك الشخصي
علاوةً على أنه يحوي قيمة كبيرة في التعلم الآلي وذلك بشكل مجاني وكذلك جميع التفاعلات التي يمكنك القيام بها على الموقع أضف على ذلك إمكانية التواصل مع القائمين على اختيار الموظفين بشكل سلس ومرن
مجموعات البيانات : كما أوصينا سابقاً بتنفيذ مشاريع تقوم بإيجاد الحلول المناسبة للمشاكل العملية المأخوذة من واقع الحياة
Kaggle وجب التنويه بأن منصة
تعتبر مثالية لتعلم آلية التعامل مع هذا النوع من المشاكل فباستخدام مجموعات البيانات الواقعية التي توفرها هذه المنصة يمكنك إنشاء مشروع مميز يدفعك لمتابعة التألق وتطوير أدائك باستمرار
:مسابقات
وغيرها من الشركات Google تقوم شركة
Kaggle المعنية بتنظيم مسابقات
والتي تستمر عادة لمدة ثلاثة أشهر تُقدَّم فيها جوائز مالية ضخمة , لذا فاقتناصك لهذه الفرصة والمشاركة في هذه المسابقات سيعطي انطباعاً عن مدى ما تتمتع به من مهارة وكفاءة في التعامل مع المشكلات التي تعيق سير العمل بشكل سليم
: بشكل مستمر GitHubاحرص على استخدام
بمواكبة أعمالك GitHub يقوم
بشكل تلقائي ليبقى ظاهراً للمتابعين فيبقوا على اطلاع دائم على أعمالك وإنجازاتك
GitHub تتمثل فائدة
في كونه يخزن جميع مكتبات ومستودعات علوم البيانات ويستقبل ويحفظ كمية هائلة من المصادر البرمجية المتعددة
GitHub تواجدك النشط والمستمر على
يساعد كثيراً على بقائك على اتصال دائم مع أقرانك وبالتالي فالتعاون وتبادل الخبرات يبقى عملية مفتوحة وخاصةً عند امتلاكك لملف تعريفي فعال
كما ويمكنك إنشاء موضع ويب
GitHub باستخدام صفحات
وبالتالي يتيح لك استضافة مدونتك ومحفظة أعمالك عليها مجاناً
: دوّن ما تعلمته
أسلوبك المتميز في تقديم تحليلاتك وتصوراتك البيانية سيكون له دور مهم ومؤثر للمتعلمين الذين سيكوّنون جمهوراً متابعاً لمقالاتك التي تبدو قيِّمة بالنسبة لهم مستنداً إلى ما تعلمته
ولا تتوقف هنا بل من الأفضل أن تنشر مقالاتك بروابط مباشرة على منصات
Medium و Dev.to
:وفي نهاية المطاف
المقدار الذي تعتمد عليه جاذبية محفظة أعمالك هو المحتوى القيّم الذي تضمه من التخصص إلى المهارات والمشاريع الفعالة
عندها سينجذب الآخرون لمشاهدة محفظة أعمالك وسيدفعهم ذلك إلى اعتبار محتواك أكثر فائدة
In this article, we will highlight some of the best graphic visualizations for the year 2022 related to specific events that took place during this year.
1. Most popular websites since 1993:
In this scenario, we see a comparison between the most popular sites since 1993. It is remarkable that Yahoo still maintains advanced positions in the ranking of the most popular sites until the beginning of 2022.
2. The time period for a hacker to set your password for 2022:
It is noticeable in many Internet sites to adopt the principle of assigning a group of various characters and less than numbers, the above visualization shows the period of time consumed by those who try to infiltrate other sites and accounts in hacking your passwords in the current year.
The importance of this type of visualization lies in the fact that its system relies mainly on the distribution of colors indicating the different times spent trying to decipher the password.
3. High prices of basic materials:
It is worth noting that the rise in the general level of prices and the continuous and increasing demand for materials is one of the results of the war between Russia and Ukraine. In the above scenario, we notice the impact of inflation on the prices of basic materials consumed on a daily basis, such as fuel, coffee and wheat.
The concept of this type of graph can be simplified as a measurement of the rates of rise and fall in the level of a group of bar shapes with the change of time in varying proportions.
4- The most famous fast food chains in the world:
In the above visualization, we see the 50 most popular fast food chains, according to the amount of restaurants in America. This classification was based on the size and category of the restaurant. Through visualization, we see that McDonald’s is more popular than other restaurant chains around the world This type of visualization is called an organization chart, and it is intended to distinguish hierarchical data according to a specific classification
5. NATO versus Russia:
One of the most prominent events of this year is the Russian war on Ukraine. Through the graph representing the balance of power between Russia and NATO, you can get acquainted with the real information related to this issue.
This diagram consists of an image made up of a number of illustrations that reach the viewer with the idea presented in the visualization in an attractive and understandable way.
Advertisements
6. The quality of students in educational facilities:
The above visualization shows a comparison between the most and least prevalent types of studies in American colleges. Through what the graphic representation shows, we find that the demand for sciences related to technology, engineering and mathematics increases rapidly compared to the low level of demand for sciences related to arts and history.
7. Most used web browsers over the last 28 years:
The visualization included above shows the most used web browsers over the past 28 years, and the visualization also shows that the Google Chrome browser has the largest proportions of use relative to the rest of the browsers.
This visualization is based on divisions within a circular chart that increases and decreases with the change of time, similar to the strip visualization, but it is distinguished from the strip visualization in distinguishing ratios more accurately, away from absolute numbers.
8. The most spoken languages in the world :
This visualization is characterized by its simplicity, but it is of great value. It is of the bar type that identifies the most used languages in the world.
As shown in the chart, English ranks first in the world, followed by Mandarin and then Hindi.
9. School accidents:
This scenario dealt with statistical rates of some school shooting incidents in many countries during certain periods. The chart shows that the United States recorded the highest percentage of this type of incident compared to the rest of the countries.
10. A further rise in prices and wages:
In addition to the inflation that affects the daily consumed basic materials, wages also have a share of this negative impact. It is well known that with the high level of inflation, the value of the US dollar decreases compared to previous periods.
This perception represents a schematic image that shows the variation in wage growth compared to inflation from several years ago to the present time.
According to the above, we presented models for the best dozens of graphic visualizations of the most important events of the year 2022, which constitute useful models in different forms of graphic planning, depending on classification, sorting, and statistics. You can benefit from them if you decide to perform any type of visualization.
Advertisements
أفضل 10 تصورات بيانية لعام 2022
Advertisements
سنقوم بهذا المقال بتسلط الضوء على بعض أفضل التصورات البيانية للعام 2022 المرتبطة بأحداث معينة جرت خلال هذا العام
1. مواقع الويب الأكثر شيوعاً منذ عام 1993
في هذا التصور نشاهد مقارنة بين المواقع الأكثر شهرةً منذ عام 1993 ومن اللافت أن موقع ياهو ما زال محتفظاً بمراكز متقدمة سلم ترتيب تصنيف المواقع الأكثر شهرة حتى بداية عام 2022
2. الفترة الزمنية التي يستهلكها المتسلل لتعيين كلمة المرور الخاصة بك لعام 2022
من الملاحظ في العديد من مواقع الإنترنت اعتماد مبدأ تعيين مجموعة من الأحرف المتنوعة ومنازل أقل من الأعداد , يبين التصور أعلاه الفترة الزمنية التي يستهلكها من يحاول التسلل إلى المواقع وحسابات الآخرين في اختراق كلمات المرور الخاصة بك في العام الحالي
تبرز أهمية هذا النوع من التصور في كون نظامه يعتمد بشكل أساسي على توزيع الألوان الدالة على اختلاف الأوقات المستهلكة في محاولة فك شيفرة كلمة المرور
3. ارتفاع أسعار المواد الأساسية
الجدير بالذكر أن ارتفاع المستوى العام للأسعار والطلب المستمر والمتزايد على المواد هو أحد نتائج الحرب بين روسيا وأوكرانيا وفي التصور الموضح أعلاه نلاحظ أثر التضخم على أسعار المواد الأساسية المستهلكة بشكل يومي كالمحروقات والبن والقمح
يمكن تبسيط مفهوم هذا النوع من المخططات البيانية بأنه عبارة عن قياس لمعدلات ارتفاع وانخفاض في مستوى مجموعة من أشكال شريطية مع تغير الزمن بنسب متفاوتة
4. سلاسل مطاعم الوجبات السريعة الأشهر في العالم
في التصور المدرج أعلاه نرى أشهر 50 سلسلة مطاعم للوجبات السرعة حسب كمية المطاعم الموجودة في أمريكا وقد اعتمد هذا التصنيف على حجم المطعم وفئته
من خلال التصور نرى أن ماكدونالدز تحظى بالشهرة الأوسع مقارنة مع باقي سلاسل المطاعم المنتشرة حول العالم
هذا النوع من التصورات يسمى مخطط هيكلي الغرض منه تمييز بيانات هرمية وفق تصنيف معين
5. الناتو مقابل روسيا
أحد أبرز أحداث هذا العام الحرب الروسية على أوكرانيا , من خلال الرسم البياني الممثل لميزان القوى بين روسيا والناتو تستطيع التعرف على المعلومات الحقيقة المتعلقة بهذا الموضوع
يتألف هذا الرسم البياني من صورة مكونة من تجميع عدد من الرسوم التوضيحية توصل إلى الناظر الفكرة المطروحة في التصور بشكل جذاب ومفهوم
Advertisements
6. نوعية الدارسين في المنشآت التعليمية
التصور المدرج أعلاه يبين مقارنة بين أنواع الدراسات الأكثر والأقل انتشاراً في الكليات الأمريكية ومن خلال ما يوضحه التمثيل البياني نجد أن العلوم المتعلقة بالتكنولوجيا والهندسة والرياضيات يزيد الإقبال عليها بشكل متسارع مقارنة بانخفاض مستوى الإقبال على العلوم المتعلقة بالفنون والتاريخ
7. متصفحات الويب الأكثر استخداماً عبر الـ 28 عاماً الأخيرة
التصور المدرج أعلاه يوضح أكثر متصفحات الويب الأكثر استخداماً عبر الـ 28 عاماً الفائتة وكما يُظهِر التصور
يستحوذ على النسب الأكبر Google Crome أن متصفح
في الاستخدام نسبة إلى باقي المتصفحات
يعتمد هذا التصور على تقسيمات ضمن مخطط دائري تتزايد وتتناقص مع تغير الزمن على غرار التصور الشريطي ولكنه يتميز عن الشريطي في تمييز النسب بدقة أكثر بعيداً عن الأرقام المطلقة
8. أكثر اللغات استخداماً في العالم
يمتاز هذا التصور ببساطته ولكنه ذو قيمة كبيرة وهو من النوع الشريطي يحدد اللغات الأكثر استخداماً في العالم
كما هو موضح في المخطط تحتل اللغة الإنكليزية المرتبة الأولى في العالم تليها الماندرين ثم الهندية
9. حوادث المدارس
تناول هذا التصور نسب إحصائية لبعض حوادث إطلاق النار في المدارس في العديد من الدول خلال فترات معينة , يوضح المخطط أن الولايات المتحدة سجلت أعلى نسبة في وقوع هذا النوع من الحوادث مقارنة مع باقي البلدان
10. ارتفاع أكثر في الأسعار والأجور
علاوة على تأثر المواد الأساسية المستهلكة يومياً بالتضخم فإن للأجور نصيب أيضاً من هذا التأثر السلبي فمن من المعلوم أن مع ارتفاع مستوى التضخم تنخفض قيمة الدولار الأمريكي مقارنة بالفترات السابقة
يمثل هذا التصور صورة تخطيطية تبين تفاوت نمو الأجور بالمقارنة مع التضخم منذ عدة أعوام إلى وقتنا الراهن
وفق ما ذكر أعلاه قدمنا نماذج لأفضل عشرات تصورات بيانية لأهم أحداث العام 2022 تشكل نماذج مفيدة في أشكال مختلفة للتخطيط البياني اعتماداً على التصنيف والفرز والإحصائيات يمكنك الاستفادة منها في حال قررت إجراء أي نوع من أنواع التصور
It can be said that articles, books, and online courses help you as a beginner in data science to some extent to raise your level, but they do not alone contribute to giving you the experience that professionals have in data science, and you cannot rely on them mainly, as they will not give your resume any official value, but there is More important accredited courses that will make you the focus of attention of employers and contribute to strengthening your chances when applying for any job related to data science. We will talk about them to get to know them closely, to start with them in the following order:
1- IBM Data Science Professional Certificate
It is the typical course for a better start in the journey of learning data science. On the one hand, it is a free course and therefore suitable for those who do not have the money necessary to obtain certificates, and on the other hand, it gives the learner the necessary experience that gives you confidence, since the company offering this certificate is considered strong in this field.
This course is characterized by flexibility in learning if it starts with the trainee from the basics of machine learning and the principles of the Python language from building codes to identifying machine learning algorithms and dealing with them and other important matters in building a solid base of information and all this during a training period not exceeding three months according to experts and then You are exposed to an exam that you must pass to be eligible for this certification.
Advertisements
2- Microsoft Certified: Azure Data Scientist Associate
You may find similarities between this course and the first course, but it takes its importance and value because it is accredited by major technology companies in the world. By studying this course, you will have the opportunity to consolidate and enhance your information that you received in the first course, but at an advanced level compared to the first.
This course provides you with learning how to run your own models from the base of the Azure cloud, and this training enables you to strengthen your skills in managing training costs, which are very important for data science experts, because mastering this skill is necessary in the task of machine learning training, as running a huge network on Your equipment cannot be successfully completed unless you are fully aware of the basics of the right investment for the job.
3- DASCA’s Senior Data Scientist certification
We can now say that after you have passed the previous two certificates, you are facing the most difficult challenge, in front of the stage of proving competence and competence in reaching the level of a professional data scientist. This certificate is provided by the Data Science Authority in the United States, and this alone is enough to make you pay all attention to obtaining it.
A course classified as intended for those who have 4 years of experience in data science, in which you will be trained on training models on the ground. Despite the effort in this learning process, it is worth this suffering because obtaining this certificate will qualify you to apply for the job of professional data scientists that will bring you abundant financial profit.
Although this certificate is not free, it will transfer you to a wide space of comprehensive and advanced knowledge in data science, and given that the work according to it brings you a high wage, as we mentioned above, this is enough to make you make a firm decision to go through this experience.
Conclusion :
Once you complete these courses, you will not need other courses, and make sure that you will be of great interest to business owners looking for employees with experience and high efficiency. Your mastery of these courses and obtaining the above-mentioned certificates will make your chances much stronger than your peers who did not obtain these certificates. Once these are mentioned Certificates in your CV, so know that you are the most prominent candidate for the offspring of a job that many who work in this type of science dream of.
Advertisements
ثلاثة شهادات في علوم البيانات
يجب أن تتقنها بالترتيب
Advertisements
يمكن القول بأن المقالات والكتب والدورات التدريبية عبر الإنترنت تساعدك كمبتدئ في علم البيانات إلى حد ما على رفع مستواك إلا أنها لا تساهم وحدها في إكسابك الخبرة التي يمتلكها المحترفون في علم البيانات ولا يمكنك الاعتماد عليها بشكل أساسي فهي لن تمنح سيرتك الذاتية أي قيمة رسمية بل هناك دورات معتمدة أكثر أهمية من شأنها أن تجعلك محط أنظار رؤساء العمل وتسهم في تقوية حظوظك عند التقديم إلى أي عمل وظيفي متعلق بعلم البيانات سنتناول الحديث عنها للتعرف عليها عن قرب على أن تبدأ بها على الترتيب التالي
1- IBM Data Science Professionalشهادة
وهي الدورة النموذجية لبداية أفضل في رحلة تعلم علوم البيانات , فمن ناحية هي دورة مجانية وبالتالي تناسب من لا يملك المال اللازم للحصول على الشهادات ومن ناحية أخرى تُكسِب المتعلم الخبرة اللازمة التي تمنحك الثقة كون الشركة المقدمة لهذه الشهادة تعتبر قوية في هذا المجال
تمتاز هذه الدورة بمرونة في التعلم إذا تنطلق بالمتدرب من أساسيات التعلم الآلي ومبادئ لغة بايثون من بناء الأكواد إلى التعرف على خوارزميات التعلم الآلي والتعامل معها وغير ذلك من الأمور المهمة في بناء قاعدة متينة من المعلومات وكل ذلك خلال مدة تدريبية لا تتجاوز الثلاثة أشهر حسب خبراء ثم تتعرض لاختبار عليك اجتيازه لتكون مؤهلاً للحصول على هذه الشهادة
Advertisements
2- Azure Data Scientist Associateشهادة معتمدة من مايكروسوفت
قد تجد تشابهاً بين هذه الدورة والدورة الأولى ولكنها تأخذ أهميتها وقيمتها كونها معتمدة من قِبل كبرى شركات التقانة في العالم فبدراسة هذه الدورة ستكون لديك الفرصة في تثبيت وتعزيز معلوماتك التي تلقيتها في الدورة الأولى ولكن على مستوى متقدم مقارنة بالأولى
تؤمن لك هذه الدورة تعلم كيفية تشغيل النماذج الخاصة بك
Azure انطلاقاً من القاعدة الأساسية للسحابة
وهذا التدريب يمكنك من تقوية مهاراتك في إدارة تكاليف التدريب المهمة جداً لخبراء علم البيانات لأن احتراف هذه المهارة أم ضروري في مهمة التدريب على التعلم الآلي إذ أن تشغيل شبكة اتصال ضخمة على أجهزتك لا يمكن أن يتم بنجاح إلا إذا كنت على دراية تامة بأساسيات الاستثمار الصحيح لهذه المهمة
3- DASCAشهادة علماء البيانات المحترفون من
يمكننا القول الآن بأنك بعد اجتيازك للشهادتين السابقتين فأنت أمام التحدي الأكثر صعوبة , أمام مرحلة إثبات الكفاءة والجدارة في الوصول إلى مستوى عالم بيانات محترف , هذه الشهادة مقدمة من هيئة علوم البيانات في الولايات المتحدة وهذا وحده كفيل بأنه يجعلك تولي كل الاهتمام بالحصول عليها
دورة مصنفة أنها معدّة للذين لديهم خبرة 4 سنوات في علم البيانات ستتدرب فيها على نماذج تدريبية على أرض الواقع ورغم العناء في مسيرة التعلم هذه إلا أنها تستحق هذه المعاناة لأن حصولك على هذه الشهادة سيؤهلك للتقدم على وظيفة علماء البيانات المحترفين التي تعود عليك بالربح المادي الوفير
على الرغم من أن هذه الشهادة ليست مجانية إلا أنها ستنقلك إلى فضاء واسع من المعرفة الشاملة والمتطورة في علم البيانات ونظراً لكونها العمل بمقتضاها يعود عليك بأجر مترفع كما أسلفنا فهذا كفيل بأن يجعلك تتخذ قرار حازم في خوض هذه التجربة
: الخلاصة
مجرد إتمامك لتلك الدورات فلن تحتاج إلى دورات أخرى وتأكد بأنك ستكون محط اهتمام كبير لدى أصحاب الأعمال الباحثين عن موظفين من ذوي الخبرة والكفاءة العالية , إتقانك لتلك الدورات وحصولك على الشهادات المذكورة أعلاه سيجعلان حظوظك أقوى بكثير من أقرانك الذين لم يحصلوا على هذه الشهادات وبمجرد ذكر هذه الشهادات في سيرتك الذاتية فاعلم أنك المرشح الأبرز لنسل وظيفة يحلم بها الكثيرين ممن يمتهنون هذا النوع من العلوم
One of the most important things on which the establishment of a successful profitable project depends on the Internet is the set of skills and experiences that you have, and that your personality and your style of work play a contributing role in increasing the chances of the success of your project, contrary to what some think that providing the project with a lot of money is the cornerstone on which the start of the activity is based. commercial.
This is what we will talk about today in this research.. How to build your business without having to pay money by consuming the least possible time and effort.
We will suggest six ideas that will help you start a successful online business:
1. Selling electronic content:
This type of project is of great importance due to its widespread circulation and widespread demand. There are millions of consumers of digital content in all its forms, whether videos, films, audio clips, music or e-books.
Digital content plays the role of a product that is bought and sold by itself, or it can be a commodity sold in addition to the main services provided by some individuals or companies.
Digital content trading is popular with design and innovation pioneers, if the flexibility lies in the fact that production is only one time and then sold repeatedly and the possibility of dealing between the seller and the buyer remotely, but its success depends on your skill in creating eye-catching content and choosing impressive designs, as the electronic market is full of digital content Therefore, being alone in an attractive style is the title of your distinction, which will increase the chances of your competition and your entry into online content creation projects
The importance of digital content is highlighted in several points, the most important of which are:
• High yield: the financial return for digital content producers is a net profit due to the absence of continuous expenses on the produced goods.
• Fruitful future: Due to the rapid development, according to some statistics, which indicate that the value of the digital content market is expected to rise in the coming years, you are in front of great opportunities to develop and grow your brand.
• Convenience: by creating free content production suitable for the development of your personal electronic accounts, including e-mail. You can also earn profits by selling copyrights for your distinguished electronic designs.
• Automation feature: you can deliver your digital content with minimal participation.
All of these features do not prevent some obstacles that may be encountered by digital content producers, including:
• You may find some difficulty in finding the target market because some customers find free samples of your services, and you must be constantly and constantly keen on creating more professional models that contribute to the development of your brand.
• The possibility of being exposed to theft and piracy: you should choose the programs that help you protect your products to avoid falling into these problems.
2. Financial support:
The project creator creates an account on one of the platforms, and the profits resulting from the subscriptions of subscribers to this account are collected during a specific period chosen by the project manager. on the money.
You can also share your project on Facebook after uploading it to your iPhone. By clicking on your project, you can estimate the most appropriate date to launch your campaign and release your product.
It is worth noting that you should not hesitate to exchange interest and appreciation for your project’s supporters by giving them material rewards, for example.
It is necessary in the process of searching for customers to ensure the extent to which your project attracts attention to provide support for it and to conduct an opinion poll for your potential customers about your product or service in order to enhance strengths and avoid weaknesses. Search engines can also be used to find what attracts people and raises their interest, especially developing their needs.
3. Building a virtual educational platform that will bring you financial profit:
What guarantees the creation of a successful work plan with the possibility of maintaining an upward path to develop work according to this plan is to build a distinct educational platform and this depends on the availability of two main pillars:
• Leading personalities who are able to deal with various types of obstacles and difficulties that face the virtual work cadre in this type of platform. Appropriate actions and decisive decisions create a kind of wisdom in solving any kind of problems.
• One of the most obstacles to achieving success in this type of project is to cancel what you have to do today and postpone it to tomorrow. A successful strategy is based mainly on completing the right work at the right time.
The importance of these platforms lies in the fact that a large number of learners resort to them if there is the possibility of individual training.
Among the characteristics of success in managing these platforms by leaders is the availability of several factors:
• Continuity to put forward and present everything that is important and useful
• Effective interaction
• Diversity and modernity to keep up with everything new
• Avoid falling into all kinds of technical and technical faults.
• Skill and flexibility in dealing with others
Advertisements
4. Providing web hosting services:
This service includes the availability of a domain, site hosting and development, and once you have a computer, you can start this project.
This project is considered profitable because securing the website hosting service is the most common requirement at the present time if the demand for it increases significantly. This service is provided through storage, e-mail accounts and databases, in addition to providing a user interface for the owner of the site, and this is done by a company or an individual.
The success of this project depends on the extent of your presence on the Internet, as the increase in the number of audience familiar with your website is a strong indication of the increase in your chances of obtaining clients.
From the above, we refute 5 simple steps to start a hosting business:
1. You must configure your website and specify the values of services and channels.
2. Choosing a brand for web hosting and the target groups by choosing a name for your company that is simple and easy.
3. Develop and expand the line of work related to your hosting.
4. Be absolutely sure to take care of the advertising aspect of the services you provide, with interest in highlighting the offers and features you offer, whether electronic advertising campaigns or publications and paper publications, and start with friends.
Also, paying attention to customers is not less important than what was mentioned in the previous items, by avoiding prevarication with customers in the event that a technical problem occurred with you that led to a defect, and expediting the resolution of any emergency that occurs on any aspect of the financial aspects of customers and dealing with it in a way that comforts the customer.
5. Selling subscription services:
According to a study conducted by specialists in the field of e-commerce, it showed that the growth rate of e-commerce is increasing dramatically and rapidly.
Companies that provide online subscription service to customers give lower costs due to repeated purchases of the required products, which maintains the business relationship between the product and the customer forever.
By mentioning the factors that make you carefully consider the work of subscription, we find that:
• Predictability of material returns.
• Less expenses that you will make to get clients.
• Customers’ keenness to maintain dealings with you.
• Flexibility in selling products.
• Always have money in your hands.
In the event of starting a business based on subscription, the following items must be noted:
• Ensure the constant attention to customers to maintain them.
• Continuous mention of the importance of the product or service you provide.
• Follow a successful plan for the marketing process.
• Trying to find suitable offers.
• Gathering customers who are ready for subscriptions.
• Determine a free trial period.
6. Earn money by following products:
This means that the owners of some brands rely on people who follow up on their commercial products, such as providing suggestions about new products that have not yet been put on the market, in exchange for services that are obtained through:
• money
• merchandise
• Gift vouchers
To start building a project like this, you need to create a blog where you present your services in product review, and you can use the Amazon Mechanical Turk.
If you decide to join their cadre as a reviewer of their products, brand owners will deal with you as a customer. By reading those goods, they learn about the way consumers think, so it is easy for them to improve or develop the appropriate according to your assessment and evaluation.
The basic principle depends on your acceptance of such a job on the test of your eligibility to obtain it through a certain company testing your method in reviewing their product, provided that you are one of the consumers of this product.
According to everything mentioned, our participation in a strong and solid brand does not negate, especially after we have gained experience, that we establish our own business, the success of which determines the extent of our desire and ambition.
Advertisements
أعمال مربحة عبر الإنترنت
يمكنك البدء بها الآن من الصفر
Advertisements
من أهم ما يعتمد عليه إنشاء مشروع ربحي ناجح على الإنترنت هو مجموعة المهارات والخبرات التي تتمتع بها كما وأن لشخصيتك وأسلوبك في طريقة العمل دوراً مساهماً في زيادة فرص نجاح مشروعك على عكس ما يظن البعض أن إمداد المشروع بالمال الكثير هو حجر الأساس التي يرتكز عليه بدء النشاط التجاري
هذا ما سنتحدث عنه اليوم في بحثنا هذا .. كيف تبني نشاطك التجاري دون الحاجة إلى دفع المال وذلك باستهلاك أقل وقت وجهد ممكن
سنقترح ستة أفكار من شأنها مساعدتك على بدء نشاط تجاري ناجح عبر الإنترنت
1. المحتوى الإلكتروني
يتمتع هذا النوع من المشاريع بأهمية كبيرة لكثرة تداوله والطلب عليه واسع الانتشار فهناك الملايين من مستهلكي المحتوى الرقمي بكافة أشكاله سواء مقاطع الفيديو والأفلام أو المقاطع الصوتية والموسيقا أو الكتب الإلكترونية .
يلعَب المحتوى الرقمي دور منتج يباع ويشترى بحد ذاته أو يمكن أن يكون سلعة تباع إضافة إلى الخدمات الرئيسية التي يقدمها بعض الأفراد أو الشركات
تعتبر المتاجرة بالمحتوى الرقمي أمراً محبباً لدى رواد التصميم والابتكار إذا تكمن المرونة في كون الإنتاج لمرة واحدة فقط ثم بيعها بشكل متكرر وإمكانية التعامل بين البائع والشاري عن بعد ولكن نجاحها يعتمد على مهارتك في ابتكار محتوى ملفت للنظر واختيار تصاميم مبهرة إذ أن السوق الالكتروني مليء بالمحتوى الرقمي لذا فالانفراد بأسلوب جذاب هو عنوان تميزك الذي سيزيد من فرص منافستك ودخولك في مشاريع صناعة المحتوى عبر الإنترنت
تبرز أهمية المحتوى الرقمي في عدة نقاط أهمها
مردود عالي : إذ أن العائد المادي لمنتجي المحتوى الرقمي بعود بربح صافي نظراً لعدم وجود مصاريف مستمرة على السلع المنتجة *
*المستقبل المثمر : نظراً للتطور المتسارع وفقاً لبعض الإحصائيات التي تشير إلى توقع ارتفاع قيمة سوق المحتوى الرقمي خلال السنوات القادمة فأنت أمام فرص كبيرة لتطوير وتنمية علامتك التجارية
قابلية الملائمة : عن طريق ابتكار إنتاج محتوى مجاني يلائم تطوير حساباتك الإلكترونية الشخصية بما فيها البريد الإلكتروني , كما ويمكن تحصيل أرباح من خلال بيع حقوق النشر لتصاميمك الإلكترونية المتميزة
ميزة الأتمتة : يمكنك تسليم محتواك الرقمي بأقل قدر ممكن من المشاركة *
: كل هذه الميزات لا تمنع من وجود بعض العقبات التي قد تعترض منتجي المحتوى الرقمي منها
* قد تجد بعض المشقة في العثور على السوق المستهدف نظراً لعثور بعض العملاء على نماذج مجانية من خدماتك كما ويتوجب عليك أن تحرص بشكل دائم ومستمر على ابتكار نماذج أكثر احترافية تسهم في تطوير علامتك التجارية
* إمكانية تعرضك للسرقة والقرصنة : عليك اختيار البرامج التي تساعدك على حماياك منتجاتك لتفادي الوقوع في هذه المشاكل
2. الدعم المادي
يقوم منشئ المشروع بتشكيل حساب على أحد المنصات ويتم تجميع الأرباح الناتجة عن اشتراكات المشتركين في هذا الحساب خلال مدة محددة يختارها مدير المشروع ويتم ذلك بأن تنشئ مشروع ثم تقوم باختيار الوصف المناسب له وإنشاء مقطع فيديو ثم تحميل المشروع على منصة Kichstarter مثلاً والتي تتيح الطريقة الأسهل للحصول على الأموال
كما ويمكنك مشاركة مشروعك على فيسبوك بعد تحميله على جهاز آيفون الخاص بك فمن خلال النقر فوق مشروعك يمكنك تقدير التاريخ الأنسب لإطلاق حملتك وإصدار منتجك
ومن الجدير بالذكر أنه عليك أن لا تتوانى عن مبادلة داعمي مشروعك الاهتمام وإبداء التقدير لهم عن طريق منحهم المكافآت المادية مثلاً
ومن الضروري في عملية البحث عن العملاء التأكد من مدى قابلية أن يلفت مشروعك الاهتمام لتقديم الدعم له وإجراء استطلاع للرأي لعملائك المحتملين حول منتجك أو خدمتك لكي تعزز مواطن القوة وتتفادى مواضع الضعف كما ويمكن الاستعانة بمحركات البحث للعثور على ما يجذب الناس ويثير اهتمامهم ولاسيما تطوير احتياجاتهم
3. بناء منصة تعليمية افتراضية تعود عليك بالربح المادي
ما يضمن إنشاء خطة عمل ناجحة مع إمكانية الحفاظ على مسار تصاعدي لتطوير العمل وفق هذه الخطة هو بناء منصة تعليمية متميزة وهذا يعتمد على توفر ركيزتين أساسيتين هما
* الشخصيات القيادية القادرة على التعامل مع مختلف أنواع العقبات والصعوبات التي تعترض كادر العمل الافتراضي في هذا النوع من المنصات فالتصرفات المناسبة والقرارات الحاسمة تخلق نوع من الحكمة في حل أي نوع من المشاكل
* من أكثر ما يعيق تحقيق النجاح في هذا النوع من المشاريع هو إلغاء ما يتوجب عليك القيام به اليوم وتأجيله إلى الغد فالاستراتيجية الناجحة تقوم بالأساس على إنجاز العمل المناسب في الوقت المناسب
تكمن أهمية هذه المنصات في لجوء عدد كبير من المتعلمين إليها في حال وجود إمكانية تدرب فردي
: ومن خصائص النجاح في إدارة هذه المنصات من قبل القادة توفر عدة عوامل
الاستمرارية في طرح وتقديم كل ما هو مهم ومفيد *
التفاعل الفعال *
التنوع والحداثة في مواكبة كل جديد*
تفادي الوقوع في جميع أنواع الأعطال الفنية والتقنية *
المهارة والمرونة في التعامل مع الآخرين*
Advertisements
4. تقديم خدمات استضافة المواقع الإلكترونية
تشمل هذه الخدمة توفُّر مجال واستضافة الموقع والتطوير وبمجرد امتلاكك لجهاز كمبيوتر يمكنك البدء في هذا المشروع
ويعتبر هذا المشروع مضمون الربح لأن تأمين خدمة استضافة الموقع الإلكتروني هو المطلب الأكثر شيوعاً في وقتنا الحالي إذا يزيد الإقبال عليها بشل كبير وهذه الخدمة تُوفر عن طريق التخزين وحسابات البريد الإلكتروني وقواعد البيانات إضافة إلى توفير واجهة مستخدم لصاحب الموقع ويتم ذلك من قبل شركة أو فرد
يتوقف نجاح هذا المشروع على مدى فترة حضورك على شبكة الإنترنت فازدياد عدد الجمهور المطلعين على موقعك الإلكتروني مؤشر قوي على ازدياد فرص حصولك على عملاء
: نستخلص مما سبق تفنيد 5 خطوات بسيطة لبدء عمل استضافة
عليك تهيئة الموقع الإلكتروني الخاص بك وتحديد قيم الخدمات والقنوات
اختيار العلامة التجارية لاستضافة الويب والفئات المستهدفة وذلك باختيار اسم لشركتك يكون بسيطاً وسهلاً
تطوير وتوسيع خط العمل المتعلقة بالاستضافة الخاص بك
احرص تماماً على الاعتناء بالجانب الإعلاني للخدمات التي تقدمها مع الاهتمام بإبراز ما تقدمه من عروض وميزات سواء حملات إعلانية إلكترونية أو مطبوعات ومنشورات الورقية وابدأ بالأصدقاء
كما وأن الاهتمام بالعملاء لا يقلل أهمية عن ما ذكر في البنود السابقة وذلك عن طريق تجنب المراوغة مع العملاء في حال حدثت معك مشكلة فنية أدت إلى حدوث خلل والإسراع في حل أي طارئ يقع على أي جانب من الجوانب المالية الخاصة بالعملاء والتعامل معه بما يريح العميل
5. بيع خدمات الاشتراك
وفقاً لدراسة أجريت من قبل مختصين في مجال التجارة الإلكترونية أظهرت أن معدل نمو التجارة الإلكترونية يزداد بشكل كبير ومتسارع
تمنح الشركات التي تتيح خدمة الاشتراك للعملاء عبر الإنترنت تكاليف أقل جراء عمليات الشراء المتكررة للمنتجات المطلوبة ما يحافظ على دوام العلاقة التجارية بين المنتج والعميل إلى الأبد
: وبذكر العوامل التي تجعلك تمعن النظر في عمل اشتراك نجد أن
إمكانية التنبؤ بالعائدات المادية *
قلة المصاريف التي ستبذلها للحصول على العملاء *
حرص العملاء على الحفاظ على التعامل معك *
مرونة في بيع المنتجات *
توفر المال بين يديك على الدوام *
: في حال بدء نشاط تجاري مبني على الاشتراك وجب التنويه إلى البنود التالية
الحرص على الاهتمام الدائم بالعملاء للمحافظة عليهم *
التنويه المستمر لأهمية المنتج أو الخدمة التي تقدمها *
اتباع خطة ناجحة لعملية التسويق *
محاولة العثور على العروض المناسبة *
تجميع العملاء المستعدين للاشتراكات *
تحديد مدة تجريبية مجانية *
6. اكتساب المال عن طريق متابعة المنتجات
وهذا يعني اعتماد أصحاب بعض العلامات التجارية على أشخاص يقومون بمتابعة منتجاتهم التجارية كتقديم اقتراحات حول المنتجات الجديدة التي لم تطرح في الأسواق بعد وذلك مقابل بدل خدمات يتم الحصول عليها من خلال
مبلغ مادي *
بضائع *
قسائم هدايا *
وللبدء في بناء مشروع كهذا يتوجب عليك إنشاء مدونة تعرض فيها خدماتك في مراجعة المنتجات كما ويمكنك الاستعانة بموقع Amazon Mechanical Turk
يتعامل معك أصحاب العلامات التجارية في حال قررت الانضمام لكادرهم كمُراجِع لمنتجاتهم على أنك أحد العملاء ومن خلال قراءتك لتلك البضائع يتعرفون على الطريقة التي يفكر بها المستهلكون فيسهل عليهم تحسين أو تطوير المناسب وفقاً لتقديرك وتقييمك
ويعتمد المبدأ الاساسي على قبولك في مثل هذه الوظيفة على اختبار أهليتك في الحصول عليها من خلال قيام شركة معينة باختبار أسلوبك في مراجعة منتجهم شرط أن تكون من مستهلكي هذا المنتج فإن وجدوا فيك الكفاءة اللازمة التي تؤهلك لاستلام وظيفتك فسيعلمونك عن طريق بريدك الإلكتروني
وفقاً لكل ما ذكر فمشاركتنا لعلامة تجارية قوية ومتينة لا ينفي أبداً وخاصة بعد اكتسابنا الخبرة أن ننشئ نشاطاً تجارياً خاصاً بنا يحدد نجاحه مدى ما نتمتع به من رغبة وطموح
With the rapid development of information technology in general and communication in particular, software companies continuously produce smart services and modern applications that give the details of our daily lives a lot of interest, for example, but not limited to, applications for measuring blood sugar, the method of burning calories and other programs that provide guidance related to the physical and psychological health of users .
These applications will build an information system related to their users personally. If these applications or services are used correctly, they will give accurate results. We will address the impact of the uses on users and the extent to which these services can be directed and invested in serving our daily needs, whether health ones or related to the tools that we deal with permanently and continuously. .
Sources :
In the process in which these applications collect our data, that data will be used to make our lives more enjoyable and comfortable.
Here we will analyze the structural structure of the data and we will start by forming two columns, the first containing the data sources and the second containing the resulting information.
With the presence of smart devices that link our bodies, our behaviors, our projects, and the Internet, making us digital physical elements, these devices have become the focus of the attention of many around the world. We will call these tools “devices”.
outputs:
You can imagine that an application can record your sleep times and analyze it to come up with a standard that determines the optimal time for you. It sets its alarm to wake you up in the morning, and another application to measure your breathing and another application to analyze your heart rate by skin color. All of these services are available through “apps” “
Advertisements
Key technologies are devised for similar applications that include the common tasks of those applications so that developers and programmers use their content specifically to facilitate their access to the devices that produce the data composing the applications and this is called “APIs”.
Some companies use the information of application users to serve their advertising purposes, as they create analyzes of our daily needs and basic requirements and obtain models based on them that provide them with advertising materials of higher value.
The process of relying on the source of information and analyzing the data can be called “business.”
Some research for some companies is based on the exploration of valuable information extracted from the data ocean of users to be invested in the service of various fields such as medicine or marketing. We will call this process “research”
In the end, we cannot make a final judgment according to what was mentioned that the investment of user information is included under the purpose of advertising only, but it can be clearly recognized that there are companies striving to provide useful service to users, which enhances confidence between the producer and the consumer in what is called “experience.”
Here, the difference between those who play the role of data sources and those who give a way out to the data becomes clear. To clarify, we present some evidence on the ground:
The question that arises here is, are you, as a user, ready to provide your digital information to a company to exploit it in what is valuable and useful to you?
After the clear vision of the data structure has been completed, perhaps it will be clear that the future of technology will lead us to use the technology of linking sources with exits, which leads us to the possibility that each of us can exploit his personal information to create what is useful and more valuable in what facilitates our daily lives.
Advertisements
البنية التكوينية للبيانات
Advertisements
مع التطور السريع لتكنولوجيا المعلومات عموماً والاتصال خصوصاً تنتج الشركات البرمجية بشكل متسمر الخدمات الذكية والتطبيقات الحديثة التي تضفي على تفاصيل حياتنا اليومية الكثير من الفائدة وعلى سبيل المثال لا الحصر تطبيقات قياس سكر الدم وطريقة حرق السعرات الحرارية وغيرها من البرامج التي تقدم إرشادات تتعلق بالصحة الجسدية والنفسية للمستخدمين
هذه التطبيقات ستقوم ببناء منظومة معلومات تتعلق شخصياً بمستخدميها وفي حال استخدام تلك التطبيقات أو الخدمات بشكل صحيح فسوف تعطي نتائج دقيقة وسنتناول أثر الاستخدامات على المستخدمين ومدى إمكانية توجيه تلك الخدمات واستثمارها فيما يخدم حاجاتنا اليومية سواء الصحية منها أو ما يتعلق بالأدوات التي نتعامل معها بشكل دائم ومستمر
:مصادر
في العملية التي تقوم فيها تلك التطبيقات بجمع البيانات الخاصة بنا سيتم توظيف تلك البيانات في جعل حياتنا أكثر متعة وراحة
وهنا سنقوم بتحليل البنية التكوينية للبيانات وسنبدأ بتشكيل عمودين الأول يحوي مصادر البيانات والثاني يحوي المعلومات الناتجة
وبوجود الأجهزة الذكية التي تربط بين أجسادنا وتصرفاتنا ومشارعنا وبين الإنترنت فتجعل منا عناصر مادية رقمية هذه الأجهزة أصبحت محط اهتمام الكثيرين حول العالم سنطلق اسم “أجهزة” على هذه الأدوات
: مخرجات
لك أن تتصور أنه بإمكان أحد التطبيقات أن يسجل أوقات نومك ويقوم بتحليلها ليخرج لك معياراً يحدد لك فيه الوقت الأمثل فيضبط المنبه الخاص به لإيقاظك صباحاً وتطبيق آخر لقياس التنفس الخاص بك وآخر يقوم بتحليل معدل نبضات القلب عن طريق لون البشرة كل هذه الخدمات تتوفر عبر ” تطبيقات “
Advertisements
يتم ابتكار تقنيات رئيسية للتطبيقات المتماثلة تتضمن المهام المشتركة لتلك التطبيقات بحيث يستخدم المطورون والمبرمجون مضمونها على وجه التحديد فيسهل بذلك وصولها إلى الأجهزة التي تنتج البيانات المكونة للتطبيقات وهذا ما يسمى ” واجهات برمجة التطبيقات
تعمد بعض الشركات إلى استخدام المعلومات الخاصة بمستخدمي التطبيقات لخدمة أغراضها الإعلانية إذ يقومون بإنشاء تحليلات لاحتياجاتنا اليومية ومتطلباتنا الأساسية فيحصلون بناءً عليها على نماذج توفر لهم مواد إعلانية ذات قيمة أعلى
“يمكن أن نطلق على عملية الاعتماد على مصدر المعلومات وتحليل البيانات اسم “الأعمال
تقوم بعض الأبحاث الخاصة ببعض الشركات على التنقيب عن معلومات قيمة تستخرج من محيط البيانات التابعة للمستخدمين ليتم استثمارها في خدمة مجالات متعددة كالطب أو التسويق سنسمي هذه العملية ” البحث
وفي النهاية لا يمكننا أن نطلق حكماً نهائياً وفق ما ذكر بأن استثمار المعلومات الخاصة بالمستخدم ينطوي تحت غرض الإعلان فحسب بل يمكن وبشكل واضح الاعتراف بأن هناك شركات تسعى جاهدة لتأمين الخدمة المفيدة للمستخدمين مما يعزز الثقة بين المنتج والمستهلك فيما يسمى ” الخبرة
:وهنا يتضح الفارق بين من يلعبون دور مصادر البيانات ومن يعطون مخرجاً للبيانات وللتوضيح نطرح بعض الأدلة على أرض الواقع
والسؤال الذي يطرح نفسه هنا هل أنت كمستخدم على استعداد لتقديم معلوماتك الرقمية لأحد الشركات لاستغلالها فيما هو قيم ومفيد بالنسبة لك ؟
بعد أن اكتملت الرؤية الواضحة للبنية المكونة للبيانات ربما سيكون من الواضح أن مستقبل التكنولوجيا ليوصلنا إلى استخدام تقنية ربط المصادر بالمخارج ما يؤدي بنا إلى إمكانية أن يقوم كل منا باستغلال معلوماته الشخصية لابتكار ما هو مفيد وأكثر قيمة في ما يسهل حياتنا اليومية
In this simple tutorial, we’ll explain One-Hot encoding with Python and R.
This model recognizes numeric values only as inputs. In order for our model to work with data sets, we must encode them, as we will explain later.
What is the concept of One-hot encoding:
This encoding converts groups of data represented by words, letters or symbols into correct numeric values with specific places of ones and zeros that are determined by the number of groups so that each part of these places represents one group or category.
Thus, any category is denoted by the number one, otherwise the symbol will take zero.
Advertisements
We will illustrate with a practical example the process of One-hot coding using R and Python:
Using Python
Using R
So what is the significance of this encoding ?
In the case of important data sets consisting of certain categories, we need to use them in the model, which of course only accepts numeric codes, as is the case in some algorithms, in these cases one-hot encoding is the best option.
Advertisements
ما هو مفهوم
One-Hot Encoding
Advertisements
سنتناول في هذا الدرس التوضيحي المبسط شرح
Python و R باستخدام One-Hot الترميز
يتعرف هذا النموذج على القيم الرقمية فقط على شكل مدخلات ولكي يتمكن نموذجنا من العمل مع مجموعات البيانات يتوجب علينا ترميزها كما سنوضح لاحقاً
؟ One-hot ما هو مفهوم ترميز
يقوم هذا الترميز بتحويل مجموعات من البيانات التي تمثل بكلمات أو حروف أو رموزإلى قيم رقمية صحيحة بمنازل محددة من الآحاد والأصفار يتم تحديدها من خلال عدد المجموعات بحيث يمثل كل جزء من هذه المنازل مجموعة أو فئة واحدة وبالتالي يرمز إلى أي فئة بالرقم واحد وعدا ذلك سيأخذ الرمز صفر
Advertisements
One-hot وسنوضح بمثال عملي عملية ترميز
: وبايثون R باستخدام لغتي
: باستخدام بايثون
: Rباستخدام
إذاً من أين تأتي أهمية هذا الترميز ؟
في حال وجود مجموعات بيانات مهمة مؤلفة من فئات معينة فنحن بحاجة إلى استخدامها في النموذج الذي هو بطبيعة الحال لا يقبل التعامل إلا مع الرموز الرقمية كما هو الحال في بعض الخوارزميات
Questions are often raised about the advice and instructions that those who intend to apply for a first job in data science should have, as this particular field does not allow those who wish to apply for the first job to be trained in it, as most of the data science cadres focus on dealing with different jobs, so the new employee must To work alone from the start.
What we will present today will be guiding instructions that, if followed, will remove a kind of dread and will increase the chances of success.
Technical expertise:
You must have several skills to gain confidence and make a perfect start when applying for a job, including:
• To feel that you are proficient in dealing with programming languages
• To explore data analysis skills
• Understand the concept of machine learning algorithms
• Positive in communicating with others
When you have these skills, then we can say that you will start walking in the right path. It is a good start, and we will detail some important information in more depth.
Create an archive of your work and skills (Portfolio):
When there is a vacancy in data science and applicants flock to it, it is difficult for recruitment officials to distinguish the most qualified applicants. Here, the importance of having their own business archive indicates their level of experience and skill, so that they have better chances of being nominated.
It does not mean here that you have to create advanced or complex projects, when you see yourself starting to deal flexibly with data science techniques, it is enough to present simplified projects as a predictive model that you have done about any research and the Kaggle platform is the most appropriate place to learn to create simple projects that contain educational methods A value created by data science experts through which you will learn the basic concepts and useful techniques needed to build a startup and by adding your skills to the information you will obtain from this platform, you will be able to build a clear and solid structure on which to base your career path.
Your work archive will become rich and valuable with the effective practice of data science projects and thus you will have the necessary expertise to solve any problem that you may encounter during the implementation of your projects. Practical application is always the essence of learning. It is not enough to rely on theoretical learning, as distinguishing you among your peers is coupled with continuous practical practice and gaining more experiences.
You can enrich your information and activate your skills by using the DrivenData system, which poses real-world problems. This system helps you to enter the challenge and search for solutions that benefit the environment and humans, as well as other systems that include data scientists who are experts in facing challenges and exploring solutions that reflect positively on society. Working with these people is considered An abundant source to gain the required experience.
The stage that follows the completion of the projects is to create a free website to display the archive, and this does not require you a lot of time or effort, which we will explain later in this article.
Business writing:
The HR team usually does the preliminary testing in data work and who do not have deep knowledge in data science techniques so choosing the right description of your business profile is the key for these people to get a general idea of your project,
Recruitment team members make every effort to select candidates carefully in order to avoid making mistakes and accomplish their task more flexibly and smoothly.
A blog is the perfect place to blog about your business and Kaggle is a good environment for documenting your projects.
Organizing an outstanding CV:
It is very necessary to have a resume organized according to certain criteria and within attractive templates that are widely available on the web, and we discussed how to organize a professional resume in a previous article.
Advertisements
Share experiences and skills:
Most companies rely on the expertise of their employees, but consulting specialized data scientists gives a professional character to the company’s business and analytics, and you can very simply build a distinguished team through several sites:
Meetup: It allows you to create an account that enables you to communicate with people within your surroundings.
Events: Through which you can explore different scientific events, especially data science. These events create a suitable environment to get to know people with common interests.
Conferences: It includes many conferences, especially those that have a distinctive educational nature, in addition to being a forum for communication between data scientists.
Mentor: All of the above does not replace the presence of a mentor who will teach and support you in your career. One of the more in-depth benefits is the ability to communicate with your mentor’s network, and know that the more contact you have with data science experts, the more experience and skills you will have.
Make your start from the submerged companies:
Since most of the major companies depend on the stability of their employment, it will be difficult to find opportunities for those who do not have enough experience, so your chance to find a job for one of the developing companies will be your starting point that will one day lead you to your dream of being a member of a cadre Professional work in one of the major companies.
However, the benefit of joining a growing company is not limited to what has been mentioned only, but also to several things:
• In the immersed company, you have a greater opportunity to communicate with your superiors at work, so they can see your work and get to know your skills closely.
• Your chance to learn new things is great through diversity in jobs and tasks.
• In a growing company, you will have greater opportunities for job promotion.
Take care to deal with all types of data:
Constant and continuous dealing with various types of data allows you to gain more technical experience, such as having the experience of a data analyst and many other tasks that you can master in the near term. It makes you a data scientist who is not hampered by difficulties and not deterred by technical and technical problems from highlighting his expertise and efficiency that makes him distinct from his peers and the focus of attention and confidence of business leaders.
In conclusion, we can say that data science provides you with many opportunities that you dream of, but you should spare no effort or time in learning and do not miss out on everything that would raise the level of your experiences and skills. abundant.
Advertisements
!كيفية الحصول على أول وظيفة في علم البيانات .. بدون خبرة
Advertisements
كثيراً ما تثار التساؤلات حول النصائح والتعليمات التي يجب على من ينوي التقدم لأول لوظيفة في علم البيانات حيث أن هذا المجال بالذات لا يتيح لمن يرغب بالتقدم للوظيفة الأولى أن يتدرب عليها إذ ينصرف جل اهتمام كوادر عمل علوم البيانات على معالجة وظائف مختلفة لذا يتوجب على الموظف الجديد أن يعمل بشكل منفرد منذ البداية
وما سنطرحه اليوم سيكون بمثابة تعليمات توجيهية سيزيل في حال اتباعها نوع من الرهبة وسيزيد من فرص النجاح
:الخبرة التقنية
: يجب عليك التحلي بعدة مهارات لتكتسب الثقة وتبدأ بداية مثالية عند التقدم للوظيفة نذكر منها
أن تشعر بأنك متمكن في التعامل مع لغات البرمجة *
أن تستكشف مهارات تحليل البيانات *
استيعاب مفهوم خوارزميات التعلم الآلي *
الإيجابية في التواصل مع الآخرين *
عنما تمتلك هذه المهارات يمكن القول عندها أنك ستبدأ السير في الطريق الصحيح فهي بداية موفقة وسنقوم بتفصيل بعض المعلومات الهامة بشكل أعمق
:( Portfolio )قم بإنشاء أرشيف لأعمالك ومهاراتك
عندما يكون هناك وظيفة شاغرة في علم البيانات ويتوافد المتقدمون إليها يصعب على مسؤولي التوظيف تمييز المتقدمين الأكثر كفاءة هنا تبرز أهمية امتلاكهم أرشيف أعمال خاص بهم يدل على مستوى خبرتهم ومهارتهم فتكون حظوظهم أوفر بالترشح . ولا يُقصد هنا أنه يتوجب عليك إنشا مشاريع متطورة أو معقدة , فعندما ترى في نفسك بدأت تتعامل بمرونة مع تقنيات علوم البيانات فيكفي أن تعرض مشاريع مبسطة كنموذج تنبؤي قمت به حول أي بحث ما
هي المكان الأنسب Kaggle وتعتبر منصة
لتعلم إنشاء مشاريع بسيطة فهي تحوي طرق تعليمية قيمة قام بها خبراء علوم البيانات من خلالها ستتعلم المفاهيم الأساسية والتقنيات المفيدة اللازمة لبناء الشروع وبإضافة ما تملك من مهارات على المعلومات التي ستحصل عليها من تلك المنصة ستتمكن من بناء هيكلية واضحة ومتينة تستند عليها في مسيرتك الوظيفية
سيصبح أرشيف أعمالك غنياً وقيماً بالممارسة الفعالة لمشاريع علم البيانات وبالتالي ستتبلور عندك الخبرات اللازمة لحل أي مشكلة قد تواجهك أثناء تنفيذ مشاريعك فالتطبيق العملي دائماً هو جوهر التعلم فلا يكفي أن تعتمد على التعلم النظري إذ أن تميزك بين أقرانك مقرون بالممارسة العملية المستمرة واكتساب المزيد من الخبرات
يمكنك إثراء معلوماتك وتفعيل مهاراتك
DrivenData باستخدام نظام
الذي يطرح مشاكل العالم الواقعي يساعدك هذا النظام على دخول التحدي والبحث عن الحلول التي تفيد البيئة والبشر ومثله من الأنظمة الأخرى التي تضم علماء بيانات خبراء في مواجهة التحديات وتحري الحلول التي تنعكس إيجابياً على المجتمع فالعمل مع هؤلاء الأشخاص يعتبر مصدر وفير لاكتساب الخبرة المطلوبة المرحلة التي تلي الانتهاء من المشاريع هي إنشاء موقع إلكتروني مجاني لعرض الأرشيف وهذا لا يتطلب منك الكثير من الوقت ولا جهد وهو ما سنقوم بشرحه لاحقاً في هذا المقال
:تدوين الأعمال
غالبأً ما يقوم فريق الموارد البشرية بإجراء الاختبار الأولي في عمل البيانات والذين لا يمتلكون معرفة عميقة في تقنيات علم البيانات لذا فاختيارك للوصف المناسب لملف عملك هو مفتاح هؤلاء الأشخاص لتكوين فكرة عامة عن مشروعك
يبذل أعضاء الفريق القائم على التوظيف قصار جهدهم لاختيار المرشحين بدقة لكي يتجنبوا الوقوع في الخطأ وينجزوا مهمتهم بمرونة وسلاسة أكبر
تعتبر المدونة هي المكان الأنسب لتدوين أعمالك
بيئة جيدة لتوثيق Kaggle كما وتعتبر منصة
المشاريع الخاصة بك
:تنظيم سيرة ذاتية متميزة
من الضروري جداً أن يكون لديك سيرة ذاتية منظمة وفق معايير معينة وضمن قوالب جذابة متاحة على الويب بشكل كبير وقد تطرقنا إلى كيفية تنظيم سيرة ذاتية احترافية في مقال سابق
Advertisements
:تشارك الخبرات والمهارات
تعتمد أغلب الشركات على خبرات موظفيها ولكن استشارة علماء البيانات المختصين تضفي طابعاً احترافياً على أعمال وتحليلات الشركة ويمكنك ببساطة متناهية أن تبني فريق عمل متميز وذلك من خلال عدة مواقع
: Meetup
يتيح لك إنشاء حساب يمكنك من التواصل مع أشخاص ضمن محيطك
: Events
تستطيع من خلاله استكشاف المناسبات العلمية المختلفة ولاسيما علم البيانات هذه المناسبات تخلق بيئة مناسبة للتعرف على أشخاص ذوي الاهتمامات المشتركة
: Conferences
تتضمن العديد من المؤتمرات وخاصة تلك التي تتمتع بطابع تعليمي مميز علاوة على أنها ملتقى تواصل بين علماء البيانات
: Mentor
كل ما ذكر أعلاه لا يغني عن وجود مرشد يتولى تعليمك ودعمك في مسيرتك المهنية ومن أوجه الاستفادة الأكثر تعمقاً هو إمكانية تواصلك مع شبكة مرشدك , واعلم أنه كلما ازداد احتكاكك بخبراء علم البيانات كلما ازدادت خبرتك ومهاراتك
:اجعلك انطلاقتك من الشركات المغمورة
بما أن أغلب الشركات الكبرى تعتمد على الثبات في توظيفها فسيكون من الصعب إيجاد فرص لمن ليس لديهم ما يكفي من الخبرة لذا فرصتك في الحول على عمل لدى إحدى الشركات النامية سيشكل نقطة انطلاقك التي ستصل بك في يوم من الأيام إلى حلمك في أن تكون عضواً في كادر عمل محترف في إحدى الشركات الكبرى
: إلا أن الفائدة من التحاقك بشركة نامية لا يقتصر على ما ذكر فقط بل يتعداه إلى عدة أمور
في الشركة المغمورة تكون لديك الفرصة أكبر للتواصل مع رؤسائك في العمل وبالتالي يمكنهم رؤية أعمالك والتعرف على مهاراتك عن كثب
فرصتك في تعلم أشياء جديدة تكون كبيرة من خلال التنوع في الوظائف والمهام *
ستتاح لك في شركة نامية فرص أكبر في الترقية الوظيفية *
احرص على التعامل مع جميع أصناف البيانات
يتيح لك التعامل الدائم والمستمر مع مختلف أنواع البيانات اكتساب مزيد من الخبرة الفنية كأن تمتلك خبرة محلل البيانات ومهام أخرى عديدة يمكنك إتقانها على المدى القريب فالتمسك باختصاص واحد من علوم البيانات يكبل حركة المتعلم ويعيق تطوره في الوصول إلى مستوى الاحتراف لذا فالإلمام والمواظبة على الاحتكاك بأصناف البيانات يجعل منك عالم بيانات لا تعيقه الصعوبات ولا تثنيه المشاكل التقنية والفنية عن إبراز خبرته وكفاءته التي تجعله متميزاً عن أقرانه ومحط اهتمام وثقة رؤساء العمل
وفي الختام يمكننا القول بأن علم البيانات يوفر لك الكثير من الفرص التي تحلم بها ولكن ينبغي عليك أن لا تدخر جهداً ولا وقتاً في التعلم ولا تفوت على نفسك كل ما من شأنه أن يرفع مستوى خبراتك ومهاراتك فهذا العلم كلما منحته من وقتك وجهدك منحك من أسراره وتقنياته الوفيرة
The issue of data volume obtains the greatest attention from those responsible for analyzing and compiling the huge amount of data compared to its accuracy and type.. What can be said that this interest is the most prominent feature in the work system in the space of big data.
However, this interest did not satisfy some companies with the presence of some technical errors in their marketing databases. It is striking that some statistics were recorded for a very large percentage of those gaps in the documents of one of the largest companies in the world.
Some of the pitfalls that were observed were highlighted as follows:
• Lack of sufficient knowledge of industrial information
• Lack of recorded information on revenues
• Not paying attention to employee records
• Neglecting to know the job titles of customers
Perhaps what was mentioned above makes us reconsider that theory with which we started our research and recall that it is more appropriate for everyone who deals with data to pay more attention to the quality and accuracy of the data than to the volume of data in order to seek to realize the desired goal and expand business activity.
This is reflected in several reasons, the most important of which are:
Attention to sales:
When those in charge of sales operations are armed with an abundance of accurate and correct data, then they can use their full potential and experience to acquire the largest possible number of active customers, and thus they have avoided as much as possible wasting time by searching for how to find solutions to the obstacles that hinder their progress and success, and this in turn applies to the employees of Marketing, as it is not acceptable for the salesperson to search for a customer’s number or mail and then discover that it is missing and not present in the contacts database. The attention to accuracy here avoids the work staff making such mistakes and they are able to divert their attention to convincing the largest possible number of customers to buy a product or service and thus do their part to the fullest.
According to the reports of marketing experts, email, mobile and search engine optimization are the elements that highlight the main role of big data in its impact on their marketing system.
Focus on the important points of the target group:
Based on what was mentioned, it can be said that sound and accurate data contributes to a major role in demonstrating the competence of marketing staff and providing what they have of experience and good judgment of matters according to the right track, such as conducting a quick study of the record of each customer so that they coordinate well-thought-out messages that suit the interests of the target customer.
Avoid wasting time and money:
The randomness of data coordination hinders the work of salespeople, as instead of investing time in the optimal organization of the marketing plan of preparing and sending promotional messages, they will have to search for a long time for ways to connect them to customers, so sound data is the way to avoid falling into a cycle of confusion and waste of time and everything It would hinder the workflow.
Good Sales Leadership Increases Profits:
The deep knowledge that results from good handling of clean data generates in the work staff sufficient experience and far-sightedness to deal with various types of commercial activities of all kinds, especially knowledge of transaction volumes, market requirements, good selection of projects with guaranteed profit, economic feasibility, forecasting sales operations, forecasting revenues, and so on.
We conclude from the above:
There is no point in the large amount of data if it does not enjoy regularity and coordination, then this huge amount of organized and clean data will form a mainstay for the company and its staff, and it is the main pillar for developing any business activity and achieving the required results with high efficiency.
Advertisements
ما مدى أهمية البيانات الضخمة في عملية التسويق الخاصة بك ؟
Advertisements
ينال موضوع حجم البيانات الحيز الأكبر من اهتمام القائمين على تحليل وتجميع الكم الهائل من البيانات مقارنة مع دقتها ونوعها .. ما يمكن القول بأن هذا الاهتمام يعتبر السمة الأبرز في منظومة العمل في فضاء البيانات الضخمة
إلا أن هذا الاهتمام لم يشفع لبعض الشركات بوجود بعض الأخطاء التقنية في قواعد بيانات التسويق لديها ومن الملفت للنظر تسجيل بعض الإحصائيات لنسبة كبيرة جداً من تلك الثغرات في وثائق إحدى كبرى الشركات في العالم
: وتم تسليط الضوء على بعض العثرات التي لوحظت وكانت على النحو الآتي
غياب المعرفة الكافية بالمعلومات الصناعية *
قلة المعلومات المسجلة عن الإيرادات *
عدم الاهتمام بسجلات الموظفين *
إهمال معرفة التسميات الوظيفية للعملاء *
ولعل ما ذكر آنفاً يجعلنا نعيد النظر في تلك النظرية التي استهلينا بها بحثنا ونسترجع القول بأن من الأجدر على كل من يتعامل مع البيانات أن يولي الاهتمام الأكبر لجودة ودقة البيانات لا على حجم البيانات للسعي وراء إدراك الغاية المرجوة وتوسيع النشاط التجاري
: ويتجسد ذلك في عدة أسباب أهمها
: الاهتمام بعمليات البيع
عندما يتسلح القائمون على عمليات البيع برصيد وافر من البيانات الدقيقة والصحيحة فعندها يمكنهم توظيف كامل إمكاناتهم وخبراتهم لاكتساب أكبر قدر ممكن من العملاء النشطين وبذلك يكونون قد تجنبوا قدر الإمكان إهدار الوقت جراء البحث عن كيفية إيجاد الحلول للعراقيل التي تعوق تقدمهم ونجاهم , وهذا ينطبق بدوره على موظفي التسويق إذ ليس من المقبول أن يقوم مندوب المبيعات بالبحث عن رقم أو بريد أحد العملاء ثم يكتشف أنه مفقود وغير موجود في قاعدة بيانات جهات الاتصال فالاهتمام بالدقة هنا تجنب كادر العمل الوقوع في هكذا أخطاء ويكون بمقدورهم صرف اهتمامهم إلى إقناع أكبر عدد ممكن من الزبائن بشراء منتج أو خدمة وبالتالي يقومون بدورهم على أكمل وجه
وحسب تقارير خبراء التسويق أن الرسائل عبر البريد الإلكتروني والجوال وتحسين محركات البحث هي العناصر التي تُبرِز الدور الرئيسي للبيانات الضخمة في تأثيرها على المنظومة التسويقية الخاصة بهم
: التركيز على النقاط المهمة للفئة المستهدفة
وبناءً على ما ذكر يمكن القول أن البيانات السليمة والدقيقة تسهم في دور كبير في إظهار الكفاءة التي يتمتع بها موظفو التسويق وتقديم ما يملكون من خبرة وحسن تقدير الأمور وفق مسارها الصحيح كقيامهم بدراسة سريعة لسجل كل عميل بحيث يقومون بتنسيق رسائل مدروسة تناسب اهتمامات العميل المستهدف
: تجنب إهدار الوقت والمال
تتسبب العشوائية في تنسيق البيانات بإعاقة عمل مندوبي المبيعات إذ بدلاً من استثمار الوقت في التنظيم الأمثل لخطة التسويق المتمثلة بتجهيز رسائل الترويج وإرسالها سيتوجب عليهم البحث لفترة طويلة عن الطرق التي ستوصلهم بالعملاء , لذا فإن البيانات السليمة هي السبيل لتفادي الوقوع في دوامة الارتباك وهدر الوقت وكل ما من شأنه أن يعيق سير العمل
: القيادة الجيدة للمبيعات تؤدي إلى زيادة الأرباح
أن المعرفة العميقة التي يفرزها حسن التعامل مع البيانات النظيفة تولد لدى كادر العمل الخبرة الكافية والنظرة البعيدة للتعامل مع شتى أنواع الفعاليات التجارية على اختلاف أنواعها ولاسيما معرفة أحجام الصفقات ومتطلبات السوق وحسن اختيار المشاريع ذات الربح المضمون والجدوى الاقتصادية والتنبؤ بعمليات البيع وتوقع الإيرادات وما إلى ذلك
نستنتج مما ذكر : لا جدوى من كثرة البيانات وضخامتها إن لم تكن تتمتع بالانتظام والتنسيق عندها سيشكل ذلك الكم الهائل من البيانات المنظمة والنظيفة دعامة أساسية للشركة ولكادرها وهي الركيزة الرئيسية لتطوير أي نشاط تجاري وتحقيق النتائج المطلوبة بكفاءة عالية
How to write a killer resume and ace the interview
Advertisements
Obtaining a job in the field of data analysis is the biggest goal for practitioners of this type of science, but despite their acquisition of the necessary experience and their possession of the skills to make them highly qualified data analysts, the dread of the job interview for applicants remains an obsession that causes confusion that sometimes hinders passing the interview flexibly and easily. It is imperative for the applicants to overcome the obsession with dread and tension by being confident during the interview, which reflects a positive impression on those in charge of examining the applicants and thus increases the chances of acceptance.
Especially since one of the important factors that contribute to increasing employment opportunities, in addition to what was mentioned above, is organizing and coordinating a CV that impresses those who watch it.
So we can now say that the most important factors of success in the interview are:
• Apply to the appropriate job that matches your skills and experience.
• Organizing an attractive CV in form and content.
We will elaborate on each of these factors separately:
Choosing the right job and applying for it:
After that great time and effort to reach the efficiency and experience you have reached, and to clearly define your career path, you should culminate in all this by choosing an appropriate job for which you will apply by focusing on several points:
• Find a job that you think matches your experience and skills, as this will make you stand out in your career
• If you work in a company, make sure that if you have the desire to move to a new suitable job, the move should be within the company itself. Your prior knowledge of your job environment and the behavior of your colleagues will make you the first candidate to receive a higher level internal job.
• Invest in famous job sites to learn about available opportunities such as: craigslist.com, LinkedIn.com, incrunchdata.com and dice.com, It contains many advertisements for job vacancies.
Distinguished CV organization:
After you have chosen the right job, you will face the next challenge, which is to organize a distinguished CV that fascinates the reader and reflects a good impression on those in charge of the interview, and to clarify the general meaning of excellence in CV writing, that is, to address in it an accurate description of your work and experience, accompanied by dates and documented by the certificates you obtained, in following Several points, including:
• It does not highlight your strengths as a data analyst only, but gives clear and tangible evidence and practical examples, such as writing your professional story in all its stages in a concise and understandable manner, in which you also talk about the impact of the projects you presented in the development of the business activity in which you were an active part.
• Talk briefly about your capabilities that can contribute to the development of the potential job and put forward some available solutions to confront some supposed problems. This will enhance the confidence of those responsible for employment and they will see you as a valuable gain within their job cadre. Strong support for written information in addition to the distinctive formatting of the CV such as highlighting headings and main paragraphs in bold, this will greatly contribute to drawing attention to your skills and experience
• Choose the appropriate phrases that make you appear as a skillful and professional data analyst that arouse the interest and admiration of the testers, and stay away from expressions and terms that are useless, and replace them with practical experiences of innovations and solutions that you have made in your projects and indicate the extent of their impact on overcoming problems and difficulties.
Acing the interview
After your CV has been admired and accepted, you are heading to the interview:
So, you are in front of a pivotal point that will determine your professional future. Do not skimp on yourself in preparing well for the real and decisive test through several instructions:
• Being aware of the details of the work, the movement of revenues and the strategies followed allows you to take note of the general policy of the company, and this will facilitate you to provide useful answers that satisfy the questioner in accordance with the professional content of the company.
In the interview, you may be exposed to difficult questions that you did not expect to be asked. Therefore, a thorough training on your story is part of a good preparation to face this type of question without showing signs of tension or confusion, which are considered your number one enemy in the success of your interview. Remember that self-confidence is your main ally in In that position, arm yourself with your skills and technical information and put it into practice through practical explanation in front of the interview committee.
• Be very careful to show your interest and unbridled desire to join the company’s staff and show your enthusiasm in being ready to face all kinds of challenges that hinder the progress of this company and put all your experience at the disposal of the company’s officials and employ it as much as possible by highlighting a general problem and dividing that problem into parts and then Treating each part separately will give a positive impression about you and show you that you are a skilled analyst and therefore your chance will be greater.
• Make sure to be present at the interview on time and do not delay, so lethargy and indifference become the first negative impression about you and you, then beware of arrogance and exaggerated pride in yourself and your skills. Good manners and good interaction with others while taking care of your elegance and your external appearance will leave a beautiful impact on them. Do not forget at the end of the interview. Do not forget to thank the interview members for their time and let them see from you a serious desire to work in the company.
Thus, we see that good preparation and preparation for the job interview gives the applicant a dose of self-confidence that can remove the dread imposed by the atmosphere of tests and interviews in general.
Advertisements
تنظيم سيرة ذاتية احترافية والتحضير لمقابلة العمل للحصول على وظيفة في تحليل البيانات
Advertisements
يعتبر الحصول على وظيفة في مجال تحليل البيانات الهدف الأكبر لممارسي هذا النوع من العلوم إلا أنه وبالرغم من اكتسابهم للخبرة اللازمة وامتلاكهم للمهارات الكفيلة بجعلهم محللي بيانات ذوو كفاءة عالية تبقى رهبة مقابلة التقدم للوظيفة بالنسبة للمتقدمين هاجساً يسبب إرباكاً يعيق في بعض الأحيان اجتياز المقابلة بمرونة وسهولة لذا يتحتم على المتقدمين أن يتجاوزوا هاجس الرهبة والتوتر من خلال التحلي بالثقة أثناء المقابلة مما يعكس انطباعاً إيجابياً لدى القائمين على اختبار المتقدمين وبالتالي تزيد فرص القبول
ولاسيما أن من العوامل المهمة التي تساهم زيادة فرص التوظيف إضافة إلى ما ذكر أعلاه هو تنظيم وتنسيق سيرة ذاتية تثير إعجاب من يشاهدها
: إذاً يمكننا الآن القول بأن أبرز عوامل النجاح في المقابلة هي
التقدم إلى الوظيفة المناسبة التي تتوافق مع مهاراتك وخبراتك *
تنظيم سيرة ذاتية جذابة شكلاً ومضموناً *
: وسنستفيض بالحديث عن كل واحدة من هذه العوامل على حدى
:اختيار الوظيفة المناسبة والتقدم إليها –
بعد بذلك الوقت والجهد الكبيرين للوصول إلى ما وصلت إليه من كفاءة وخبرة وتحديدك لمسارك الهني بشكل واضح فحريٌّ بك أن تتوج كل هذا باختيار مناسب للوظيفة التي ستتقدم إليها بالتركيز على عدة نقاط
ابحث عن الوظيفة التي تعتقد بأنها تتوافق مع خبراتك ومهاراتك فهذا سيجعلك متميزاً في مسيرتك المهنية
إن كنت تعمل في إحدى الشركات فاحرص إذا كانت لديك الرغبة في الانتقال إلى وظيفة جديدة مناسبة أن يكون الانتقال داخل الشركة نفسها فمعرفتك المسبقة بمحيطك الوظيفي وسلوك زملائك ستجعلك المرشح الأول لاستلام وظيفة داخلية ذات مستوى أعلى
استثمر مواقع العمل المشهورة لتتعرف على الفرص المتاحة مثل
craigslist.com و LinkedIn.com و incrunchdata.com و dice.com
فهي تحوي العديد من الإعلانات لشواغر وظيفية
: تنظيم سيرة ذاتية متميزة –
بعد اجتيازك لاختيار الوظيفة المناسبة ستقف أمام التحدي التالي وهو تنظيم سيرة ذاتية متميزة تبهر القارئ وتعكس انطباعاً جيداً لدى القائمين على المقابلة وبتوضيح المعنى العام للتميز في كتابة السيرة الذاتية أي أن تتطرق فيها إلى وصف دقيق لعملك وخبرتك مصحوبة بالتواريخ وموثقة بالشهادات التي حصلت عليها وذلك في اتباع عدة نقاط أبرزها
لا تبرز مواطن القوة لديك كمحلل بيانات فحسب بل تعطي إثباتات واضحة وملموسة وأمثلة عملية ككتابتك لقصتك المهنية في كافة مراحلها بشكل مقتضب ومفهوم تتحدث فيها أيضاً عن أثر المشاريع التي قدمت بها في تطور النشاط التجاري الذي كنت جزءاً فعالاً فيه
تحدث باختصار عن إمكانياتك التي يمكن أن تساهم في تطوير الوظيفة المحتملة وقم بطرح بعض الحلول المتاحة لمواجهة بعض المشاكل المفترضة فهذا سيعزز ثقة المسؤولين عن التوظيف وسيرون فيك مكسباً ثميناً ضمن كادرهم الوظيفي وما ستقدمه بين أيديهم من المعلومات المذكورة في سيرتك الذاتية قبل طرحها عليك سيعتبر عامل قوة يدعم المعلومات المكتوبة إضافة إلى التنسيق المميز للسيرة الذاتية كتمييز العناوين والفقرات الرئيسية بخط غامق هذا سيساهم بشكل كبير في لفت الانتباه لمهاراتك وخبراتك
انتقي العبارات المناسبة التي تجعلك تظهر كمحلل بيانات بارع ومحترف تثير اهتمام وإعجاب المختبِرين وابتعد عن التعابير والمصطلحات التي لا فائدة منها واستبدلها بتجارب عملية لابتكارات وحلول قمت بها في مشاريعك وبيِّن مدى تأثيرها على تذليل المشاكل والصعوبات
:Acingالمقابلة
: بعد أن نالت السيرة الذاتية التي قدمتها الإعجاب والقبول ها أنت تتجه إلى المقابلة
: لذا أنت أمام نقطة مفصلية ستحدد مستقبلك المهني فلا تبخل على نفسك في التحضير الجيد للاختبار الحقيقي والحاسم من خلال عدة إرشادات
إن اطلاعك على تفاصيل العمل وحركة الإيرادات والاستراتيجيات المتبعة يتيح لك الإحاطة بالسياسة العامة للشركة وهذا سيسهل عليك تقديم الإجابات المفيدة التي ترضي السائل بما يتوافق مع المضمون المهني الخاص بالشركة
وقد تتعرض في المقابلة إلى أسئلة صعبة لم تكن تتوقع أن تُطرح عليك لذا فالتدرب المتقن على قصتك يدخل في إطار التحضر الجيد لمواجهة هذا النوع من الأسئلة دون أن تظهر عليك علامات التوتر الارتباك اللذان يعتبران عدوك الأول في نجاح مقابلتك وتكر أن الثقة بالنفس هي حليفك الأساسي في ذلك الموقف , تسلح بمهاراتك ومعلومات التقنية وجسدها بشكل عملي عن طريق الشرح التطبيقي أمام لجنة المقابلة
احرص كل الحرص على إظهار اهتمامك ورغبتك الجامحة بالانضمام إلى كادر الشركة وأظهر حماسك في الاستعداد لمواجهة جميع أنواع التحديات التي تعيق تقدم هذه الشركة ووضع كامل خبرتك تحت تصرف مسؤولي الشركة وتوظيفها بأقصى طاقة ممكنة عن طريق تسليط الضوء على مشكلة عامة وتقسيم تلك المشكلة إلى أجزاء ثم معالجة كل جزء على حدى هذا سيعطي انطباعاً إيجابياً عنك ويظهرك على أنك محلل ماهر وبالتالي ستكون فرصتك أكبر
احرص على التواجد في المقابلة في الوقت المحدد ولا تتأخر فيصبح التسيب واللامبالاة هو الانطباع السلبي الأول عنك وإياك ثم إياك والتعجرف والاعتزاز المبالغ فيه بنفسك وبمهاراتك ودع القائمين على المقابلين يرون فيك شخصاً متواضعاً واثقاً , استمع باهتمام إلى الآخرين وتقبل آراءهم وانتقاداتهم برحابة صدر وناقشها معهم باهتمام فأخلاق الجيدة وحُسن تعالمك مع الآخرين مع اعتنائك بأناقتك وبمظهرك الخارجي سيتركان أثراً جميلاً لديهم ولا تنسَ في ختام المقابلة لا تنسَ أن تشكر أعضاء المقابلة على وقتهم ودعهم يرون منك رغبةً جادة للعمل في الشركة
وبهذا نرى بأن التجهيز والتحضير الجيد لمقابلة العمل يمنح المتقدم جرعة من الثقة بالنفس كفيلة بأن تزيل الرهبة التي تفرضها أجواء الاختبارات والمقابلات عموماً
Recently, people have been flocking to study data science, and this science has become the most popular and sought-after science in the last two years.
The demand for higher degrees in data science has spread widely and rapidly, and online training courses have become abundantly available, and it has become increasingly popular to obtain data science certificates, as is the case on Datacamp, Udemy and Coursera sites, thus delving into the field of business accurately and proficiently.
However, this noise began to fade among some skeptics about the extent of the continuity of demand for this type of science.
Some statistics have talked about a diminishing in the size of the huge halo formed by data science compared to the past years and considered that data science was a passing event that will disappear to be replaced by a new, more advanced science.
Through some articles, these statistics dealt with the work of urging researchers to learn data technology to work in a field related to data engineering, the science that will be a continuation of data science, but in an advanced form about it.
One of the researchers says with great passion and interest about the continuity of data science as one of the most important sciences of the era that through his continuous research, a preliminary vision was formed that showed data science workers, especially beginners, who are scattered and confused about the feasibility of continuing to work in this science.
In the midst of this chaos in estimating the extent to which data science can continue at the same pace that it was at in its aspects, we have three questions that we must answer, perhaps they will be the way to cut doubt with certainty:
1) Will data engineering become an inevitable alternative to data science and thus data engineer becomes more in demand than data scientist?
2) With its rapid development, will machine learning technologies take the place of the data scientist?
3) Is the ability to obtain a job in data science still as important as it was in the midst of this rapid development in the data space, both quantitatively and qualitatively.
Comparing data science and data engineering:
The above-mentioned researcher resumes and says: After continuous and diligent research and several comparisons between those who adopt the idea of data engineering dominating data science, which is popular in the near future, and those who see that data science is the main pillar for dealing with data of all kinds, it turns out that the two fields are no less important, one than the other. . In other words, we cannot be certain that data engineering is an alternative to data science.
This conclusion began to be treated by observing the reliance of companies, especially large ones, on data engineers to deal with various types of data and employ them for optimal use.
Then comes the role of data scientists, as the analysts transform that data into a profitable component by which these companies reach the desired result.
With this important role of data scientists in creating the profitable value of organizations, they were not able to deal with the huge amount of random data flowing in a short time. These two functions are complementary to each other and each has its own mission.
The merits of this research create for us an important question that cannot be overlooked, is it possible for automation to take the role of data scientists?
The answer to this question leads us to identify the effectiveness of the tools that companies adopt in building their predictive models, and can these tools perform the tasks of data scientists? For example, can DataRobot technology help analysts produce predictive models like data scientists do without machine learning?
By delving deeply into the effectiveness of this tool specifically, we arrive at two points:
1) This tool has complete flexibility to use, especially with regard to importing data in all its formats and dealing with it quite easily.
2) This tool can find the typical value from among a set of branched data to produce a final value with high accuracy, which saves time and effort.
With these distinct capabilities of machine learning, it is not possible in any way to complete the work without the expertise of data scientists in the long run, as their task in accomplishing other tasks such as adding weights for features and some other functions that prepare to complete the work cannot be neglected in one way or another.
Each stage of data processing has a special function, and this is what data scientists do in terms of detailing, sorting and coordinating data according to the data and requirements. Hence, the consolidation of the essential role of human judgment when dealing with these technologies, however, it is difficult to automate a large part of the jobs by data scientists.
All these data confirm that the availability of human expertise when working with software technologies that speed up the completion of tasks makes the work integrated and indivisible, and therefore neither of them can replace the other.
And by highlighting the content of our research comes the most important question: Is there still demand for data scientists?
Statistics for the year 2020 prove that one person can produce data at a rate of 1.7 megabytes per second.
Data has an effective role in developing the industrial structure in all its forms, including, for example, following up on marketing operations so that through data points we can develop the progress of the marketing process, reach optimal targeting plans, and monitor the audience’s interaction with the marketing material.
All of these tasks cannot be performed by the data analyst alone. Automated and software techniques have a major role in accomplishing these functions, but they cannot negate the role of the data analyst and his practical experience in completing the required work. What distinguishes the data scientist is his practical skills that are completely different from the data science students from Theoretically.
Practical experience is the basis for dealing with data. The summary of benefiting from theoretical information is to employ it practically on the ground and the art of dealing with all possibilities and finding a solution to the obstacles that a data scientist encounters during his work. If this person possesses those skills, his scientific and practical value cannot be ignored.
We conclude from the foregoing that all the development of information technology is not able in any way to cancel data science and therefore talk about the beginning of the disappearance of this science is unfounded.
We have seen that companies still rely on data science experts to find solutions and overcome obstacles that machine learning cannot accomplish alone, but in addition to that, there is no automated technology that can take the role of a data scientist with its expertise and skills.
Advertisements
هل سيستمر الطلب على علماء البيانات في عام 2024 ؟
Advertisements
أصبح الناس يتهافتون في الآونة الأخيرة على دراسة علم البيانات وأصبح هذا العلم علم العصر والأكثر شيوعاً وطلباً في السنتين الأخيرتين . وانتشر الطلب على الشهادات العليا في علوم البيانات على نطاق واسع وبشكل متسارع وتوفرت الدورات التدريبية على شبكة الإنترنت بكثرة وأصبح الإقبال عليها بشكل متزايد للحصول على شهادات علم البيانات
Datacamp و Udemy و Coursera كما هو الحال على مواقع
وبالتالي الخوض في مجال الأعمال بدقة وإتقان
إلا أن هذا الضجيج بدأت يتخافت عند بعض المشككين في مدى استمرارية الطلب على هذا النوع من العلوم
فقد تحدثت بعض الإحصائيات عن تضاؤل في حجم الهالة الضخمة التي شكلها علم البيانات مقارنة بالسنوات المنصرمة واعتبرت أن علم البيانات كان حدثاً عابراً سيختفي ليحل مكانه علم جديد أكثر تطوراً
وقد تناولت هذه الإحصائيات عبر بعض المقالات العمل على حث الباحثين عن تعلم تكنولوجيا البيانات على العمل في مجال يخص هندسة البيانات العلم الذي سيكون استمراراً لعلم البيانات ولكن بشكل مطوّر عنها . يقول أحد الباحثين بشغف واهتمام كبيرين عن مدى استمرارية علم البيانات كأحد أهم علوم العصر أنه من خلال بحثه المستمر تشكلت عنده رؤية أولية أظهرت العاملين في علم البيانات وخاصة المبتدئين مشتتين وهم في حيرة من أمرهم حيال جدوى الاستمرار في العمل في هذا العلم
وفي خضم هذه الفوضى في تقدير مدى قابلية علم البيانات على الاستمرار بنفس الوتيرة التي كان عليها في أوجه تتشكل لدينا ثلاثة أسئلة يتحتم علينا الإجابة عليها لعلها تكون السبيل لقطع الشك باليقين
هل ستصبح هندسة البيانات بديلاً حتمياً لعلم البيانات وبالتالي يصبح مهندس البيانات أكثر طلباً من عالِم البيانات ؟ *
مع تطورها بشكل متسارع هل ستأخذ تقنيات التعلم الآلي مكان عالِم البيانات ؟ *
هل ما زالت قابلية الحصول على وظيفة في علم البيانات بنفس الأهمية التي كانت عليها في خضم هذا التطور المتسارع في فضاء البيانات كماً ونوعاً
وبالمقارنة بين علم البيانات وهندسة البينات
يستأنف الباحث المذكور أعلاه ويقول : بعد البحث المستمر والدؤوب وإجراءات عدة مقارنات بين المتبنين لفكرة سيطرة هندسة البيانات على علم البيانات هي الرائجة في المستقبل القريب وبين من يرون أن علم البيانات هو الركيزة الأساسية للتعامل مع البيانات بكافة أنواعها تبين أن المجالين لا تقل أهمية أحدهما عن الآخر . بمعنى آخر لا نستطيع أن نجزم أن هندسة البيانات هي بديل عن علم البيانات
هذا الاستنتاج بدأت تتضح معامله من خلال ملاحظة اعتماد الشركات ولاسيما الكبرى منها على مهندسي البيانات للتعامل مع مختلف أنواع البيانات وتوظيفها للاستخدام الأمثل ثم يأتي دور علماء البيانات إذ يقوم المحللون بتحويل تلك البيانات إلى مكوِّن ربحي تصل به تلك الشركات إلى النتيجة المرجوة
ومع هذا الدور المهم لعلماء البيانات في تكوين القيمة الربحية للمؤسسات إلا أنهم لم يكونوا قادرين على التعامل مع الكم الهائل من البيانات العشوائية المتدفقة خلال وقت قصير فالتحضير النموذجي لتلك البيانات لم يكن مثالياً بما يكفي مما اضطر هذه الفعاليات التجارية بالاستعانة بمهندسي البيانات ومن هنا تنطلق نظرية أن هتين الوظيفيتين مكملتان لبعضهما ولكل منهما مهمته الخاصة
تخلق لنا حيثيات هذا البحث استفساراً مهماً لا يمكن التغاضي عنه هو هل يمكن للأتمتة أن تأخذ دور علماء البيانات ؟ تقودنا الإجابة عن هذا السؤال إلى التعرف على فاعلية الأدوات التي تعتمدها الشركات في بناء نماذجها التنبؤية وهل يمكن لهذه الأدوات أن تقوم بمهام علماء البيانات ؟
DataRobot فعلى سبيل المثال هل يمكن لتقنية
أن تساعد المحللين على إنتاج نماذج تنبؤية كتلك التي يقوم بها علماء البيانات بالاستغناء عن تقنيات التعلم الآلي ؟
: وبالخوض عميقاً بمدى فاعلية هذه الأداة على وجه التحديد نتوصل إلى نقطتين
تتمتع هذه الأداة بمرونة تامة بالاستخدام وخاصة فيما يتعلق باستيراد البيانات بكافة تنسيقاتها والتعامل معها بسهولة تامة *
بإمكان هذه الأداة إيجاد القيمة النموذجية من بين مجموعة بيانات متفرعة لإخراج قيمة نهائية بدقة عالية مما يوفر من الوقت والجهد *
ومع هذه الإمكانيات المتميزة للتعلم الآلي لا يمكن بشكل من الأشكال من إتمام العمل بدون خبرات علماء البيانات على المدى البعيد , إذ أن مهمتهم في إنجاز المهام الأخرى كإضافة الأوزان للميزات وبعض الوظائف الأخرى التي تهيء لإتمام العمل لا يمكن إهمالها بشكل أو بآخر
فلكل مرحلة من مراحل معالجة البيانات وظيفة خاصة وهذا ما يفعله علما البيانات من تفصيل وفرز وتنسيق للبيانات وفقاً للمعطيات والمتطلبات ومن هنا يأتي ترسيخ الدور الأساسي للتقدير البشري عند التعامل مع تلك التقنيات ومع هذا من الصعب أتمتة جزء كبير من الوظائف من قِبل علماء البيانات
كل هذه المعطيات تؤكد أن توفر الخبرة البشرية عند العمل بالتقنيات البرمجية التي تسرع إنجاز المهام يجعل العمل متكامل لا يتجزأ وبالتالي لا يمكن لأحدهما أن يحل مكان الآخر
وبتسليط الضوء على مضمون بحثنا يأتي السؤال الأهم : هل مازال الطلب على علماء البيانات ؟
أثبتت إحصائيات عام 2020 أن بمقدور الشخص الواحد إنتاج بيانات بمعدل 1.7 ميغا بايت في الثانية
وللبيانات دور فعال في تطوير البنية الصناعية بشتى أشكالها بما فيها على سبيل المثال متابعة عمليات التسويق بحيث نستطيع من خلال نقاط البيانات تطوير سير العملية التسويقية والوصول إلى خطط الاستهداف الأمثل و مراقبة تفاعل الجمهور مع المادة التسويقية
كل هذه المهام لا يمكن لمحلل البيانات القيام بها بمفرده فالتقنيات الآلية والبرمجية لها دور كبير في إنجاز تلك الوظائف لكنها لا يمكن لها أن تلغي دور محلل البيانات وخبرته العملية في إتمام العمل المطلوب فما يميز عالِم البيانات هو مهاراته العملية التي تختلف تماماً عن دارسي علم البيانات من الناحية النظرية
فالخبرة العملية هي الأساس في التعامل مع البيانات فخلاصة الاستفادة من المعلومات النظرية هو توظيفها عملياً على أرض الواقع وفن التعامل مع كافة الاحتمالات وإيجاد حل للعوائق التي تعترض عالِم البيانات أثناء عمله فإن كان هذا الشخص يمتلك تلك المهارات فلا يمكن تجاهل قيمته العلمية والعملية
نستنتج من خلال ما سبق أن كل ما تشهده تكنولوجيا المعلومات من تطور لا يمكن لها بشكل من الأشكال أن تلغي علم البيانات وبالتالي الحديث عن بدء تلاشي هذا العلم لا أساس له من الصحة
ورأينا أن الشركات لازالت تعتمد على خبراء علم البيانات في إيجاد الحلول وتذليل العوائق التي لا يمكن للتعلم الآلي أن ينجزها بمفرده بل أضف إلى ذلك أنه لا يوجد تقنية آلية يمكنها أن تأخذ دور عالِم البيانات بما يمتلك من خبرات ومهارات
According to estimates from the Small Business Administration, more than 627,000 new businesses are opened every year. One of the most challenging aspects of starting a new business is figuring out how to fund it. Fortunately, grants and programs exist to help new business owners get started. Read on for some tips, courtesy of Data World.
Government Grants
The federal government offers thousands of grants for companies with a variety of backgrounds. A good place to begin your search for government grants is the Grants.gov website. In addition to the various grant programs offered by the federal government, many state and local governments have their own programs.
Small Business Innovation Research Program
The SBIR provides grants to small businesses interested in contributing to federal research and development that has the potential for future commercialization. This highly competitive, awards-based program aims to assist businesses with achieving technological innovation and scientific excellence. To qualify, your company must be a for-profit company that is more than 50% controlled and owned by citizens or permanent residents of the United States and has no more than 500 employees. The SBIR website offers a series of courses that include information about the program and how to apply.
Advertisements
U.S. Department of Commerce Minority Business Development Agency
The MBDA offers grants and loans to help minority-owned businesses. You can find out more information about available grants and application procedures by contacting your state or local MBDA Business Center.
The United States Economic Development Administration
The EDA is part of the U.S. Department of Commerce and funds businesses that support national and regional economic development. Examples of businesses that can apply include construction, technical assistance, planning, higher education, and research and evaluation. Funding opportunities and deadlines change. You can find the latest information on the website.
Corporate Small Business Grants
Many large companies offer small-business grants as a philanthropic effort. Some of these grants are only for nonprofit businesses, but for-profit ventures can also qualify for some programs. One example is the FedEx Small Business Grant Contest. This annual contest awards $250,000 to 12 small businesses. U.S.-based for-profit companies with fewer than 100 employees are eligible to apply after six months in operation.
Members of the National Association for the Self-Employed can apply on the NASE website for monthly grants up to $4,000. Applications are reviewed in April, July, October and January. Grants are approved based on need, use and the potential impact of the grant on the business.
Handling Other Administrative Details Like Forming an LLC
In addition to finding funding, there are a variety of administrative details you must take care of to legally operate your business. Choosing what type of legal entity to operate your business under is one such task.
Organizing as a limited liability company can save you money on taxes, save you time on paperwork, provide greater flexibility and protect your personal assets from claims by business creditors. The regulations vary by state, so it can be useful to utilize a formation service to make sure you get all the details correct. These services are familiar with the rules and regulations and can save you from having to do the LLC registration legwork yourself. They are also usually less expensive than hiring an attorney.
These are just a few of the resources available to entrepreneurs. Your local chamber of commerce, small business administration office and any professional organizations you belong to are good resources for additional funding information.
كيف تساهم القروض الصغيرة في أمريكا بإنشاء مشاريع جديدة
Advertisements
وفقاً لتقديرات إدارة الأعمال الصغيرة ، يتم افتتاح أكثر من 627000 شركة جديدة كل عام , أحد أكثر الجوانب صعوبة لبدء عمل جديد هو معرفة كيفية تمويله . لحسن الحظ توجد المنح والبرامج لمساعدة أصحاب الأعمال الجدد على البدء
Data World اقرأ للحصول على بعض النصائح ، بإذن من
المنح الحكومية
تقدم الحكومة الفيدرالية آلاف المنح للشركات ذات الخلفيات المتنوعة.
Grants.gov مكان جيد لبدء البحث عن المنح الحكومية هو موقع
بالإضافة إلى برامج المنح المختلفة التي تقدمها الحكومة الفيدرالية ، فإن العديد من حكومات الولايات والحكومات المحلية لديها برامجها الخاصة
برنامج أبحاث ابتكار الأعمال الصغيرة
منحًا للشركات الصغيرة SBIR يقدم
المهتمة بالمساهمة في البحث والتطوير الفيدرالي الذي لديه القدرة على التسويق في المستقبل . يهدف هذا البرنامج عالي التنافسية والقائم على الجوائز إلى مساعدة الشركات على تحقيق الابتكار التكنولوجي والتميز العلمي. ولتكون مؤهلاً للحصول على القرض يجب أن تكون شركتك شركة ربحية مملوكة بنسبة تزيد عن 50٪ ويملكها مواطنون أو مقيمون دائمون في الولايات المتحدة وليس لديها أكثر من 500 موظف
الإلكتروني SBIR يقدم موقع
سلسلة من الدورات التدريبية التي تتضمن معلومات حول البرنامج وكيفية التقديم
Advertisements
وكالة تطوير أعمال الأقليات التابعة لوزارة التجارة الأمريكية
المنح والقروض MBDA تقدم
لمساعدة الشركات المملوكة للأقليات
يمكنك العثور على مزيد من المعلومات حول المنح
وإجراءات التقديم المتاحة عن طريق الاتصال
المحلي أو ولايتك MBDA بمركز أعمال
إدارة التنمية الاقتصادية بالولايات المتحدة
تعد وكالة الإمارات للغوص جزءًا من وزارة التجارة الأمريكية وتمول الشركات التي تدعم التنمية الاقتصادية الوطنية والإقليمية. تشمل أمثلة الشركات التي يمكن تطبيقها البناء ، والمساعدة الفنية ، والتخطيط ، والتعليم العالي ، والبحث والتقييم. تغيير فرص التمويل والمواعيد النهائية. يمكنك العثور على أحدث المعلومات على الموقع
منح الشركات الصغيرة
تقدم العديد من الشركات الكبيرة منحًا للأعمال الصغيرة كجهد خيري. بعض هذه المنح مخصصة فقط للأعمال غير الربحية ، ولكن يمكن أيضًا أن تتأهل المشاريع الربحية لبعض البرامج
FedEx Small Business Grant أحد الأمثلة هو مسابقة
تمنح هذه المسابقة السنوية 250000 دولار إلى 12 شركة صغيرة. الشركات التي تتخذ من الولايات المتحدة مقراً لها والتي يعمل بها أقل من 100 موظف مؤهلة للتقدم بعد ستة أشهر من العمل
يمكن لأعضاء الجمعية الوطنية لأصحاب الأعمال الحرة
للحصول على منح شهرية NASE التقدم على موقع
تصل إلى 4000 دولار. تتم مراجعة الطلبات في أبريل ويوليو وأكتوبر ويناير. تتم الموافقة على المنح بناءً على الحاجة والاستخدام والأثر المحتمل للمنحة على الأعمال
التعامل مع التفاصيل الإدارية الأخرى مثل تشكيل شركة ذات مسؤولية محدودة
بالإضافة إلى العثور على التمويل ، هناك مجموعة متنوعة من التفاصيل الإدارية التي يجب عليك الاهتمام بها لتشغيل عملك بشكل قانوني. يعد اختيار نوع الكيان القانوني الذي ستدير عملك في إطاره إحدى هذه المهام
يمكن للتنظيم كشركة ذات مسؤولية محدودة أن يوفر لك المال على الضرائب ، ويوفر لك الوقت في الأعمال الورقية ، ويوفر قدرًا أكبر من المرونة ويحمي أصولك الشخصية من مطالبات الدائنين التجاريين. تختلف اللوائح حسب الولاية ، لذلك قد يكون من المفيد الاستفادة من خدمة التشكيل للتأكد من حصولك على جميع التفاصيل بشكل صحيح. هذه الخدمات على دراية بالقواعد واللوائح ويمكن أن توفر عليك من الاضطرار
بنفسك LLC إلى القيام بأعمال تسجيل
كما أنها عادة ما تكون أقل تكلفة من التعاقد مع محام
هذه ليست سوى عدد قليل من الموارد المتاحة لرجال الأعمال. تعد غرفة التجارة المحلية ومكتب إدارة الأعمال الصغيرة وأي منظمات مهنية تنتمي إليها موارد جيدة للحصول على معلومات تمويل إضافية.
At this point, we will apply our neural network to a working model and verify its correctness after we have completed our Python codes to perform forward and backward progression.
It is worth noting that our neural network must be programmed automatically to recognize the appropriate weights to perform this task.
By applying the neural network for 1500 iterations, we notice that the value of the loss gradually decreases for each iteration, according to what is shown in the graph, which is in line with the aforementioned algorithm.
So the final prediction result for the 1500-repeat neural network is as follows:
Predictions after 1500 training iterations
By comparing the predictions with the real values, we find that there is agreement between them with a slight difference. This means that the training of the neural network was successful due to the forward and backward algorithm.
Advertisements
Neural Network Summary
Advertisements
في هذه المرحلة سنقوم بتطبيق الشبكة العصبية الخاصة بنا على نموذج عملي ونتأكد من صحتها وذلك بعد أن اكتملت لدينا أكواد البايثون المخصصة لإجراء التقدم للأمام والعودة إلى الخلف
من الجدير بالذكر أنه يجب أن تبرمج شبكتنا العصبية تلقائياً على التعرف على الأوزان المناسبة لأداء هذه المهمة
وبالتطبيق العملي على الشبكة العصبية لـ 1500 تكرار نلاحظ أن قيمة الخسارة تنخفض تدريجياً لكل تكرار وفق ما هو موضح في المخطط البياني وهو ما يتماشى مع الخوارزمية المذكورة آنفاً
: لتصبح نتيجة التنبؤ النهائية للشبكة العصبية المكونة من 1500 تكرار على النحو التالي
تنبؤات بعد 1500 تدريب
بمقارنة التنبؤات مع القيم الحقيقة نجد أن هناك توافق بينهما مع وجود اختلاف بسيط هذا يعني أن تدريب الشبكة العصبية تكلل بالنجاح بفعل الخوارزمية الخاصة بالتقدم للأمام والرجوع إلى الخلف
After finding the errors and deviations in the data values, we must adjust the appropriate value for the weights and biases through the derivative of the deviation function related to them, which indicates the slope of the function in calculus.
Gradient Regression Algorithm
If the value of the derivative is known to us, we reset the ratios of weights and biases by raising or decreasing those ratios, but this is not enough to calculate the derivative of the skew function directly in terms of weights and biases because their value does not exist in the equation that represents them, so it is necessary to use the law of the serial scale to reach the solution .
This mathematical equation may seem somewhat complicated, but it is the only way to lead us to the correct solution. For simplicity, we have shown the partial derivative of a single-layer Neural Network. After we extract this result, we add the backpropagation task in the Python code for our case.
And in the following video tutorial, a detailed explanation of the law of the serial scale in backpropagation and the application of calculus is provided by 3Blue1Brown
Advertisements
Backpropagation
Advertisements
بعد العثور على الأخطاء والانحرافات في قيم البيانات يتوجب علينا ضبط القيمة المناسبة للأوزان والتحيزات من خلال مشتق دالة الانحراف المتعلقة بهما والتي تدل على ميل الدالة بحساب التفاضل والتكامل
خوازمية انحدار التدرج
إذا كانت قيمة المشتق معلومة لدينا فنقوم بإعادة تعيين نسب الأوزان والتحيزات عن طريق رفع تلك النسب أو خفضها إلا أن هذا لا يكفي لحساب مشتق دالة الانحراف مباشرةً بدلالة الأوزان والتحيزات لأن قيمتهما غير موجودة في المعادلة الممثلة لها لذلك لابد من الاستعانة بقانون المقياس التسلسلي للوصول إلى الحل
قد تبدو هذه المعادلة الحسابية معقدة نوعاً ما لكنها السبيل الوحيد لإيصالنا إلى الحل السليم وعلى سبيل التبسيط قمنا إظهار المشتق الجزئي
In the previous article, we had talked about the concept of Neural Network and how to manipulate weights and biases to get more accurate results based largely on finding the Loss function.
This is done by using the tool for assessing the general variance of the data set from its mean, which is called sum-of-sqaures, which is a statistical measure of deviation from the mean in the data set, which is shown by the equation:
The sum of the variance between the predictive values and the real value is what we call the term sum of squares error, and this is done by squaring the difference by measuring its absolute value.
Through this study we can find accurate formulas for weights and biases that avoid as much as possible the loss of a job that could create a problem in reaching correct results.
Advertisements
Loss Function
Advertisements
كنا قد تحدثنا في المقال السابق عن مفهوم
وكيفية التعامل مع الأوزان Neural Network
والتحيزات للحصول على نتائج أكثر دقة تعتمد
Loss function بشكل كبير على العثور على
التي تعرقل الحصول على تلك النتائج ومعالجتها
بالشكل الصحيح ويتم ذلك باستخدام أداة تقييم التباين
العام لمجموعة البيانات من وسطها والتي
والتي تعتبر مقياس إحصائي sum-of-sqaures تسمى
للانحراف عن المتوسط في مجموعة البيانات
: والموضوح بالمعادلة
فحاصل التباين بين القيم التنبؤية والقيمة الحقيقة هو ما نطلق عليه مصطلح خطأ مجموع المربعات ويتم ذلك بتربيع الفرق بقياس قيمته المطلقة . ومن خلال هذه الدراسة يمكننا إيجاد صيغ دقيقة للأوزان والتحيزات التي تجنبنا قدر الإمكان من فقدان وظيفة يمكن أن تخلق مشكلة في الوصول إلى نتائج صحيحة
The general concept of the work of this system can be summarized by analogy with the work system of the brain, which depends for its content on a mathematical mechanism based on several inputs that determine the structure of the required results.
Accordingly, we can define the components of the Neural Network:
input layer x
Irregular hidden layers
output layer ŷ
Different equilibriums between classes w and b
Determine the sigmoid activation function of the hidden layers σ.
Often when calculating the number of Neural Network layers the input layer is ignored as shown in this two-layer Neural Network architecture diagram :
It is easy to create a Neural Network in Python:
Neural Network Training:
The value of ŷ for a simple two-layer Neural Network is derived by the following equation:
It is clear from the previous equation that the values of the variables represented by the weights w and the biases b, after careful tuning of their values, determine the output of ŷ, which represents the output value, and this is known as the Neural Network training.
We can divide each iteration of the training process into the following stages:
• The stage of calculating the value of the outputs, defined as: feedforward
• The stage of updating the values of w and b, defined as: backpropagation
This is what the sequential graph shows :
feedforward
The above graph shows that Feedforward is a simple calculus and accordingly the output of a two-layer Neural Network is :
By adding the basic task of Feedforward in the Python code in our previous case, assuming that the value of biases is zero, that is, it is equal to zero, we get:
However, we have to find a more accurate method for our predictions.. This method is provided by the Loss Function property that we will learn about in the next essay .
Advertisements
؟ Neural Network ما هو مفهوم
Advertisements
يمكن تلخيص المفهوم العام لعمل هذه المنظومة بتشبيهها بمنظومة عمل الدماغ التي تعتمد بمضمونها على آلية رياضية مبنية على عدة مدخلات تحدد هيكلية النتائج المطلوبة
A tool that makes data integration simplified and more effective, and it is free and open source of the ETL style, meaning that its function is to organize and coordinate raw, unstructured information and transform it into ready-made data for practical analysis. It has the ability to develop and manage its applications to the fullest extent, as it contains a central store of data with the ability to deal with metadata, making it the ideal tool for performing all analysis techniques with high efficiency and accuracy.
It is a free and open source NoSQL database, and it is the ideal tool for analyzing big data with an expansive feature, which in turn works to avoid errors during the analysis process, thus obtaining accurate and more effective results.
The main features of this tool are summarized in the following points:
• Its properties are somewhat similar to SQL, including the query language.
• Provides a wide display area, especially for writing operations.
• The ability to spread securely because it is not restricted to a central server.
• Easy system of data.
• The ability to replicate patterns and the flexibility of modification and coordination.
Advertisements
Apache Cassandra : أدوات تحليل البيانات الضخمة
الأداة الثامنة
Advertisements
وهي عبارة عن قاعدة بيانات مفتوحة المصدر
NoSQL ومجانية من نمط
وهي الأداة الأمثل لتحليل البيانات الضخمة ذات الخاصية التوسعية والتي تعمل بدورها على تفادي حدوث خلل أثناء عملية التحليل وبالتالي الحصول على نتائج دقيقة وأكثر فاعلية
: تتلخص أبرز ميزات هذه الأداة بالنقاط التالية
بما فيها لغة الاستعلام SQL خصائصها تشبه إلى حد ما *
توفر مساحة عرض واسعة ولاسيما لعمليات الكتابة *
قابلية الانتشار الآمن نظراً لعدم تقييده بسيرفر مركزي *
This tool enables the processing of ETL solutions and various types of data as it is based on the processing of the basic database set. High security and flexibility of data transformation in addition to the fact that it contains a REST application programming panel. All these features and capabilities make Xplenty a platform that provides high efficiency and complete flexibility for big data analysts.
It is considered one of the most important database control systems and it is an open source analysis tool designed to deal with columns from Yandex and by means of large coordinated data it allows its users to perform analytical queries within a short period of time.
It is one of the distinguished tools in dealing with big data and preferred by many analysts to work on all general analytical functions such as: Presto, Spark, Impala, and in general in dealing with databases represented by columns with the flexibility of controlling the master keys and procedures for deleting unnecessary data, as is the case in InfluxDB.
ClickHouse is based on its own SQL language and includes many graphical extensions such as high-format tasks, data models, interlaced data forms, URL-compatibility functions, probability algorithms, various mechanisms for working with dictionaries, formatting schemas formed from working on Apache Kafka, aggregation tasks, designing visualizations saved with their formatting, and many more the other.
Advertisements
: أدوات تحليل البيانات الضخمة
Clickhouse
الأداة السادسة
Advertisements
يعتبر من أهم أنظمة التحكم بقواعد البيانات
وهو أداة تحليل مفتوحة المصدر
Yandex مصممة للتعامل مع الأعمدة من
وبواسطة البيانات الضخمة المنسقة يتيح لمستخدميه
القيام باستعلامات تحليلية خلال فترة وجيزة
وهو من الأدوات المميزة في التعامل مع البيانات الضخمة
ويفضله الكثير من المحللين للعمل على كافة الوظائف التحليلية
Presto و Spark و Impala : العامة مثل
وإجمالاً في التعامل مع قواعد البيانات الممثلة
بالأعمدة مع مرونة التحكم بالمفاتيح الرئيسية وإجراءات حذف البيانات
InfluxDB غير الضرورية كما هو الحال في
المخصصة لها SQL على لغة ClickHouse تعتمد
فهي تتضمن العديد من اللواحق البيانية
كالمهام عالية التنسيق ونماذج البيانات وأشكال البيانات المتشابكة
An effective tool in developing the analysis steps and making them more advanced, as Airflow is considered code in the Python language.
5. Apache Parquet
Apache Parquet is a dual-column, big data-architecture designed for Hadoop that allows it to represent compressed data by controlling new codes as they appear at the column level. Parquet is a popular environment for big data analysts and is used in Spark and Kafka and Hadoop.
Advertisements
الأداتين الرابعة والخامسة من أدوات تحليل البيانات الضخمة
Apache Airflow – Apache Parquet
Advertisements
4. Apache Airflow
أداة فعالة في تطوير خطوات التحليل وجعلها أكثر تقدماً
It is one of the open source tools that are highly efficient in analyzing big data due to its reliance on distributed computing technology in RAM, which speeds up the processing process and gives more accurate and effective results.
Spark is a suitable environment for many big data analysis professionals, especially for many giant companies such as eBay, Yahoo and Amazon due to the development of this tool for many functions used in analysis techniques such as iterative algorithms and data flow processing, as this tool mainly depends on Hadoop, the advanced system for MapReduce
Superset is a data visualization technology that is done with the help of a group of other components. It is a suitable environment for designing control panels and confirming customer membership through OAuth, OpenID or LDAP. Its characteristics are consistent with most data sources designated to work on SQL program, and its features work in full compatibility with Apache ECharts.
Many giant companies such as Netflix, Airbnb, Twitter, Airbnb, and Lyft rely on Superset technology primarily to analyze their products due to its use in MediaWiki.
An integrated set of programs specialized in dealing with big data, application programming interfaces, and the techniques necessary to develop them, which are free and open source.
This tool consists of four sections:
YARN is a technology dedicated to handling data sets.
HDFS is a categorized file system that is built to run on standard devices.
A programming environment that enables other units to be compatible with HDFS.
MapReduce is an algorithmic pattern used for parallel computation provided by Google.
There are many tools dedicated to big data analysis on different software providers such as Microsoft, IBM and Oracle, and they are widely used by analysts of this type of data
Especially the open source programs that the largest companies rely on to analyze their products. There are also free tools such as Apache Hadoop, which are classified from the free Apache environment.
In the upcoming articles, we will discuss the big data analysis tools, each separately
Recently, with the advancement of science and technology, there have been many questions about techniques for dealing with big data, through which we can predict customer behavior, control resources, expand sales, thwart emergency conditions that hinder the progress of any business, and control fraud, in addition to making the daily transactions of many people more flexible and easy.
The term “big data” was given to a database that contains several rows or random data related to a topic, or techniques that deal with many inquiries at the same time.
Several years ago, the discussion of big data was not so important that even some data science professionals did not have a sufficient understanding of how to deal with the exact structure of this type of data.
Big data in its concept does not embody the data itself :
The concept of big data is not limited to the data itself, but goes beyond it to strategies related to dealing with that data, with another prevention, which is to find an effective mechanism to process a random set of information related to the activity of any government agency or commercial company, regardless of the amount of that information through which technicians and specialists can find The best organizational methods for converting that information into useful data conducive to overcoming all obstacles to the smooth functioning of that activity.
Moreover, according to the new concept of big data, it is considered the best way to get rid of the traditional pattern of effective relationships and transactions in the development of machine learning techniques and its branches, so that big data technicians and specialists receive greater attention and support compared to programming specialists and data scientists in general. Dealing with this large amount of data Data of all kinds leads to accurate and effective analysis and leads to following the right strategies in investing time and effort at the lowest costs to serve commercial or industrial activity or both for major international companies.
We will deal as a living model plan of a particular company planning to carry out advertising campaigns on a large scale or a company planning to evaluate its sales movement. The best option to implement these strategies that fall under the name of business intelligence is the use of big data as a model solution to implement these projects more effectively by using more accurate and professional techniques provided by this Type of data analysis.
This is done to deal with big data through several steps, and data preparation is one of the most important basics of the analysis process, which consumes the most time from the total integrated system for data analysis.
data collection :
The data is collected as a first stage by special tools from multiple sources and then stored on a file in its basic position without making any change in the properties because any change or transformation of information loses some of its features and thus reduces the efficiency of the analysis.
data selection
To explain the concept of data selection, we turn, in an illustrative example, to a promotional plan that is presented to customers for SIM products to be sold before the start of the school season, based on the analyzes of sales movement in the previous year. Based on previous analyzes without neglecting to rely on forecasting according to the surrounding developments and variables.
Here comes the role of data analysts in identifying the subgroups of the common data set, which are relied upon to find the best way to produce good results.
Clean the raw data:
This step includes filtering and processing unstructured, unformatted, or error-containing data, eliminating duplicates, if any, and analyzing them to take the form of useful and required information.
Data Enhancement and Integration:
Data is supplemented from local data sources or various other data sources (databases or information systems) and their aggregation is included when calculating new values such that a game company collects and analyzes documents produced by games to gain insights into usage behavior and customer preferences so that it can produce plans to enhance the likelihood of opportunities Selling by developing new features that drive the growth of their business forward.
Data Format :
Sometimes it may require doing data formatting without modifying its values, such as sorting data with specific numbering and encoding, shortening long terms, and removing unnecessary punctuation marks in text cells.
Activate the role of forecasters
At this stage, the derived features are built and directed to work on the machine learning technology so that they are employed to raise the efficiency of the higher education algorithm and then deal with it by the forecasters.
Create an analytic model:
Since the model is a method of seeing data, this requires creating an analytical model to predict the required variable. For example, we can say that sorting is the collection of items with similar characteristics into subgroups according to certain criteria.
At this point, for the sake of clarity, we can sort customer groups based on the behavior of their customers: sports interests, vegetarians, etc. through tools designed for this purpose (such as IBM SPSS) via the built-in databases.
In practice, models that include machine learning characteristics are used to transfer the current analyzes to the future for the purpose of comparing them with reality and other samples. .
In general, this type of analysis requires analysts to devise a different method to apply it to the data because there is a state of chaos in the organization of the data resulting from not organizing and coordinating it well. Therefore, block analysis and machine learning are related to the variables created by the existing situation, so they invent a new method by writing more effective software codes. Contributes to bug fixing and rectification of errors.
As a last step in this analysis, it is possible to build control panels and charts due to the presence of a small number of data capable of graphic representation.
The ideal tool for text finding and sentiment analysis
Experience Level : Beginner to Intermediate
This tool is specifically designed to deal with qualitative data such as interviews, available survey questions and comments on social media. This tool also allows to perform complex functions such as sentiment analysis, especially for people who do not have experience in dealing with programming techniques.
ATLAS.ti program has a number of features, including:
• Sentiment Analysis
• wordlist
• Word cloud
• Synonyms
• Entity recognition
• Display Features
• Find texts
• Sorting by name, adjective, and others.
This tool enables its users to upload images and videos for multimedia analytics and works in full compliance with geo-data and maps.
However, its main drawback is that sentiment analysis is available in only four languages: German, English, Spanish and Portuguese, in addition to its monthly subscription starting at $35 for non-commercial use.
Some examples of ATLAS.ti usage:
1- This idea is based on observing the feelings of people who are subject to a social experience after watching videos expressing those feelings by writing or drawing that determines their impression and behavior and the extent of the impact of this viewing, so ATLAS.ti is the most appropriate tool to do this task to the fullest.
2- Organizing data: This tool can easily be relied on to find texts without resorting to programming, especially for people who do not prefer dealing with the Python language, as if you need to find some views of recordings from a series of personal interviews you have previously conducted.
We conclude from the above:
Data analysts usually prefer to use several tools to deal with data of different content and content. Each tool has a specific task within an integrated data analysis system, some of which need to deal with Excel, ATLAS.ti and SPSS as uses for data analysis related to social sciences, and some need to deal with Excel Polymer Search and Akkio, as is the case with digital marketers and what distinguishes dealing with all these tools is the availability of free trial versions in case the data analyst is not able to accurately determine the type of tool to use for a pattern of data.
Ideal for creating interactive graphs, dashboards, and data processing.
Experience Level: Beginner to Intermediate
An alternative to Tableau but has the advantage of using the BI package with the widest options for data visualization and charting
Also, it is not necessary to use code, but it gives the option to use the relatively powerful DAX language that programmers who use code.
In addition, it has flexibility in data processing and cleaning, easy compatibility with other Microsoft products, and compatibility with working with R & Python to build models.
A Power BI subscription starts at $9.99 per month, so it’s less expensive than other programs.
Thus, we conclude that the two tools Tableau and Power BI are suitable for business intelligence, but what distinguishes Power BI is that it is better for data processing and less costly, as mentioned earlier.
The ideal tool for creating dashboards, interactive charts, and master data cleaning
Experience Level : Beginner to Intermediate.
Tableau is the perfect choice for designing elegant, high-tech infographics and is characterized by its ability to create information control panels without the need to use codes. It allows data analysts to send that data to people who are inexperienced in dealing with technology. It also allows them, through interactive control panels, to easily follow that information. complete.
The disadvantages of this program are that, despite its ability to analyze data, it does not have the efficiency to process random data that requires a thorough cleaning, which is often Python and R are the most appropriate options for this task, in addition, it often targets large companies, as its prices start from 70 dollars per month.
To illustrate the use of Tableau features in work, for example, every data analyst or data scientist in general sends results and reports to executives, and those reports must be attractive, interactive, customizable, and have the flexibility of access to others, and with the BI feature, you can create charts and visualizations with its ability to easily Join multiple tables, detail and analyze data with complete flexibility by dragging and dropping.
Tableau saves a lot of time and effort in creating interactive control panels, thus avoiding dealing with complex programming and wasting time as in Matplotlib / Seaborn / Plotly to get accurate results quickly.
Optimum tool for linear and logistic regression, cluster analysis, t-tests, MANOVA, ANOVA
Experience Level: Intermediate
This tool is used by professionals in the social sciences and education, as well as in government, retail and market studies, and its main function is to point and click.
The advantage of SPSS is that it allows a variety of data types to be contained by a variety of different regression types and tests, so this tool requires its users to be familiar with highly detailed hypothesis-testing statistics such as ANOVAs and MANOVAs.
The main disadvantage of SPSS is its high cost, starting at $99 per month.
Practical examples of using SPSS:
data samples:
Let’s say that a researcher in psychology and sociology is conducting scientific research that requires studying samples of certain segments of people in a society. You should have two groups, an experimental group and a control group. The t-test allows knowing that there is a statistical difference between the two groups based on the p-value that you specify.
Multivariate analysis:
This type of analysis sheds light on the difference between groups through several variables at the same time, as in our previous example. Studying a particular segment gives more accurate results for the study, taking into account the age and ethnic differences, etc.
We conclude from the study of this tool that its users prefer it in their reliance on statistical indications taken from data analysis in their science and research that they specialize in. It is an intermediate element between beginner tools such as: Polymer Search and Excel and more advanced programming languages such as Python and R
The ideal tool in advanced academic statistical analysis, big data and machine learning
Experience Level: Advanced
R program is characterized by its efficiency in conducting very advanced statistical analysis (academic level stuff), especially exploratory data analysis (EDA), and this is what makes it superior to Python, although they have almost the same functional characteristics, especially in the processing of large data
R tool is designed to perform advanced-level statistical analysis with high accuracy. It is known that tools that are specific to specific functions can perform those tasks more accurately than those tools that perform general functions.
Compared to Python, for example, doing a common analysis for R is simple and easy. As for Python, this task needs to find the right library and know how it works, then write codes and waste time and effort doing actions that you don’t need to do in R.
In the end, we conclude that the R and Python tools share almost the same functional characteristics with the advantage of Python in building production applications, but it does not have the efficiency in doing advanced academic computations compared to R .
Optimized tool: for dealing with big data, machine learning, automation and application development.
Experience Level: Advanced
Python is the most widely used programming language among data scientists and analysts because it is open source, contains multiple and diverse libraries, is characterized by its speed of performance, and is written in C. This means that it is possible to store and process bytes and bits that require a lot of time faster and easier.
As we mentioned earlier, the Python language is open source and contains 200,000 packages that include packages used for data analysis such as Plotly, Seaborn and Matplotlib. You can also call libraries in any field of data analysis.
Key Features of Python in Data Analysis, Machine Learning, and Automation:
• Great ease in dealing with small data and in performing complex calculations.
• Super speed in the processing of huge data.
• Save a lot of time in automating information.
Despite all these advantages that Python has, it is not without some drawbacks, most notably its ineffectiveness for mobile applications on the one hand, and its learning period to serve the purpose for which it is used, which is considered long compared to other tools on the other hand.
Python application examples:
Automation : You can do the analysis of several groups of data using several analysis tools such as Excel, but this requires a great deal of time and effort. The analysis then will be manually for each group separately, but the analysis of the same groups using Python will be more flexible and fast, and with 15 lines of code that will accomplish the task perfectly. Face .
Cleaning data : If you lose a sponsored link from a TV show, for example, you can restore those links by discovering those links in the first stage and then writing code to restore links as a second stage.
Exploratory data analysis :
You can understand the visualization and distribution of data by building an interactive model of your data in simple code in a short time using the Python module Pandas Profiling.
Thus, we conclude that these characteristics of the Python language made it the most widely used and desired language by data analysts and the best in dealing with data science and its branches of science and technology.
The ultimate tool for checking and processing big data
Experience Level: Intermediate
SQL is a programming language for querying and manipulating data
It performs almost the same tasks as Excel, but it is superior to it in its ability to deal with large data, and thus shortens a great deal of data processing time compared to Excel, in addition to its ability to store data in small files.
However, the only aspect in which Excel excels over SQL is the ease of learning and handling of the main tasks.
The main function of SQL tool is to edit big data
For example, you have a very large number of posts on Instagram and you want to make edits or sort those posts with easy procedures and simple instructions.
It has an effective role in joining data sets together. You can rely on SQL to combine several spreadsheet files containing a number of fields in one file with the utmost smoothness and flexibility, avoiding complications, difficulties and wasting time that you face to perform this task in Excel.
The ideal tool for predictive analytics, sales and marketing
The principle of this tool is based on artificial intelligence. After you enter your data on Akkio, select the variable you want to predict, and Akkio will build a neural network around this variable, using 80% as training data and 20% for validation.
The most important thing about Akkio is that it is not limited to prediction but also classifies the results accurately and with a few clicks in simple steps you can publish the model in a web application.
However, its disadvantages are that it is limited to dealing with table data and does not support the discovery of image and audio files, and its price starts at $50 per month.
To illustrate how to invest this tool to serve your business and projects, let’s say for example that you run an online store and email promotions, you use Akkio to create forecast models that you sell to customers so it can be said that this tool is good for users who do not have technical experience to get started with predictive analytics.
This tool is considered one of the easiest data analysis tools but the best for analyzing and displaying sales and marketing data and practical in business intelligence techniques
Experience Level: Beginner
You can perform a set of tasks in the analysis by entering your data on the site of the tool, which in turn will convert that data into an interactive web application, and these tasks include:
1- interactive pivot tables:
You can get questions about the data in a smooth and fast way and sort the entered data and output by clicking on click on the instructions for this process.
2- Automatic explanation:
Several options are presented to you about the data to ensure that you get the best results, such as suggesting summaries and showing anomalies, such as providing the optimal options for an effective digital marketing strategy according to certain data that determine the size of the currency, the target group, and others.
3- Interactive visualizations:
This tool allows its users to find several ideas and features about data and create interactive dashboards by presenting many types of charts, whether strip, bubble, scattered and heat maps, and the fact that these visualizations are interactive, which makes dealing with them easier and more accurate, especially in terms of sorting and filtering data.
Among the advantages of this performance is the discovery of matrices and their automatic division, as well as the presence of features and analysis techniques that cannot be performed by other programs such as Excel.
Despite all the advantages of this tool, it is not without some drawbacks, the most prominent of which is its inability to deal with large data and its loss to give more accurate results when dealing with more complex analysis, as it does not provide several types of charts and graphs.
This tool provides digital marketing users with several advantages as mentioned above, for example, this tool can act on your behalf in running Facebook ads or any PPC campaign and finding the most effective groups.
After you enter the data of your search for the target group of the audience, it sorts the search results and reviews them for you from best to worst and provides information on the secondary values resulting from that search process.
Business Intelligence: Polymer turns your spreadsheet into a dashboard where you can create infographics that you share with executives or clients via a URL that’s easy and flexible to access.
Therefore, this tool is simply considered optimal for non-technical people and for beginners because of the features and techniques that it offers with high efficiency in accomplishing the required tasks.
Excel is ideal for processing graphs and charts, and for analyzing and storing data; you can replace it as well if it is not available in your workplace with google spreadsheets because of the great similarity between them. Excel allows you to create charts and graphs very smoothly, providing several types of charts, including pie charts, box charts, bar charts, scatter charts, and other forms of charts, so either you’re a beginner or intermediate could use this program and take advantage of its capabilities.
You can also customize the colors according to what your work requires, in addition to various options such as controlling the size to display the results on the web with appropriate accuracy.
Excel provides a set of capabilities and techniques that allow you to control and change the data as you want, which makes Excel the ideal program for data analysis through several utilities, filters and mathematical operations within the program.
The circle of benefit from the program expands by learning the original programming language of the program, which is VBA, and that is recommended for those who spend a long time working on the program.
However, the main problem of Excel is that it is unable to process and analyze large and more complex data, and it does not favor its use in statistical analysis.
Here are samples that illustrate some of the features of working on Excel:
Data manipulation:
Excel contains several options for dealing with specific parts of the data, such as deleting specific positions of characters in each cell, or dividing a column into several columns, and so on.
Calculations:
Let’s say you have e-commerce data about sales of certain products and you always in need for calculations. So, Excel gives you several options to perform calculations on that data.
Bivariate Analysis:
Excel could be helpful in that case as it offers all the types of charts you need to analyze univariate or bivariate structured data.
Pivot Tables:
This tool enables you to create quick and easy pivot tables to get answers to common questions.
As a conclusion, Excel is an important tool with techniques and options that serve data analysts in implementing all that is necessary for their projects.
Data analysis tools of all kinds are designed to serve the purpose of their use, but the difficulty of choosing the most appropriate tool lies in the similar capabilities between some tools, so we will discuss the selection of the best option for the appropriate tool for the type of analysis you are doing, and we will discuss the most commonly used by beginners and professionals in data science.
Factors that help you reach the selection of the appropriate tool for data analysis:
• Determining the budget and the size of the work cadre in your company.
• Knowing the volume of data that we will analyze.
• Knowing the type of data to be analyzed and whether it needs classification or not.
• Knowing if the analysis require certain types of perceptions?
• Determining the function of the entity we are dealing with.
Content list:
We will mention the best and most appropriate option for each of the analysis techniques:
• For sciences and academia: SPSS
• For qualitative data analysis: ATLAS.ti
• To query big data: SQL
• To create graphs and edit data: Excel
• For non-technical users: Polymer Search
• To build prediction models: Akkio
• For automation and machine learning: Python
• For advanced statistical analysis: R
• Reporting and Intelligence Techniques: Tableau
• A cheaper alternative to intelligence techniques: Power BI
We will discuss later each of these options separately.
Digital marketing is a key factor in the success of any company, especially for small business owners. Its importance lies in several points, most notably its great contribution to bringing more potential customers through the wide and large spread of sites covered by digital advertising campaigns, in addition to that you can choose your audience who are interested in the product or service. In addition to its low costs compared to traditional means of advertising through the features and techniques provided by social media that make the advertiser reach the desired goals of his advertising campaign, if he uses them to the fullest, it is considered the link between the advertiser and the customer like search engines, content, e-mail and clips Video, illustrations, advertising text messages and e-books.
Therefore, it is necessary for any person who undertakes a small business project to adopt the process of digital marketing to promote his products or services, but rather he must develop his methods of buying and selling and dealing with customers to keep pace with the development taking place in the electronic market worldwide.
The importance of digital marketing lies in several points that we will list with illustrative examples, including :
Optimization of integrated content on the Internet :
The type and form of the advertised content often have a major role in attracting people to it, so the advertiser must choose appropriate and appropriate content, whether it is advertising text, illustrations, expressive images or videos. In producing attractive content through which he communicates the idea of the advertised product in an innovative manner, such as writing an advertisement phrase alongside a picture or creative design that draws attention, or as filming a video clip discussing the most important issues or problems for a particular group of people and helping this group to find appropriate solutions and so on.
The role of social networking sites in digital marketing :
As a result of the great demand for social networking sites by Internet users, especially those looking for specific products or services, these platforms provide their users with services and technologies that help them find faster and greater what they are looking for by offering publications and advertisements that suit their interests that they had included as information when they subscribed to these The platforms are on their personal accounts, and in turn, it is an opportunity for the advertiser through these platforms to make the best use of these technologies to promote his products or services and get the largest possible number of customers.
The goals of social media users differ, each according to his interest, some of them use it for entertainment and entertainment or gather news and information, and some use it to present to him his achievements and works, and others use it for learning and benefit, and some of them use it to promote his products and services, and with this difference, these means strive to develop their work system to attract the largest possible number of subscribers using the latest technology and information methods
Through it, developers and those in charge of social media work to provide comfort and safety for their subscribers and provide everything that would help them achieve their goals, regardless of the importance of these goals, negative or positive. Marketers know very well the importance of these platforms in achieving their desired goals and they are aware The interaction between the advertiser and the potential customer is very necessary to build trust between the two parties on the one hand and to know the strengths and weaknesses of the promotional campaign through the followers’ comments and the extent of their interaction with the advertising material presented to them on the other hand.
Developing methods to reach customers:
Many Internet users around the world use modern search techniques to obtain information and search for products and services on the Internet. Perhaps the most prominent platforms that most of these users rely on are Google and Bing platforms, which provided a new and advanced pattern of communication between the advertiser and the customer through search engines and methods. Effective in analyzing data and studying the stages of the promotional attic, these platforms derive their importance as a destination for huge numbers of Internet users, whether from their mobile phones or computers and tablets. This large number of users has made these platforms carry out digital marketing campaigns for various commercial activities, whether they are advertisements for tourist trips Or scholarships, businesses or other services that you offer in your online store or any other business. Perhaps the best and fastest way to generate leads is through search engine marketing.
Digital Marketing Techniques:
Digital marketing techniques vary according to the advertised material, for example:
Google Analytics This tool enables you to analyze the profit mechanism that you make through digital advertising, monitor the activity of users in pay-per-click marketing campaigns, track the flow of visitors to the website, and many more features that you do not see in traditional marketing campaigns.
Google Keyword Planner: It allows you to put the keywords that are searching for users who are looking for a specific product within a scheme that opens the way for you to know your competitors and learn about ways that enable you to outperform them. You can also search for new sites to promote your products and services. I made more profits.
Rapid development of online communities:
Many marketers are keen on continuous communication between them and their followers, as in a YouTube channel or an account on a social networking site, which creates a cohesive and solid community with regard to the aspects of work and commerce. And skills are invested by some commercially to open up many horizons for them to establish a business through which they can build a successful and well-known brand name for the pioneers of these platforms as a Facebook page, blog or YouTube channel.
E-mail marketing is also an essential pillar of e-marketing. People or companies often resort to checking incoming messages to their e-mail in order to get what is useful for them. Here comes the role of the e-mail marketer to present to researchers about the benefit and quality in any particular service. To provide what it has by sending messages with valuable and useful content to the largest number of people and companies seeking the best services.
You must develop your skills in digital marketing to ensure the smooth running of your business process. The continuity of profit from your online business depends on your ability to organize a mechanism that guarantees you efficiency in managing social networking sites and in content marketing skill, improving the appearance of results on search engines and investing them optimally in Marketing process.
Learning Skills :
No person can acquire any skill and become highly qualified in any particular field if he has not undergone several educational programs that have led him to success and excellence and learn from failure before success. This fully applies to your marketing project, as you must learn everything It benefits your business based on your own experiences and the experiences of others, quoting from the experiences of experts and specialists in this field, and making it an approach to follow during the process of marketing your products or services.
Leadership skills:
It is doing what you have to do according to the requirements of your marketing plan and the skills you pursue within the framework of the possibilities offered to you by social media platforms and technologies provided by search engines, whatever the circumstances and obstacles you face. In work and in avoiding the negative impact of criticism that you are exposed to, it does not affect your self-esteem and decrease your determination, but on the contrary, you make it a positive factor through which you correct defects and shortcomings, if any, so that you have these ingredients together as a leadership personality that advances your business activity for the better.
Money management:
The success of any business is not only limited to earning money and making profits, but you must know how to manage this money by saving it and investing it in developing and expanding your project, especially working online. Good forms of money management and as your profits increase, you can allocate more amounts to promotions, which contributes to the growth of your business circle more and faster.
Formation of an experienced team:
Building a team capable of assisting you in developing the digital marketing approach for your online business is an important factor for the success and growth of this activity in the long run, and that is by selecting people with experience and employing them, each according to his specialization and experience, and by combining these experiences, an integrated work system is formed that inevitably leads to impressive results that reach the process. marketing to the required level.
Decisive and quick decision making:
One of the most important marketing skills on which the success and growth of the online business depends is the speed of decision-making regarding how and when promotional campaigns on the Internet, such as choosing the date of offers and dates of discounts on your products and many of the ideas that distinguish you from your competitors, so you must avoid hesitation in making decisions that That will contribute to the development of your business and increase your profits.
Data analysis skills:
The growth of business and thus increasing profits through working online depends largely on your ability and skill in analyzing customer behavioral data and data related to the progress of the promotional process. And more towards professionalism in the field of digital marketing.
Time management skill:
Exploiting the time factor is one of the cornerstones of the smooth running of the digital marketing process, by knowing how to invest your time in certain times or events that match the content of your business
What gives you strong competition among your peers in the market and ensures the growth of your business in record time is the perseverance in implementing your marketing methodology on a daily and continuous basis.
This requires you to take several steps to start with setting up the site from choosing the domain name and hosting, then defining the type of business and the payment method that your customers will deal with you within the site, and then start following an appropriate promotion plan for your products or services using social media such as targeted advertising on Facebook and pay-per-click and content marketing strategies.
Using the Amazon platform
The Amazon platform is considered a widespread electronic market. Once you use the Amazon platform to display your products, the people in charge of it will take the procedures of the business process in a manner that ensures its success for the seller and the buyer.
Self-hosted blog:
A blog is an online business that requires you a little money backed by using your skills in communicating with others and through it you can help people gain skills and share experiences in a specific topic. The way to earn money from a blog is in several ways:
1- Promote services such as designing websites or offering graphics and designs for sale.
2- Through commission marketing to another party that sells products in which it plays the role of a commercial intermediary between the seller and the buyer in return for a sum of money.
3- Content-based advertising.
Offer on freelance websites:
This method depends on displaying a set of samples of your work, whether graphics, designs, writing, or any service related to marketing skills, within the framework of your own profile that you create on independent websites and platforms specialized in publishing those services.
Having a certain skill opens the way for you to start your independent business from home, online, in line with your interests and experiences, in parallel with obtaining a good financial return.
The more you offer on these sites works of a distinguished professional nature, your chance to work on those sites will be greater and more abundant, as the quality of your work reflects to customers a positive image that encourages them to choose you to implement their work within the framework of the strong competition within these platforms.
Online lectures:
This method depends on you conducting online training courses within your specializations and skills. If you are skilled in drawing, for example, you can conduct several educational lessons on the Internet explaining the principles and techniques of drawing, in which you attract a large number of followers interested in learning to draw.
The same applies to any other skill that you invest in publishing through specialized platforms or on your website, depending on the correct promotion and quality in explanation and delivery that will bring you appropriate profits.
Create a YouTube channel:
The YouTube platform is a suitable and fertile environment for offering and publishing your services to reach the largest possible group of people by creating your own channel. By launching an educational project in a specific field, for example, you shoot videos that attract followers so that you can earn profits from advertising and marketing on that channel.
Creating and developing mobile and web applications:
You can benefit from acquiring skills in creating and developing mobile and web applications through your learning of programming techniques, and this gives you several options to determine the type of applications that you will create in line with the requirements and needs of the market
In this Article, we will list the 6 most important options and techniques for starting any online business:
1- Rely on your own skills:
The skills that you possess in any field and your method of using those skills are your weapon in moving towards a successful online business. Investing your strengths in drawing, cooking, selling, marketing, or even in creating videos makes you a useful person in the eyes of followers and the focus of attention and attracting searchers for the services you provide. All these factors can be considered your true balance in starting a successful project online.
2- Define your goals and make them your top priority.
Determining the main goals of working online is an important major step that puts you on the right paths in your career. Earning money is one of the most important goals for anyone who practice a business anywhere and anytime, and this does not negate the desire to create a well-known, reputable brand that leads to establish good business relations with customers and stimulate the desire of qualified people to join your team. All these goals give you a strong motivation to level up your business to a high position in the widespread online market.
3- Perform a valuable transition:
One of the important options in developing an integrated business that greatly contributes to increasing profits. Your integration into the electronic market opens the way for you to spread your products and services across a wider geographical spot and thus expand your circle of customers by creating your own online store in which you display your goods or services or display them on other sales platforms Online.
For example, if a teacher gives lessons to students at his home, he teaches via the Internet, which increases the number of his students and increases his profits.
4- Make your hobbies and interests a profession for you:
If you are good at playing music, or composing poems, or your hobby is cooking, drawing, or acting, then investing any of these hobbies in making it work for you is the best way to start your online business, provided that you support your interests and enhance them with creativity and use all your skills to make you excel at Your peers in the field of business via the Internet and thus you have taken the first step on the road to success and vice versa. Your attempt to start an online business that is not related to your studies or interests is a failed attempt.
For example, a person cannot start a business by selling sports equipment or providing explanations about exercises via the Internet, and he is not familiar with sports at all. In return, a person who has talent and high skill in drawing starts a business online by using that talent correctly, which is the best strategy for the success of work through the Internet.
5- Start with little money:
There is no doubt that using an amount of money to finance your project online increases the success rate of that project. Perhaps the best use of that money is to use it in promotional and digital marketing campaigns to serve the growth of your project and ensure its continuity and spread, so it is the good budget that helps to develop the business faster. But, if the money is not adequately available to be relied upon to earn money, it will be based on what you have of experience and skills.
6- Allocating working hours.
One of the strategies for starting an online business is to allocate working hours in proportion to the income. In other words, if you work in a company and want to start an online business, part-time is the best option for you. With the expansion of your business and increasing your profits online, you have the choice whether to leave the job or keep working full time with the assistance of a representatives who has the required skills and experience to handle the work.
– Next time we will review ideas for online businesses.
Drawing a correct digital marketing strategy is one of the most important pillars on which the proper conduct of the promotional process is based and choosing the right plan is important in the optimal use of the features offered by all digital marketing media, which will bring you great benefit and raise your business to the desired level.
On the contrary, if the marketing plan is not at a good level of professionalism, the chances of its success will diminish, and therefore the marketing campaign is doomed to failure.
There is no doubt that most of the companies that are very popular and enjoy an excellent reputation have derived their popularity and success from the well-chosen purely strong marketing approach through which their business continues to grow.
What is the best strategy for e-marketing success?
The skill in using the methods and tools available to build business relationships with customers and deal with product pricing and distribution techniques in the right way constitutes the basic structure of a successful digital marketing strategy and this is what you will learn about in this article in order to reach professionalism as an advertiser through digital marketing capable of leading social networking sites and employ it in the service of your advertising project.
In our explanation of the digital marketing strategy, we will address an example of marketing through the Facebook platform, which has a major role in spreading advertising content on a large scale.
As Facebook has many advertisement tools that allow anyone to create a business page. It is an ideal plan to start using this page to pick the target group audience and type of the publication that interest the audience. Thus, it is an exemplary step towards the success of the promotion process on Facebook, especially since the features available on the page enable linking other accounts with the Facebook account, such as a website that helps the audience to find it easily and get more visits, thus increasing the opportunity for the business to grow.
The content marketing strategy also has an effective role in the growth of the business. For example, a toy store presents a blog about games that enhance the children creativity. Choosing the appropriate title that will appear in the first search results for those looking for games that enhance the child’s creativity represents an effective strategy for content marketing. Additionally, sharing this blog on social media could attract more visitors to your product website and encourage them to sign up and get emails for future activities.
One of the other marketing strategies that contribute the growth of the business is “Google My Business” because using this tool could help people to easily find the location of any business as the features and services offered by that platform that allow classifying the business product according to the lists of services, categories and hours of operation on maps online Like Google Maps, then include this business in search lists to show researchers specific products and services.
Finally, the most important way to increase the visitors numbers is choosing the appropriate promotional words that are frequently used and that will appear in search engines for the huge number of Internet users in order to search for a specific business. Assuming that you are a seller of women’s clothing and dresses, with the approaching festive seasons, the title “Best Evening Dresses” appears in Google ads could be very useful to attract more people to your websit.
Digital marketing is divided into 8 main sections: social media marketing, email marketing, search engines, pay-per-click, content marketing, affiliate marketing, mobile marketing, marketing analysis, and affiliate marketing.
It has been noted that relying on digital marketing has contributed greatly to the development of the marketing approach for companies and institutions through the possibility of choosing advertising designs and controlling the quality of the target group of the audience according to their interest in the advertised product.
Types of digital marketing:
Search Engine Optimization (SEO)
The appearance of the site that contains the advertised products in the first search results on Google is an important factor for this site to reach the largest category of customers looking for those products, but the extent of the success of this process requires the promoters in this way to select the appropriate words and phrases most frequently used by researchers on Search engines and their inclusion in the advertising content of the advertiser, and the way the website is designed in an attractive and organized manner and the choice of its link with the other site plays a major role in obtaining the desired results from the marketing process using search engines.
So, it is imperative for marketers in this way to be fully aware of the mechanism of search engines, especially Google, and to understand their algorithms by following these steps:
A good site structure helps search engines reach it fully, including advertising content, and this is done through the correct format of sitemaps, links and URLs.
It is necessary to replace images with alternative texts, videos and sounds with texts so that the search engine can read the content of the site clearly.
Choosing the appropriate words and search terms in the advertising content within the site and selecting the frequently used phrases in a concise manner is considered one of the mainstays for improving the priority of the site’s appearance in the search engine results.
Social media marketing:
It is everything that includes promotions on social media platforms, provided that it is not limited to creating sponsored posts and interacting with comments only, but also includes full coordination of the automation and scheduling processes offered by these platforms, especially the continuous follow-up and use of them to serve the progress of the promotional process to the fullest.
Those in charge of promoting through social media must remain in contact with the general marketing staff and coordinate with them fully to ensure the exchange of messages and all elements of the advertising program at a high level of harmony and organization across all systems, whether through the Internet or other means of other promotion.
Also, the continuous follow-up of the ad traffic by measuring and evaluating the audience’s interactions with the advertising publications plays a major role in correcting the defect, if any, and enhancing the positive points in the event that the promotional process proceeds as required.
Social media platforms give you many options that are not limited to Twitter and Instagram, but also include other areas such as:
Google My Business, eBay, Facebook Messenger, and Marketplace.
With all these advantages offered by these platforms to you as an advertiser, the extent of the success of the promotion process remains dependent on the type and form of the advertising publications in a way that draws attention and attracts the onlookers and in the manner of presenting the advertising text that cannot be overlooked as an essential element of the advertising campaign.
Pay-per-click (PPC):
It is the indication of each click of the ads that appear at the front of search results at the top of the page, or those that appear while browsing web pages and mobile applications, or that appear before the beginning of YouTube clips. It is an effective way to raise the percentage of the promotion process to advanced ranks in the search results, and on the other hand, it is distinguished from others that you pay the advertising expense when someone clicks on your ad.
The percentage of the cost of advertising varies according to the number of people searching for keywords and keywords in the sites, so the value increases by the large number of searchers for those words and decreases as their number decreases.
Email Marketing:
Email marketing is one of the important sections of content marketing. Email marketing experts have an integrated vision of how to deal with people professionally and flexibly, and they have the skill to follow and analyze customer interactions by tracking the number of people who entered the email, the percentage of clicks, opening the mail, etc. From tracking mail traffic in general, and certainly there are several important things that should not be hidden from the originator of e-mail advertisements, including:
* Your personal stamp is an identification identity for you through your mail for customers and visitors, which distinguishes you from others
* Convincing the public of the urgent need for the advertised product and presenting a strong offer that ends within a short period of time, making the site a great turnout.
Content Marketing:
This is a method that is considered a marketing plan that will continue in the long term, through which advertisers present the marketing content elements of videos, voices, texts and podcasts, which will continue over time to attract the largest segment of the audience.
Mobile Marketing:
This type of marketing is done via smartphones or tablets to the target audience through text messages, websites, e-mail and social media by offering promotional offers or advertising content during a specific time and place.
Statistics have proven that a large group of consumers spend much more time using smart phone applications compared to watching advertisements on TV.
Marketing Analytics :
This type of marketing allows the advantage of tracking the progress of the marketing process in great detail by knowing the behavior of users in terms of the number of visits, click rate, the number of times email messages are opened, and many other advantages that require those in charge of the marketing process to absorb the huge amount of analysis information and deal with it according to a plan a certain professionalism.
Knowing the implications resulting from the analysis of the marketing process helps to create a specific strategy by knowing the strengths and employing them in supporting advertising campaigns to upgrade them to the best possible performance on the one hand, and on the other hand knowing the flaws and weaknesses to be remedied and avoided.
Marketers have a good number of techniques that allow them to assess the effectiveness of marketing operations, and perhaps the most famous of these is the Google Analytics tool used for marketing analytics.
Affiliate Marketing:
This type of marketing depends on establishing a business relationship that connects your company with specialized agencies to lead the promotions according to well-thought-out and highly effective systematic plans by involving their audience in your company’s promotional processes, whether publications or videos to attract a larger number of customers that increase the expansion of your business within a short period .
Many platforms that adopt the commission promotion process have spread, such as TikTok, Instagram and Youtube, and it is expected that the number of platforms that adopt this type of digital marketing as an approach to it will increase, according to statistical studies.
Finally:
In the end, digital marketing is one of the most important areas that everyone should learn how to master their skills
Digital marketing is the process of promoting and selling products and services by electronic devices through social media, search engines, e-mail and mobile applications.
About digital marketing it depends on online marketing and offline marketing that is built on seven main pillars:
1. Content Marketing
2. Search Engine Optimization (SEO)
3. Social Media Marketing (SMM)
4. Affiliate Marketing
5. Using Search Engine Marketing (SEM)
6. Email Marketing
7. Pay-per-click (PPC) advertising
In this article, we will highlight The offline marketing:
Offline marketing is based on four main categories, which are electronic marketing( enhanced offline marketing), radio marketing, television marketing and telemarketing, and we will address each of them separately.
Electronic Marketing(Enhanced Offline Marketing):
The billboard is one of the means of marketing that is not connected to the Internet, especially electronic ones. However, the success of advertising in this way depends mainly on the placement of the billboard, as it is placed in a place crowded with pedestrians that attracts a larger number of customers, which returns to the advertiser with more positive results.
The detailed explanation through pictures and illustrations, which attracts a good number of pioneers in electronic stores, is an important factor in the digital marketing plan.
From the above, we conclude that the success of offline marketing depends on attracting the largest segment of people.
TV Marketing:
According to statistics related to television marketing, the number of television viewers in the United States is still consolidating the mass base on which television marketing is based, especially the high percentage of subscribers to multicast channels.
Radio Marketing:
A study says that in recent years, the number of radio listeners in the United States has increased significantly, and in return, the value of spending on radio advertising is rising in parallel with that rise.
And the methods of advertising on the radio developed by making the host of the program start his radio program by reciting your advertisement and promoting your product.
So, with the help of search engines, you must choose the stations whose interests and requirements are in line with your advertised products. For example, if you own a sportswear and equipment company, you need to search for a radio program whose listeners are youth and athletes, on the one hand, and on the other hand. As a radio advertiser, you must choose the advertisement that is entertaining and not boring for the listener in the absence of the visual effect that people are more attracted to.
Mobile Marketing:
The number of people connected to the Internet from smart phones has increased by much more than the number of Internet users from computers. This wide spread of smart devices has contributed to raising the value of the amounts spent on mobile advertising compared to desktop advertising expenditures.
Call and text:
It depends on contacting a person and trying to sell a product to him, but this method has limited effectiveness compared to marketing through social media.
And text messages have a better role in the marketing process due to their availability on all phones and their widespread spread. Offering discounts is an important factor for any advertiser to attract the largest segment of customers. On the other hand, you can send special offers and gifts to customers participating in text messages. The text message service allows you to remind customers of appointments. Specific to launch a specific product and determine the date of receipt, for example.
Finally:
Despite the great reliance on the Internet in the development of the marketing process that cannot be dispensed with for any advertiser, the use of traditional methods that do not need to connect to the Internet still exists and achieves good results in marketing and contributes to expanding the circle of potential customers as well as working on the development of traditional devices to achieve maximum benefit of digital media.
Programmers and developers show great interest in the Python language, given that it is one of the most important and most popular programming languages in the world of technology, especially contemporary sciences such as data science, artificial intelligence and its branches.
Therefore, it is essential to look at the top eight questions that you will face if you are going to conduct a Python interview .
1- What is your knowledge about interpreted language?
Hiring staff usually start the interview by asking the basic questions about Python and brief explanation of basic concepts of this programming language.
2- What are the benefits of Python?
This is one of the main questions in interviews, that reveals your understanding of the Python language and why companies start replacing other programming languages such as JavaScript, C ++, R and others with Python.
3- Create a list of the common data types in Python
The interviewers are likely to ask about basic functions and concepts that are used a lot when anyone starts using Python including numeric data type, string type, assignment type, list types, set type, and so on.
4- What are the basic differences between lists and tuples?
Your answer to this question reveals your major understanding and ability to identify the differences between basic components of this language like lists ,tuples, mutable and immutable terms.
5- What is _init_?
Some Recruiters ask about details of functions and codes to test your knowledge in this language. The _init_ method is implemented in Python when creating a new object to help distinguishing between methods and attributes during the programming process.
6- Explain the differences between .py and .pyc?
One of the general questions in a Python interview, through which they learn about the programmer’s ability to understand concepts and terms in order to deal with the two differences in an optimal manner as required.
7- Describe Python namespaces.
This is one of the most interesting questions that recruiters usually like to ask in interviews because of the importance of Namespaces to set objects correctly. Your skills in defining the dictionary and Namespaces types is strong evidence for the interviewers of your high proficiency in understanding the Python language.
8- What are all necessary Python keywords?
A main and important question that requires any candidate in the interview to know the important keywords of the Python language before starting the interview, which are 33 keywords that include the meanings of variables and functional terms.
In this article, we will review the best data visualization books that will help you raise your level and develop your performance in graphic representation.
1- The Data Visualization Sketchbook:
This book is characterized by being a comprehensive guide to clarify the rules of drawing and dealing with graphs, starting from the stage of its creation, through how to deal with the control panel and designing slides, all the way to the stage of completing the graph in an optimal manner.
2- Storytelling with Data: A Data Visualization Guide for Business Professionals :
This book will teach you the whole process of creating helpful visualisations from A to Z, and how to attract the audience’s attention to the main visualisation points.
3- Effective Data Visualization: The Right Chart for the Right Data
This book is characterized by its easy style and simple presentation to explain the concepts of graphing through its focus on the use of Excel charts and graphs to achieve the Data findings very easily. On the other hand, this book could guide you to successful visualisation creations and teach you how to choose the correct chart for your Data.
4- Resonate: Present Visual Stories that Transform Audiences :
The content of this book focuses on building amazing visualisation that is not forgettable by putting all the elements together with perfect and suitable colors and specific criteria in order to present data finding to your audience in a very particular way, easily and simply.
5- Better Data Visualizations: A Guide for Scholars, Researchers, and Wonks
Researchers are the leaders who find new methods to discover new things in all life aspects and this book is a guidance that helps researchers to present their findings better.
Finally:
Mastering the skills of mathematics and statistics in addition to programming skills and graphic representation will make you a professional in the field of data science and being aware of visualisation tools will enable you to get quick results with high efficiency.
To advance past the junior data scientist level the key is to practice coding as much as could reasonably be expected to remain on top.
Advertisements
First : Python for Data Analysis is the ideal method to become more familiar with standard Python libraries like NumPy or pandas, as you need these libraries for Real-World Data analysis and visualization. So, this book is a finished composition that begins by reminding you how Python functions and investigates how to extract helpful insights from any data you may deal with as a Data Scientist.
Advertisements
Second: Python Data Science Handbook is an extraordinary aide through all standard Python libraries also like NumPy, pandas, Matplotlib, Scikit-learn.
This book is an extraordinary reference for any data-related issues you may have as a data scientist. Clean, transform and manipulate data to discover what is behind the scene.
Advertisements
Third: Python Machine Learning is somewhere close to transitional and master. It will request both specialists and individuals who are somewhere in the middle.
It begins delicately and afterward, continues to latest advances in AI and machine learning.
It is an Extraordinary read for any AI engineer or Data Scientist exploring different avenues regarding AI calculations!
Advertisements
Fourth: Active Machine Learning with Scikit-Learn and TensorFlow (the second version is out!) is a stunning reference for a mid-level data scientist.
This book covers all basics (classification methods, dimensionality reduction) and afterward gets into neural organizations and deep learning utilizing Tensorflow and Keras to assemble ML models.
These are some of many important books for intermediate level, if you know other books please share in comments.
Advertisements
:بالعربي
Advertisements
كما قرأنا سابقا” عن بعض الكتب التي تساعدك كمبتدئء في علم البيانات بالدخول الى هذا المجال من دون الحاجة لمعرفة اي لغة من لغات البرمجة, ولكن لتصبح متمرس اكتر لابد من البدء بتعلم لغة واحدة على الاقل وانا انصح بلغة البايثون لسهولة تعلمها.
ومن هنا لنتعرف على الكتاب التالي وهو (البايثون لتحليل الداتا) يعتبر اقتناء هذا الكتاب وقرائته طريقى مثلى للبدء بالتعرف غلى مكاتب البايثون اللازمة قي تحليل البيانات و تمثيلها مرئيا” مثل مكتبة الباندا و النمباي, حيث يتدرج في شرح المعلومات من مستوى المبتدئء وحتى مستوى متقدم اكثر.
Advertisements
الكتاب الثاني هو ( البايثون لتعلم الداتا ساينس) , يعتبر هذا الكتاب المساعد الاول لاي عالم بيانات مستجد حيث من خلاله يمكنك ايجاد الكثير من الحلول التي ممكن ان تواجهك اثناء تصحيح البيانات ومعالجتها , او تطبيق الخوارزميات وغيرها.
Advertisements
اما الكتاب الثالث فهو (البايثون لتعلم الالة) يعتبر هذا الكتاب مرجع جيد لمن هم في منتصف الطريق في رحلة تعلمهم لعلم البيانات او حتى ممن يمارسون المهنة فهو دليل شامل يتدرج من المستوى المبتدئ و حتى مستويات اعلى.
Advertisements
اما الكتاب الرابع فهو ( تعلم الالة باستخدام الكيراس و التنسر فلو) , يعتبر هذا الكتاب ايضا مهم جدا للمستويات المتوسطة في علم البيانات حيث يساعدك على تعلم مبادئء خوارزميات التصنيف و غيرها و من ثم ينتقل الى مستويات اعلى بتعلم ميادئء الشبكات العصبية والتعلم العميق باستخدام التنسرفلو و الكيراس.
المقالة القادمة ستكون لكتب المرحلة المتقدمة , اذا كان لديكم كتب اخرى قمتم بقرائتها واستفدتم منها شاركونا بالتعليقات
Data Science is certainly the most sizzling business sector at this time. Pretty much every organization has a Data science position opened or will open soon. That implies, it’s the best ideal opportunity to turn into a Data Scientist or sharpen your abilities in case you’re as of now one and need to step up to more senior positions. So, to get such a valuable help in this career, I will recommend you with the most valuable books that could lead you to know more skills in Data Science. More further, books are good and necessary but 70% of your Data analysis skills comes in practicing and performing projects.
Advertisements
Data Science books for Beginners
1- In case you’re simply beginning your experience with Data Science, you should start with this book:
You do not need to know Python to start, this book is very helpful to start from the beginning as you’ll get a brief training in Python, learn basic math for Dat Science, and you will be able to break down data and analyzing it.
Advertisements
2- In case you’re a beginner in machine learning you will find this book very helpful:
This book will help you to know what skills you need to obtain to turn into Data Scientist, how Data Scientists perform their jobs, or how to land your first interview for the first position.
I introduced most important books for Beginners who are taking their decision to become a Data Scientist. So, Good Luck, and it is my pleasure to share in comments some of other valuable books in Data Science for beginners that you may know about, that we can all exchange our experience.
Advertisements
( Arabic):بالعربي
:اهم الكتب في مجال علم البيانات
Advertisements
علم البيانات هو من أهم قطاعات العمل المنتشرة في العصر الحديث وخاصة في دول الغرب جميع الشركات حاليا تسعى لاستثمار البيانات المتوفرة والموجودة لديها في تحسين اداء العمل واكتشاف الثغرات و وضع خطط عمل مستقبلية تتماشى مع تحقيق اهداف الشركة ,لذلك بدأت هذه الشركات بتوظيف علماء ومحللين البيانات للتعامل مع البيانات وتوظيفها كما ذكرنا في ما يخدم مصلحة العمل.
فاذا كنت حاليا بدأت بتعلم هذا الاختصاص او تمارس هذا الاختصاص في احدى الشركات وبحاجة. الى كتب تساعدك في رحلة التعلم اليك هذا المقال الذي سنستعرض فيه اهم الكتب للمبتدئين في مجال الداتا ساينس
Advertisements
١- بداية اذا كنت مستجد في هذا المجال ولا تعرف عن الاختصاص الا اسمه يمكنك البدء بهذا الكتاب الذي يساعدك بوضع اللبنة الاولى برحلة تعلمك الجديدة ومن دون اي حاجة لمعرفة سابقة بلغات البرمجة , حيث يساعدك بتعلم الرياضيات الاساسية في مجال الداتا ساينس وكيفية تطبيقها بشكل مبسط على برنامج البايثون الذي يعتبر من اسهل لغات البرمجة
٢- اذا كنت من المستجدين في تعلم لغة الالة فهذا الكتاب سيساعدك كثيرا لفهم هذا المجال وفهم الخوارزميات المستخدمة في التعلم الالي و كيفية تطبيقها بخطوات بسيطة على برنامج البايثون
٣- اما اذا كنت تبحث عن كتاب يوفر لك معلومات عن معنى علم البيانات وماهي المهارات التي يجب ان تتعلمها للدخول في هذا المجال , او كيف يمكن ان تحصل على المقابلة الاولى التي ستوفر لك العمل المناسب فإليك هذا الكتاب
وفي ختام هذا المقال نكون قد استعرضنا اهم الكتب اللازمة للمبتدئين في مجال علم البيانات , نتمنى للجميع التوفيق و نتمنى ايضا مشاركتنا بالتعليقات عن كتب اخرى قمتم بقرائتها لتبادل الخبرات والمعرفة بين الجميع
Data Scientists are a blend of mathematicians, trend-spotters, and Computer Scientists. The Data Scientists’ job is to deal with huge amounts of data and complete further investigation to discover trends and gain a more profound understanding of what everything implies.
To start a career in Data Science you need some skills like analysis, machine learning, statistics, Hadoop, etc. Also, you need other skills like critical thinking, persuasive communications, and are a great listener and problem solver.
This is an industry where plenty of opportunities are available, so once you have the education and capabilities, the positions are sitting tight for you—presently and later on.
Advertisements
Data Scientist Job Market:
These days Data is considered very valuable, organizations are utilizing the discovered insights that data scientists give to remain one step ahead of their opposition. Large names like Apple, Microsoft, Google, Walmart, and more famous companies have many job opportunities for Data Scientists.
Data science job role was discovered to be the most encouraging vocation in 2019 and has positioned one of the best 50 positions in the US.
Advertisements
How to start your first step?
The academic requirements for Data Science jobs are among the outstanding roles in the IT business—about 40% of these positions today expect you to hold a postgraduate education. There are also many platforms that offer to teach Data Science online like EDX, Coursera, Data world workshops, and many others.
These courses permit you to acquire deep learning about the most developed skills and techniques that Data scientists use, like Power Bi, Hadoop, R, SAS, Python, AI, and more.
Did you start your career, write in comments which is the best platform to learn the skills from your perspective?
Advertisements
بالعربي
كيف تبني خبراتك المستقبلية لتصبح خبير في مجال علم البيانات؟
Advertisements
عالم البيانات يعتبر مزيج من علم الرياضيات والمعلوماتية حيث يعتمد علم البيانات كما قرأنا سابقا على معالجة حجوم كبيرة من البيانات لاستكشاف ماوراء الداتا , مدلولاتها , والترند التي تشير اليها و بالتالي فهم ماهية الامور و كيفية حدوثها .
للبدء باختصاص الداتا ساينس لابد من اكتساب المهارات اللازمة لهذا المجال و اهمها القدرة على تحليل الامور و قراءة المخططات البيانية التحليلية وفهم مدلولاتها بالاضافة لاكتساب معلومات اولية في مبادىء الاحصاء والاحتمالات الرياضية التي تساعد كثيرا في تحليل الداتا
ايضا بالاضافة للمهارة السابقة يجب تعلم لغة برمجية تساعد اثناء عملية التحليل وتطبيق الخوارزميات او تعلم البرامج التحليلية الجاهزة متل النايم وغيره , و اما اذا كنت تتعامل مع كميات كبيرة وضخمة جدا من البيانات يجب التطرق الى المنصتين الاساسيتين للداتا الضخمة وهما سبارك و هادوب
اما لتعلم مهارات التصوير البياني او مايسمى باللغة الانكليزية فيجواليزيشن عليك التطرق الى احدى المنصتين هما تابلو و بور بي اي
ايضا بالاضافة للمهارات السابقة يجب ان يكون لديك المهارة والقدرة العالية على تحليل الامور و ربط الاحداث مع بعضها بالاضافة للمهارات الجيدة بالتواصل مع الزملاء و العمل ضمن فريق كامل متكامل لايجاد الحلول للمشاكل التي يمكن ان تواجهك اثناء عملية التحليل
يعتبر هذا المجال حاليا مجال العصر والمستقبل وبسبب النقص الكبير في اعداد الخبراء هناك توفر كبير لفرص العمل بالاضافة للرواتب الجيدة نسبيا ومهما كانت شهادتك البكالوريوس التي حصلت عليها سابقا بامكانك تعلم مهارات علم البيانات والدخول به حيث انه مجال شامل مكمل لاي اختصاص سابق ويتم تطبيقه في العديد من القطاعات ومجالات الحياة
Advertisements
سوق العمل في مجال الداتا ساينس:
ذكرنا سابقا ان العديد من الوظائف مفتوحة في مجال الداتا ساينس ولكن هناك نقص كبير بالخبراء , لكن هل سالت نفسك لماذا هذا الاقبال الشديد من قبل الشركات على هذا الاختصاص تحديدا؟
حقيقة الكثير من الشركات وخاصة الشركات الكبرى مثل غوغل, مايكرو سوفت, امازون , ابل وغيرها يعتمدون على هذا المجال لزيادة ارباحهم وتقييم منتجاتهم و وضع خطط مستقبلية لتطوير منتجاتهم من خلال دراسة اقبال الناس على شراء منتجاتهم و المنتجات المحبذة لدى الزبائن و دراسة متطلباتهم ,و كل ذلك يتم بدراسات احصائية و تحليلية طويلة الامد تحتاج خبراء حقيقين في مجال الداتا ساينس
منذ العام ٢٠١٩ اعتبر مجال الداتا ساينس من اهم القطاعات التي يجب التشجيع عليها و تعلم مهاراتها حيث اصبح هذا المجال من اوئل ال ٥٠ وظيفة الاكثر اهمية وطلبا في سوق العمل في الولايات المتحدة الامريكية
Advertisements
اذا ماهي الخطوة الاولى للبدء في هذا المجال؟
الدراسة الاكاديمية الان ضرورية جدا للدخول في هذا المجال حيث ان معظم الشركات حوالي الاربعين بالمئة منهم يطلبون اذا لم يكن تخصصك الجامعي في مجال الحاسوب او المعلوماتية ان يكون لديك على الاقل دبلوم عالي في مجال الداتا ساينس, ولكن هذا لا يعني انه عليك اكتساب الدبلوم او الماستر اولا للبدء في هذا المجال وانما يمكنك تعلم المهارات من خلال العديد من منصات الاون لاين واحتراف المهارات المطلوبة من دون دراسة اكاديمية , و من اهم هذه المنصات داتا كامب, ايدكس , كورسيرا وغيرها كثير
هل بدأتم بتعلم هذا المجال؟ اكتبولي بالتعليقات ماهي افضل المنصات التعليمية الاون لاين من وجهة نظركم وحسب تجربتكم؟


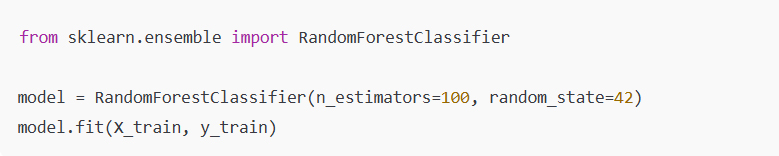


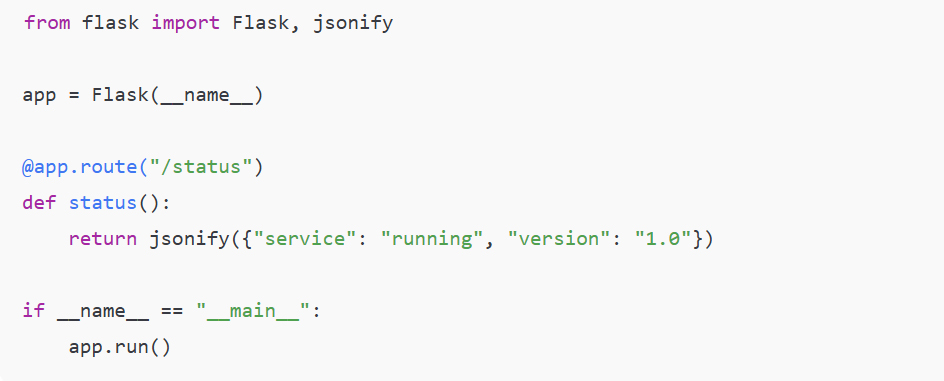


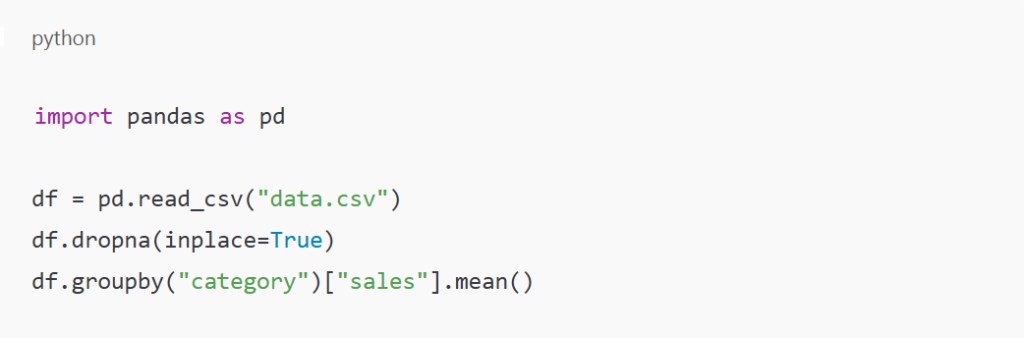


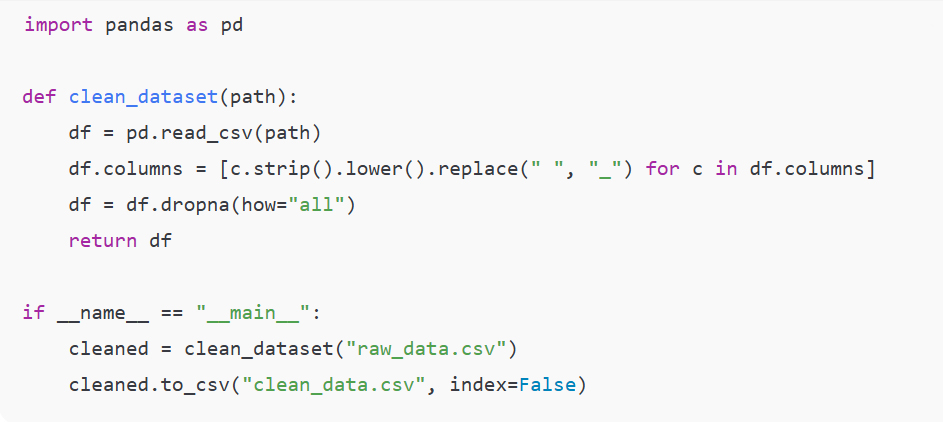


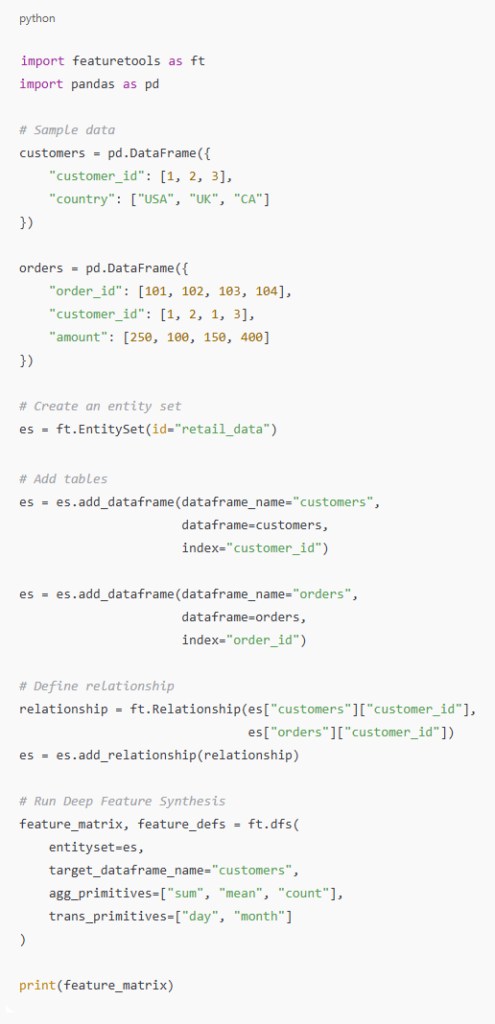

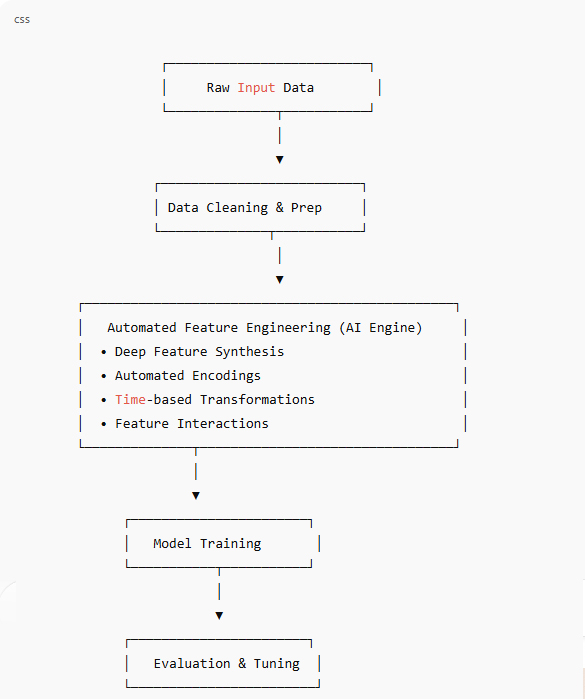


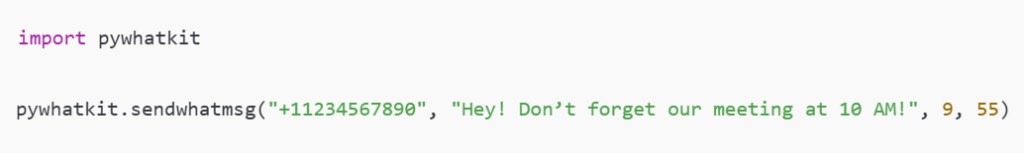

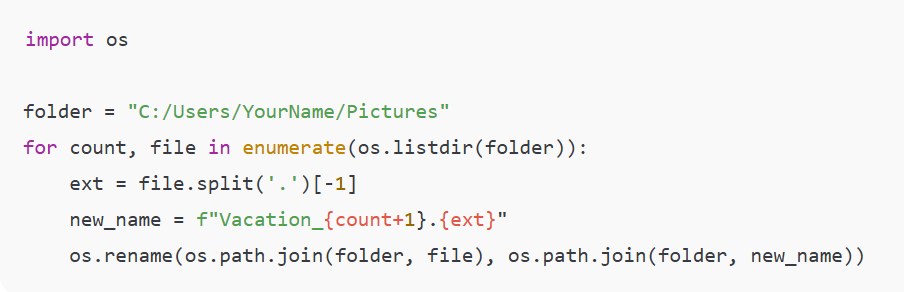


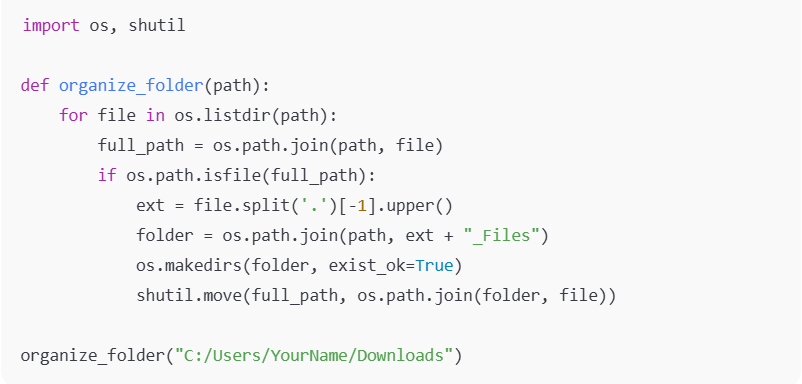
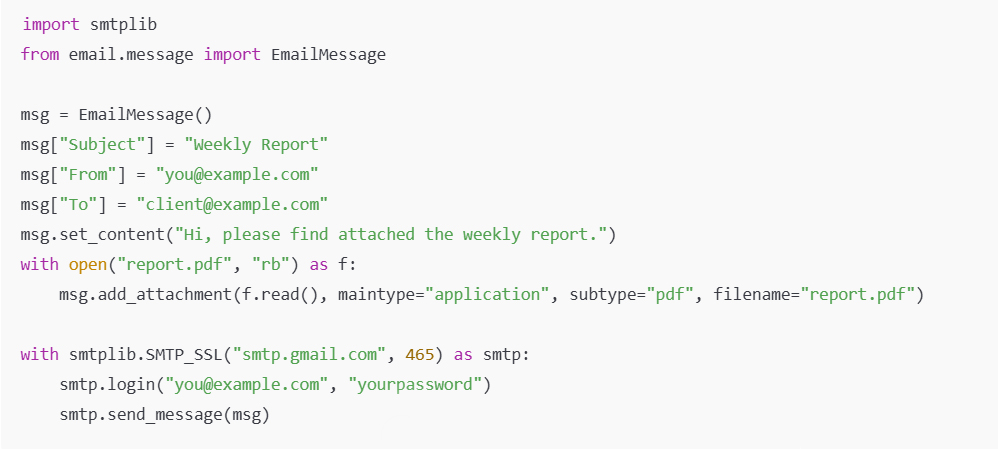


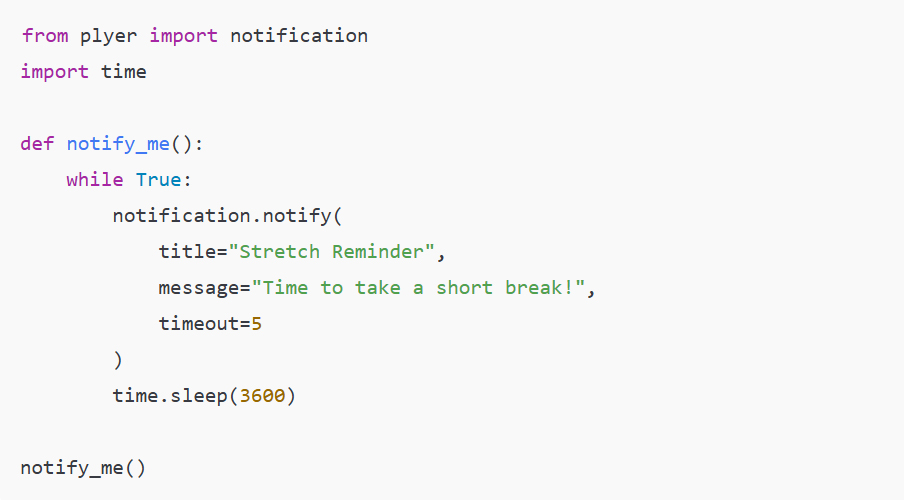
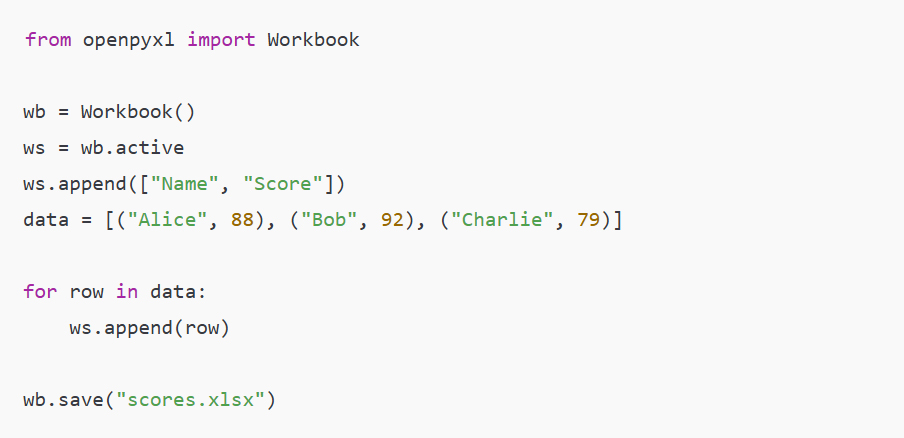
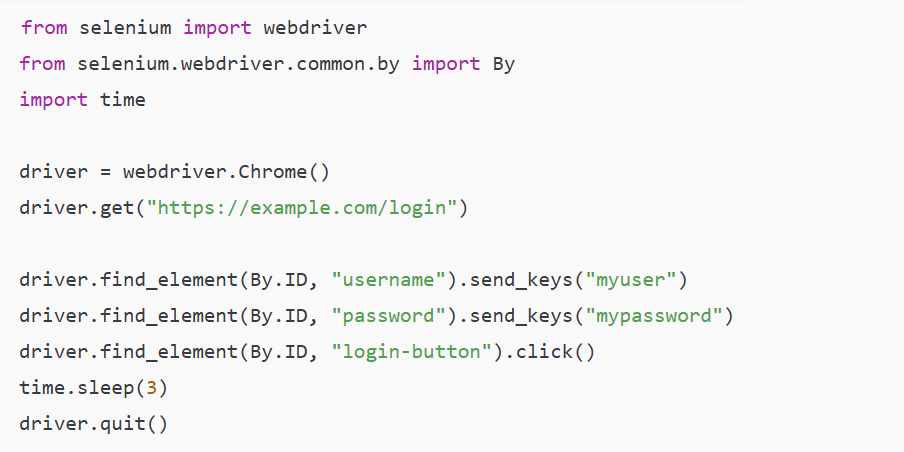


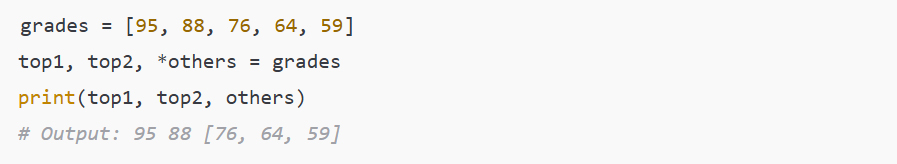
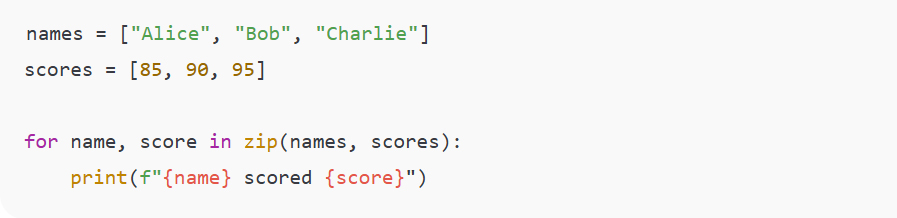

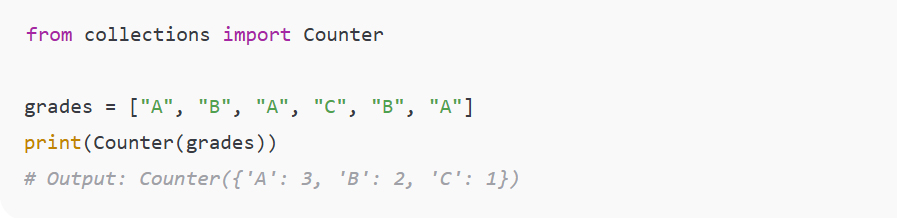


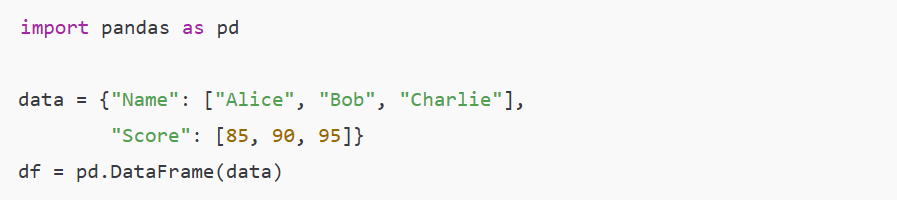


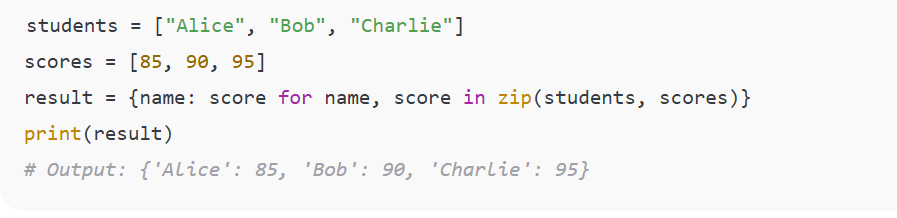


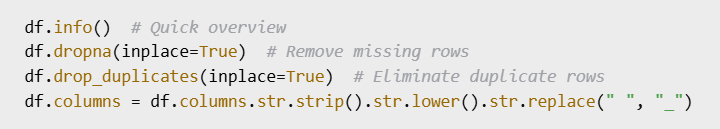

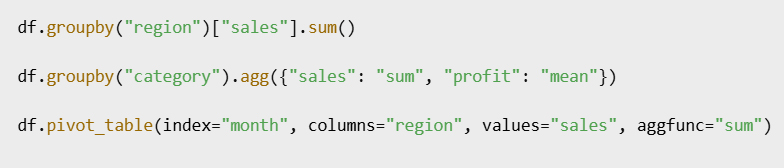
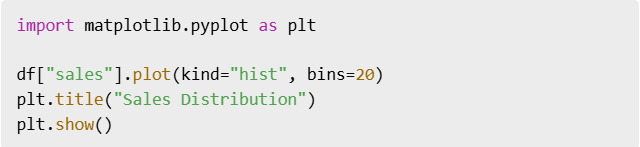

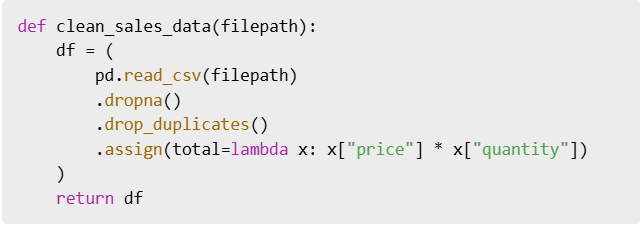


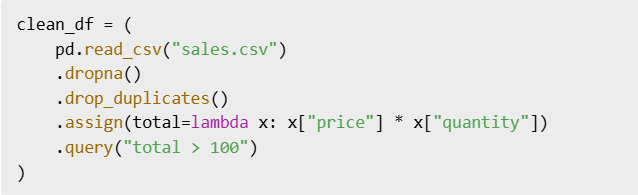


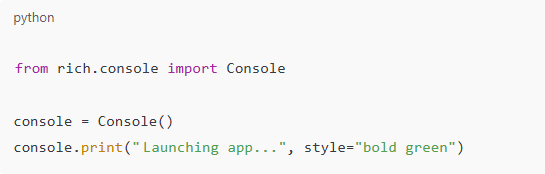


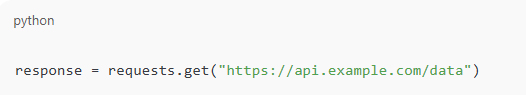


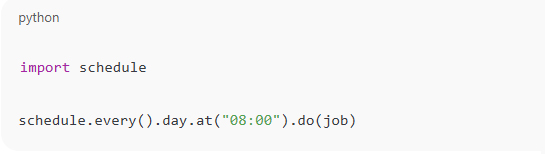


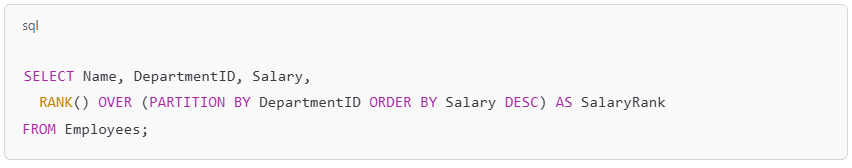


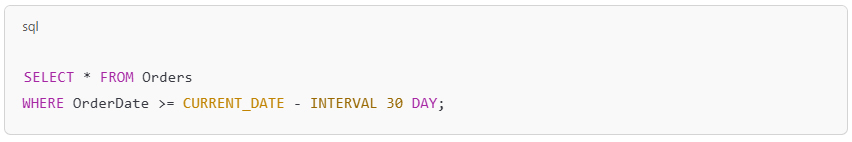
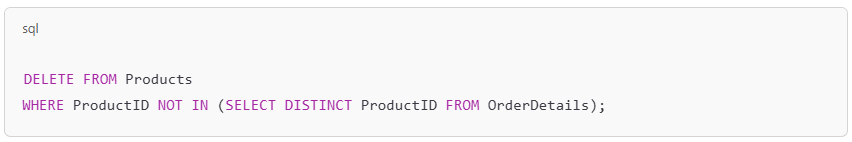


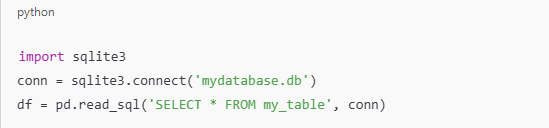

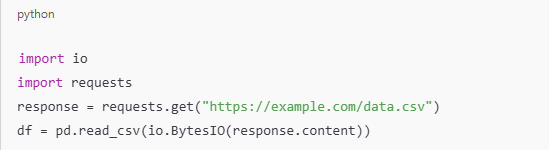


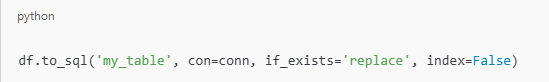

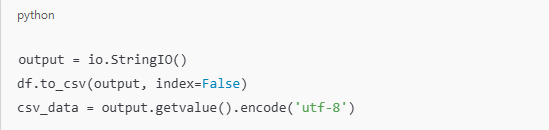

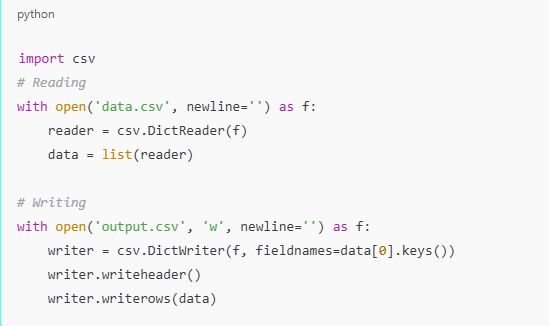
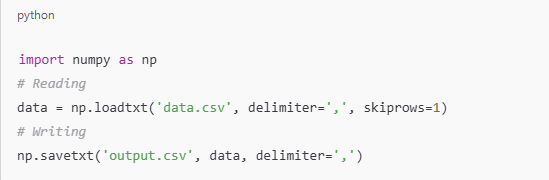
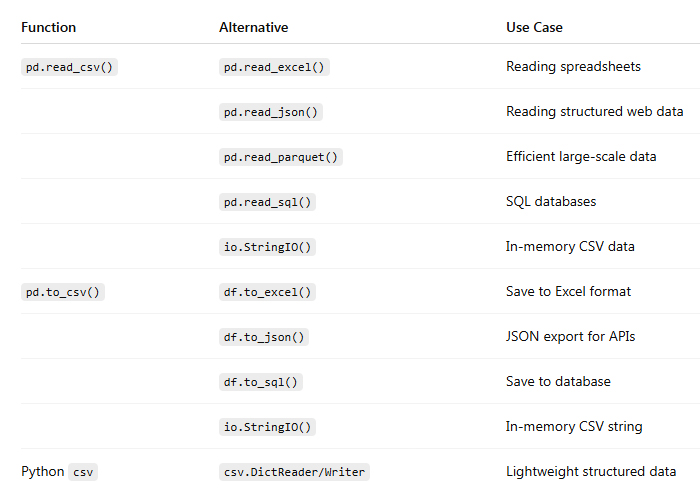


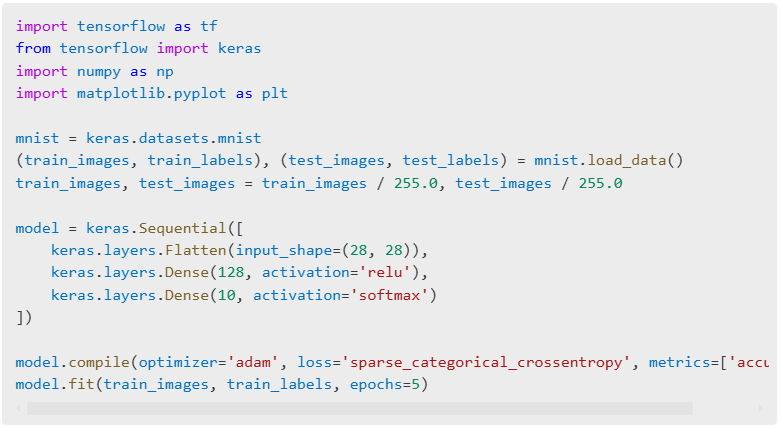

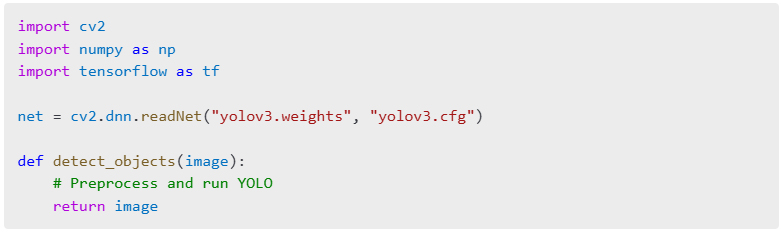
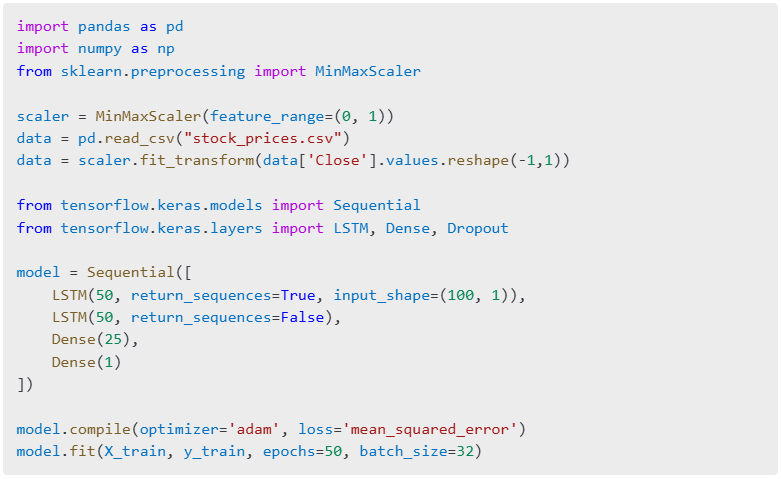


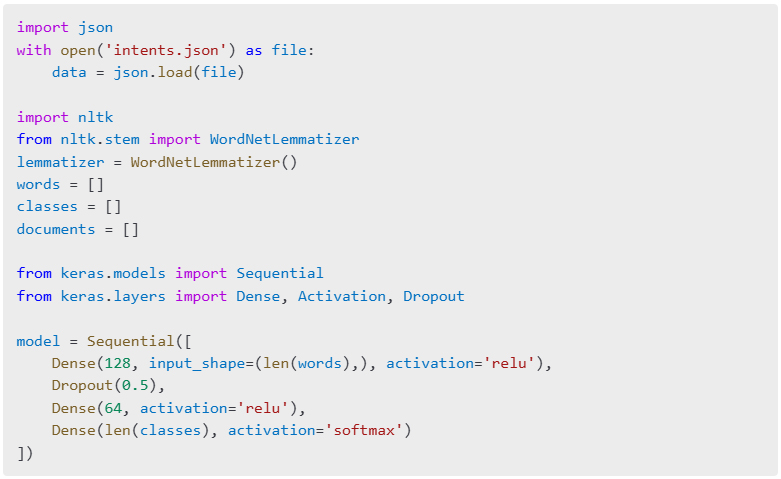


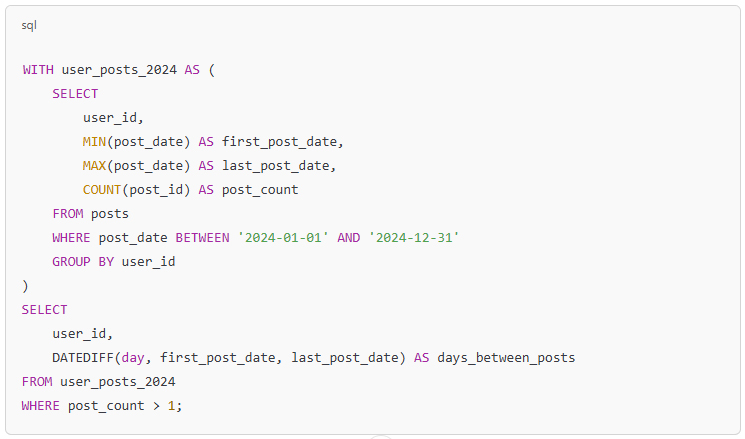


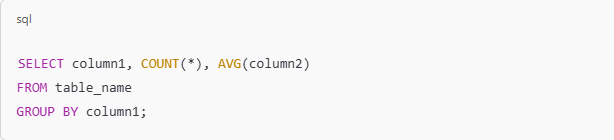


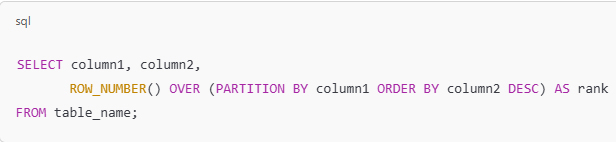


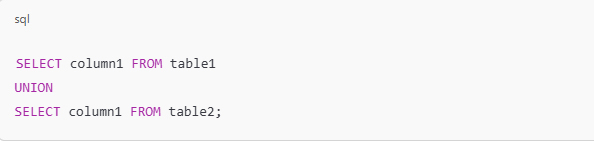


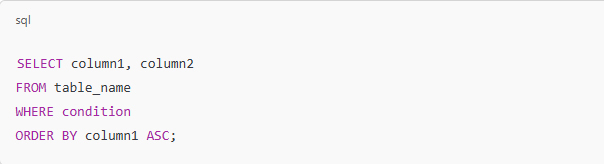

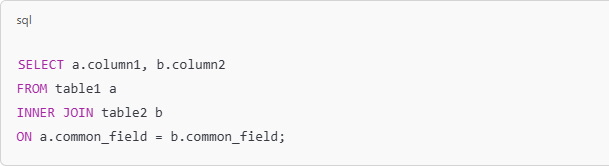
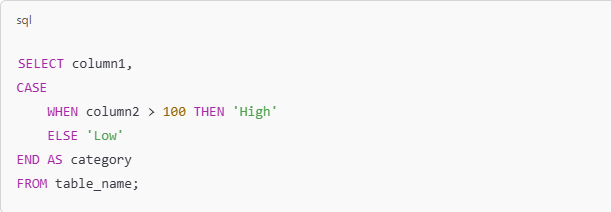
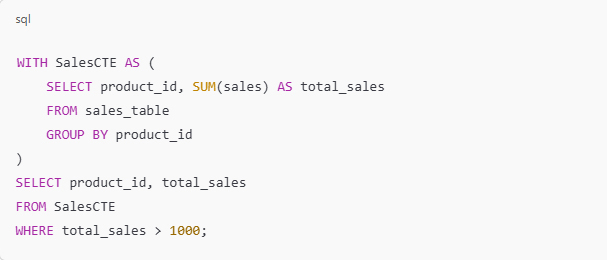

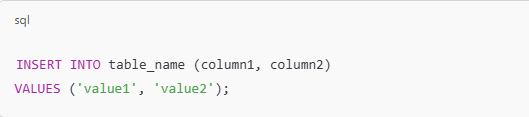
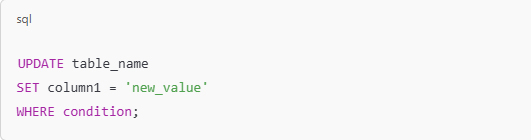


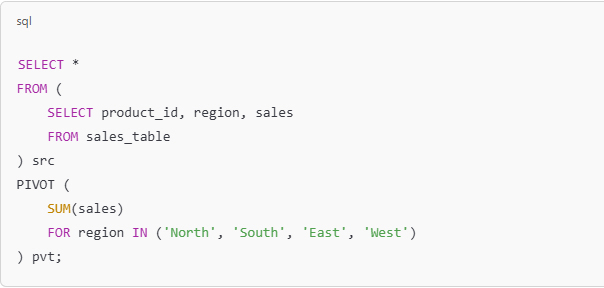


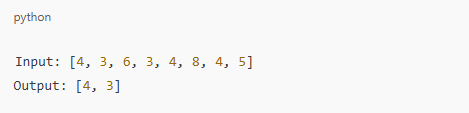


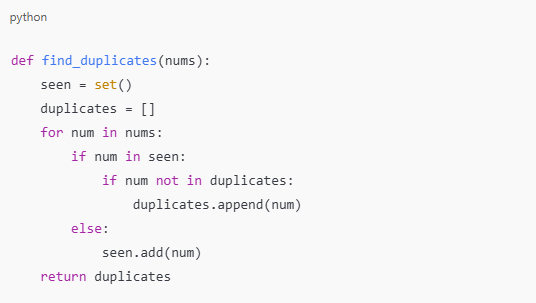


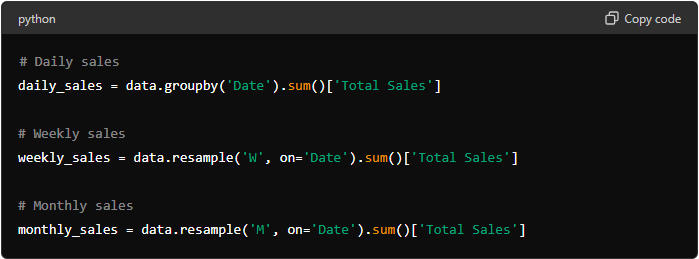

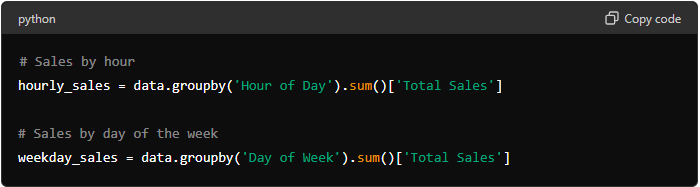

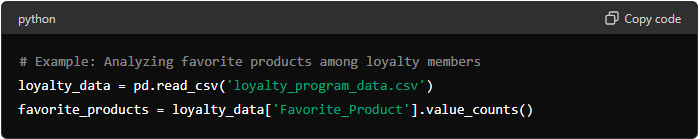


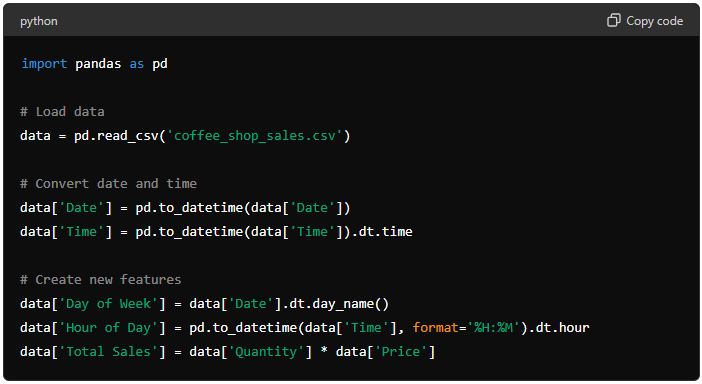

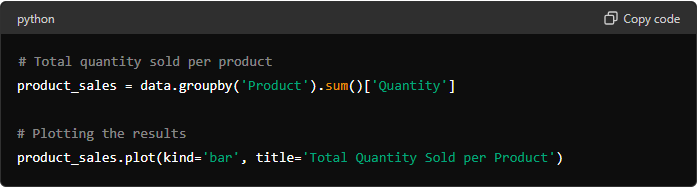

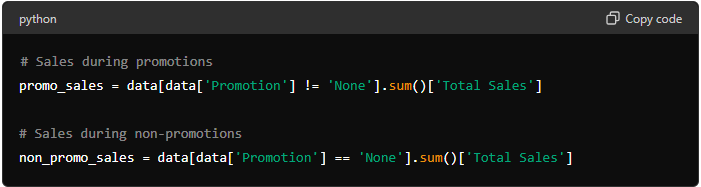

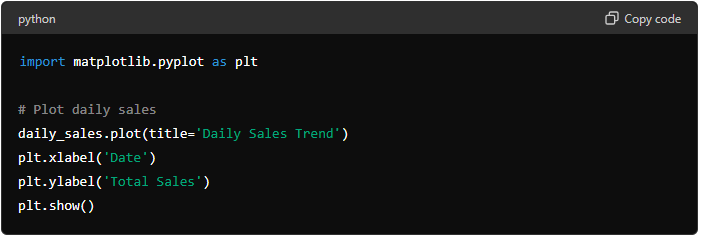
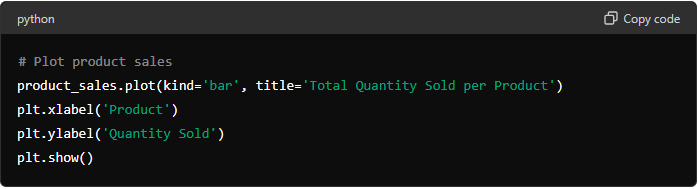


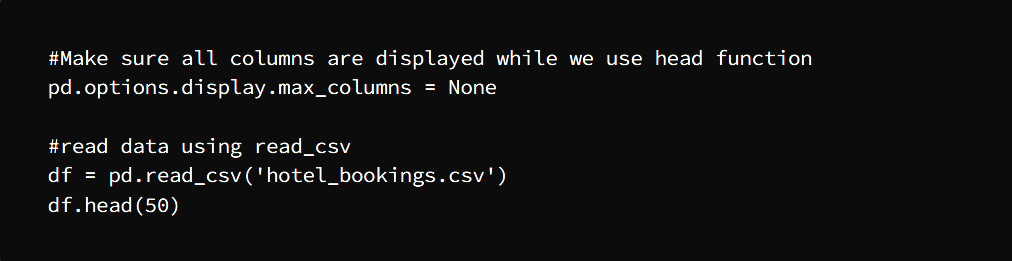
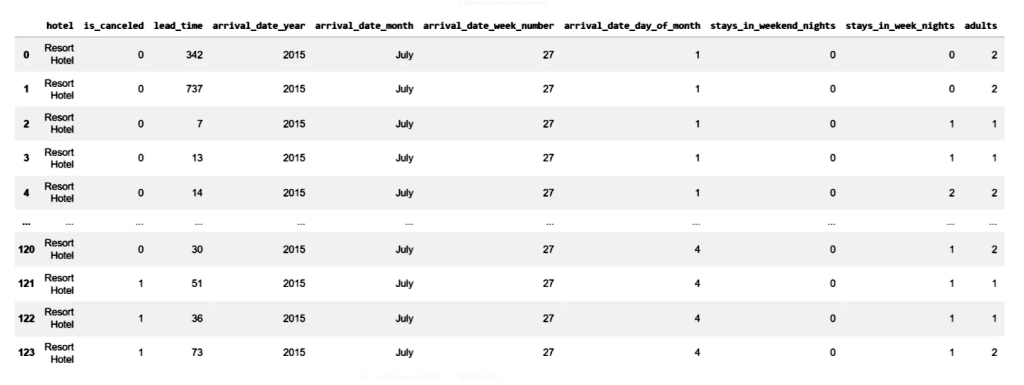


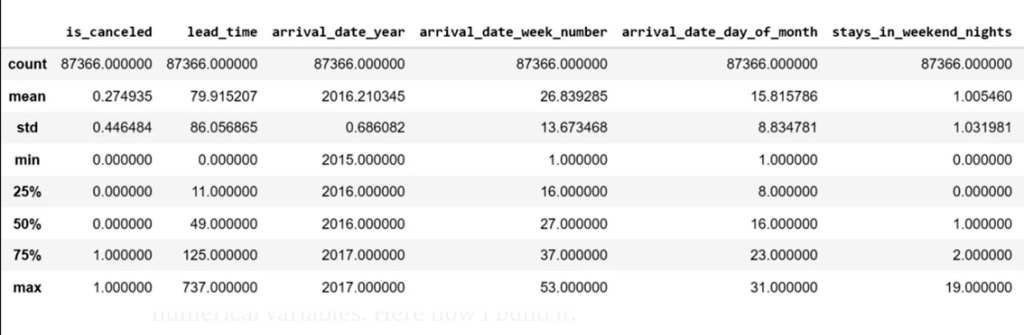

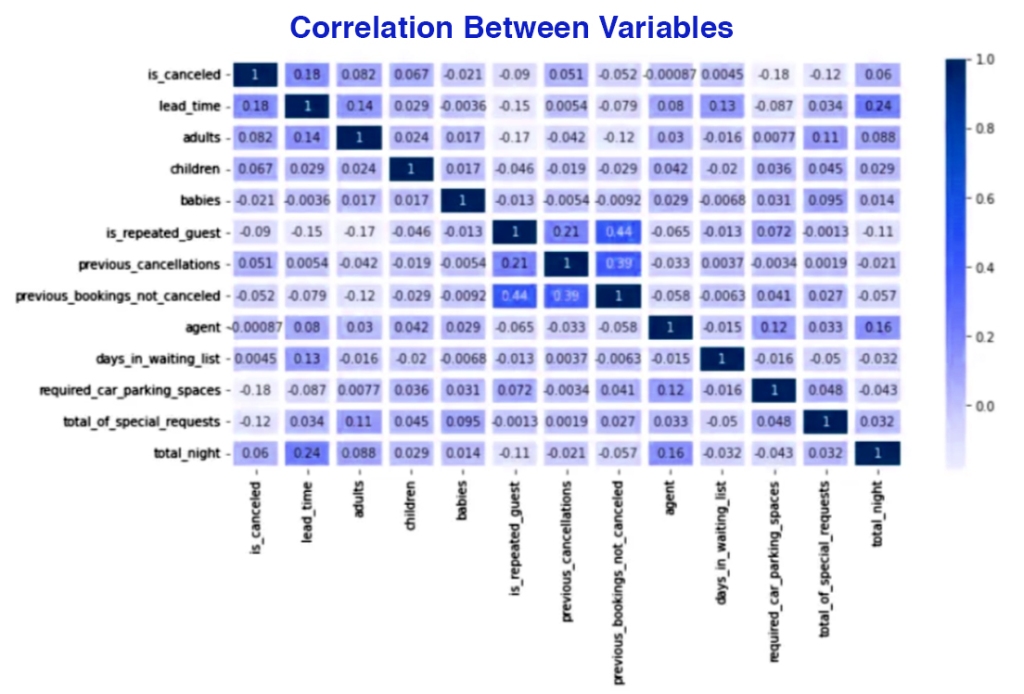


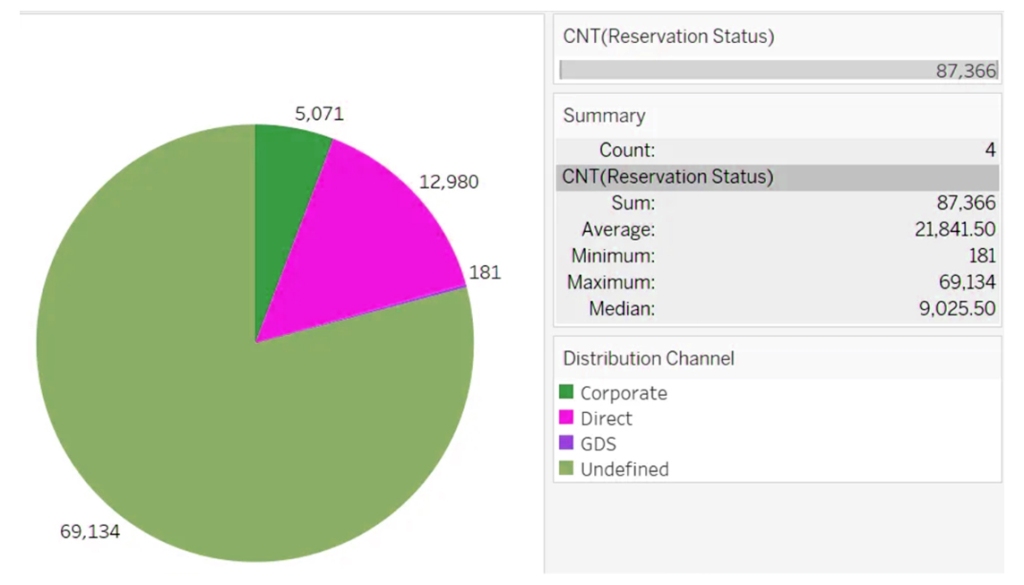

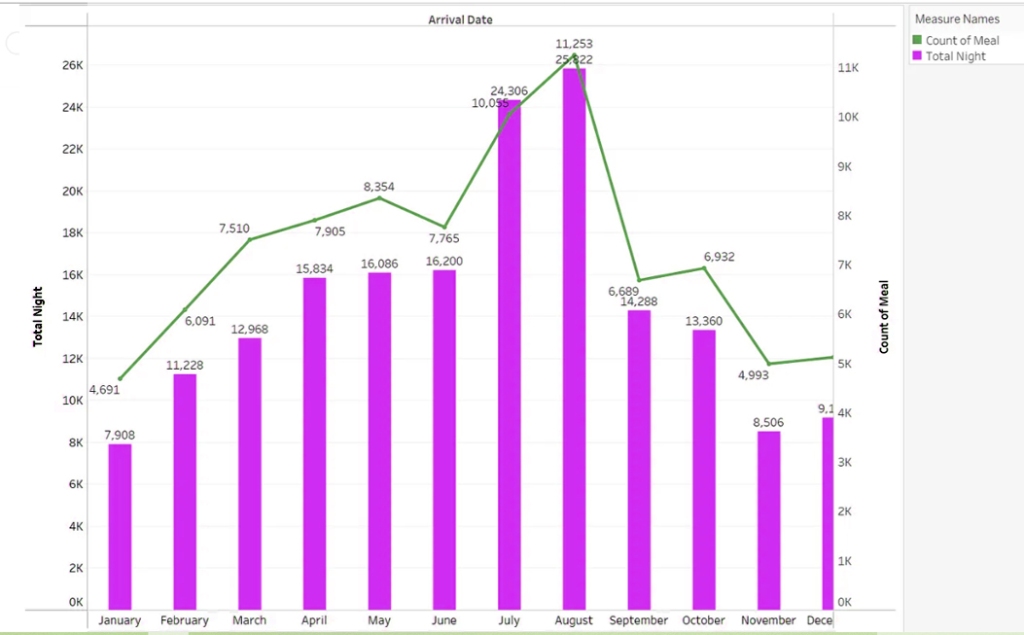
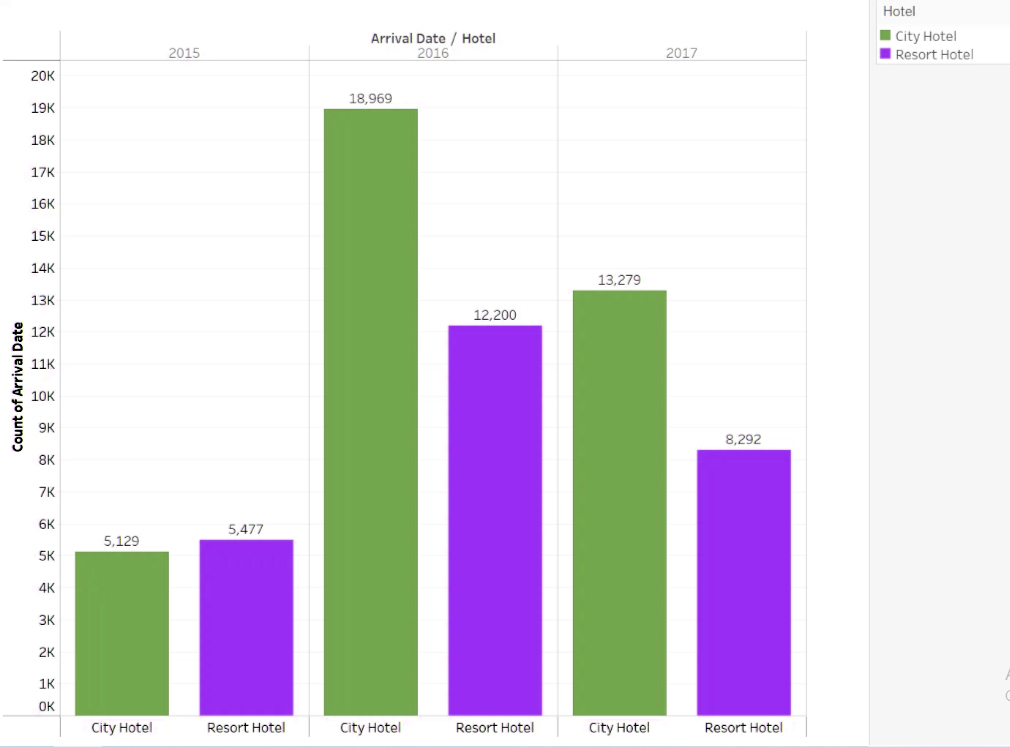


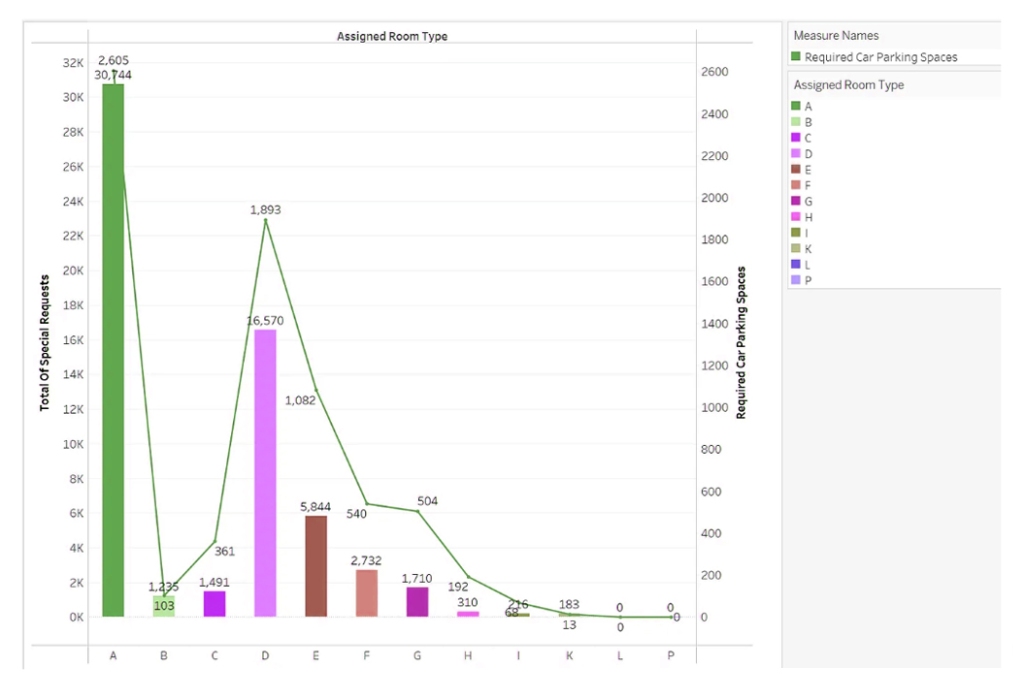
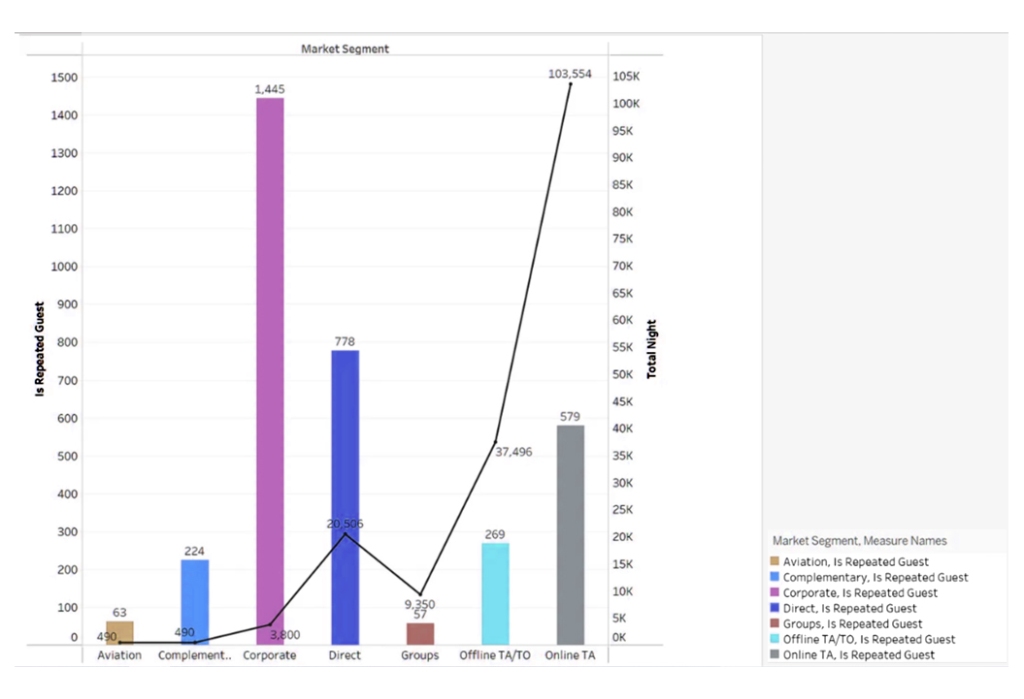
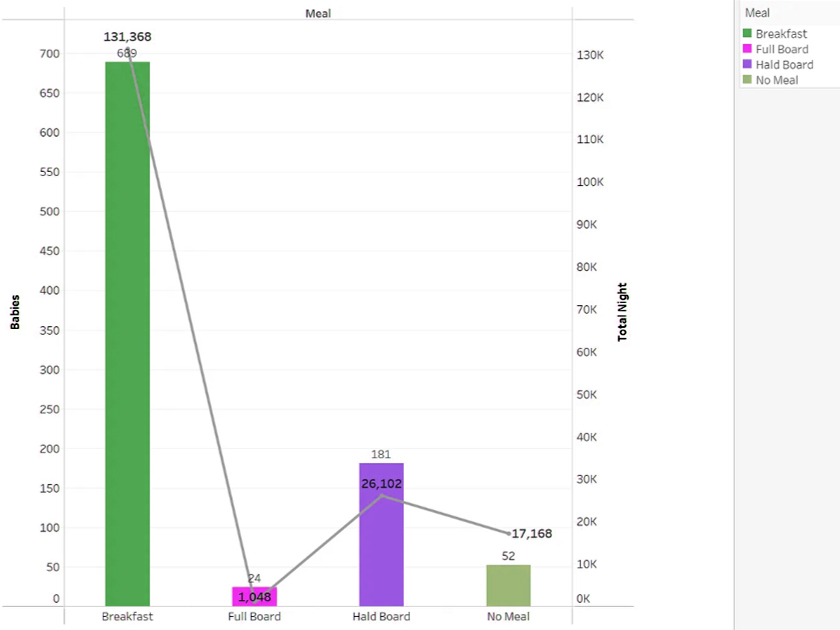


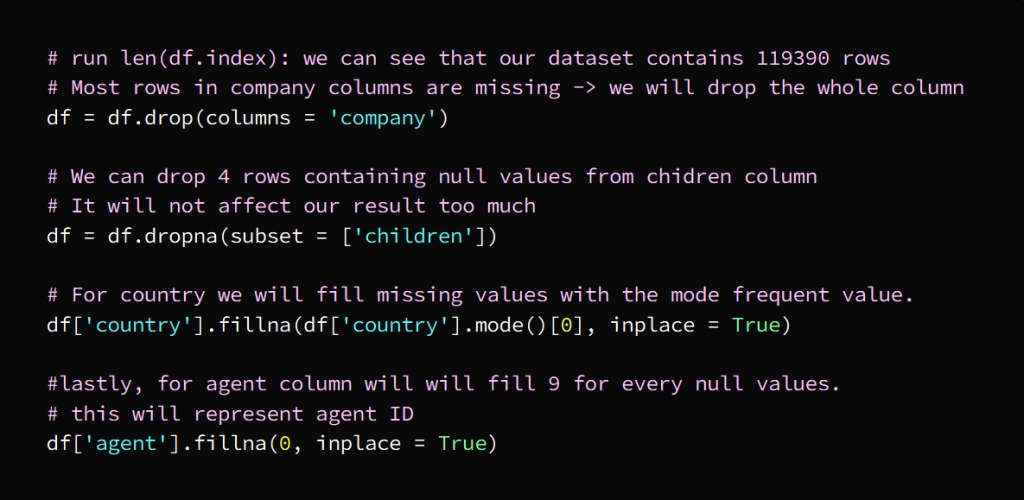
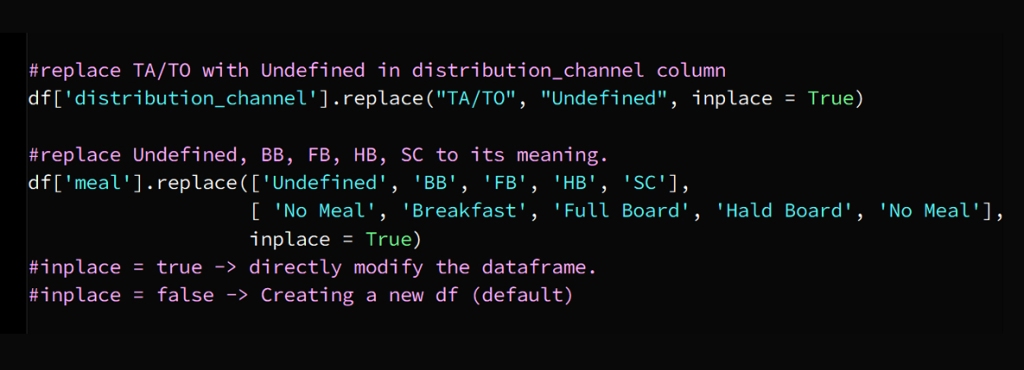


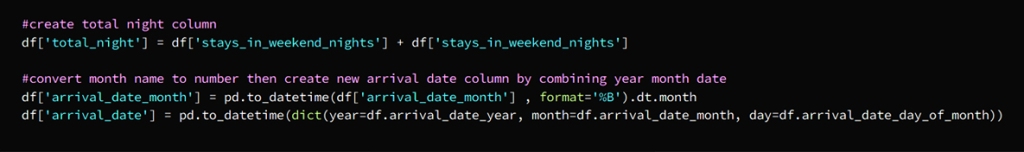
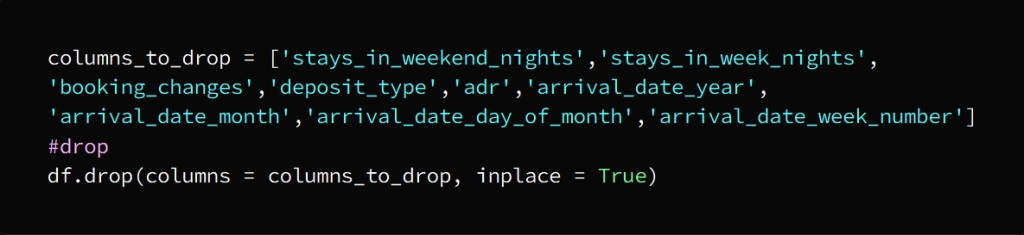


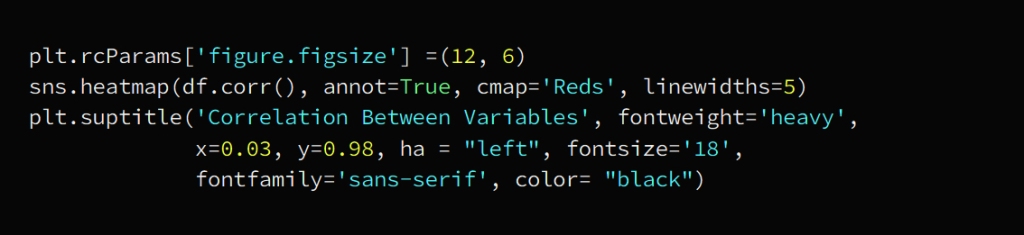


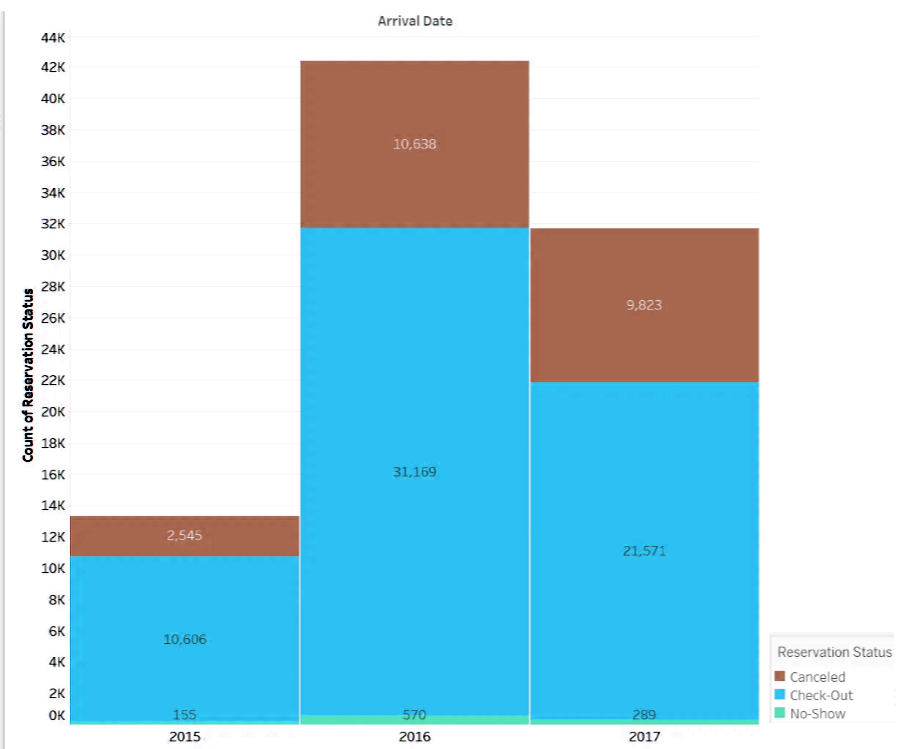
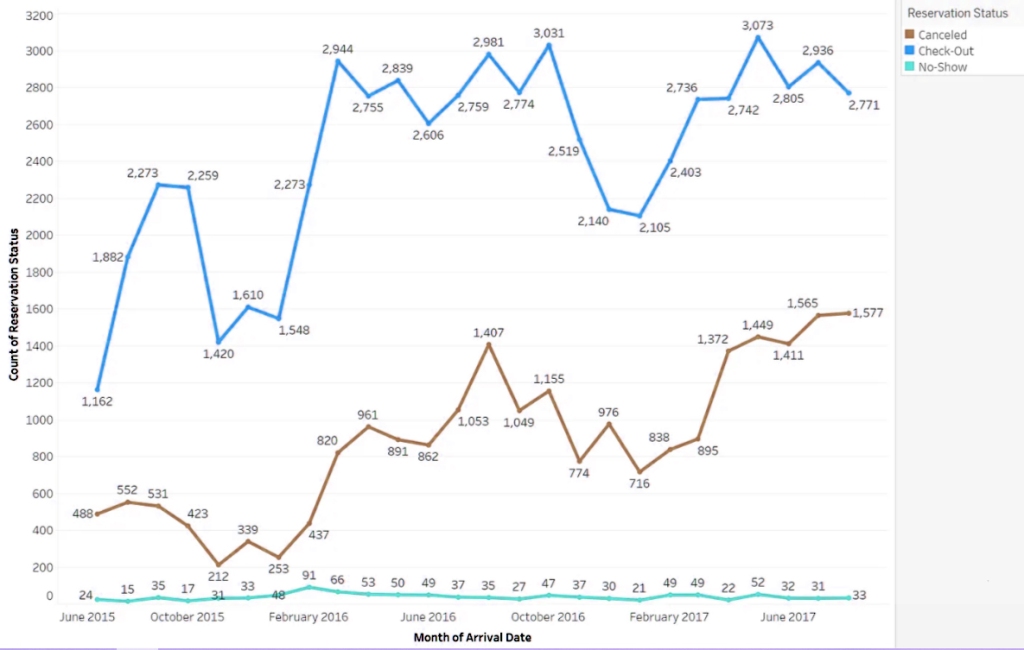

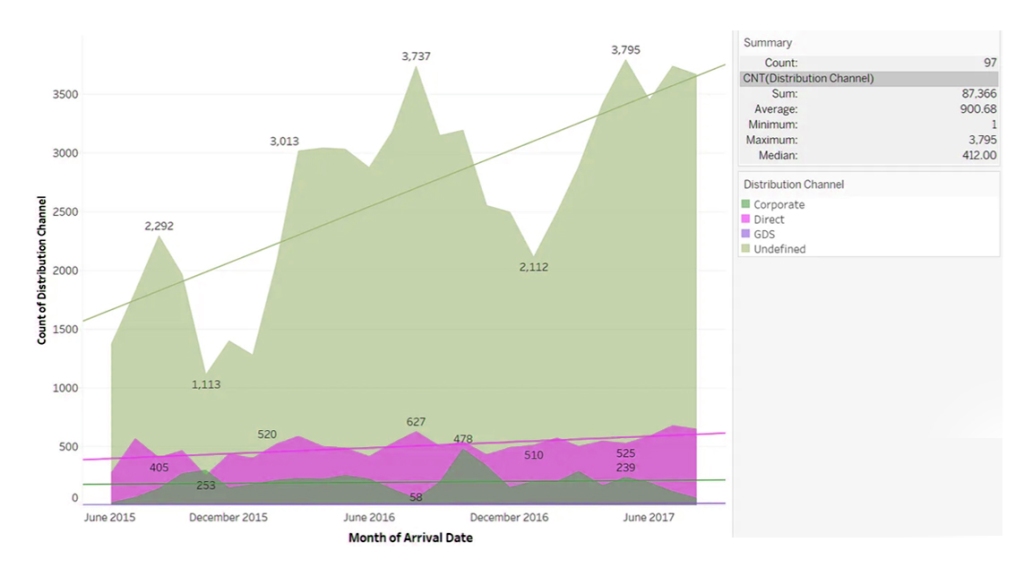


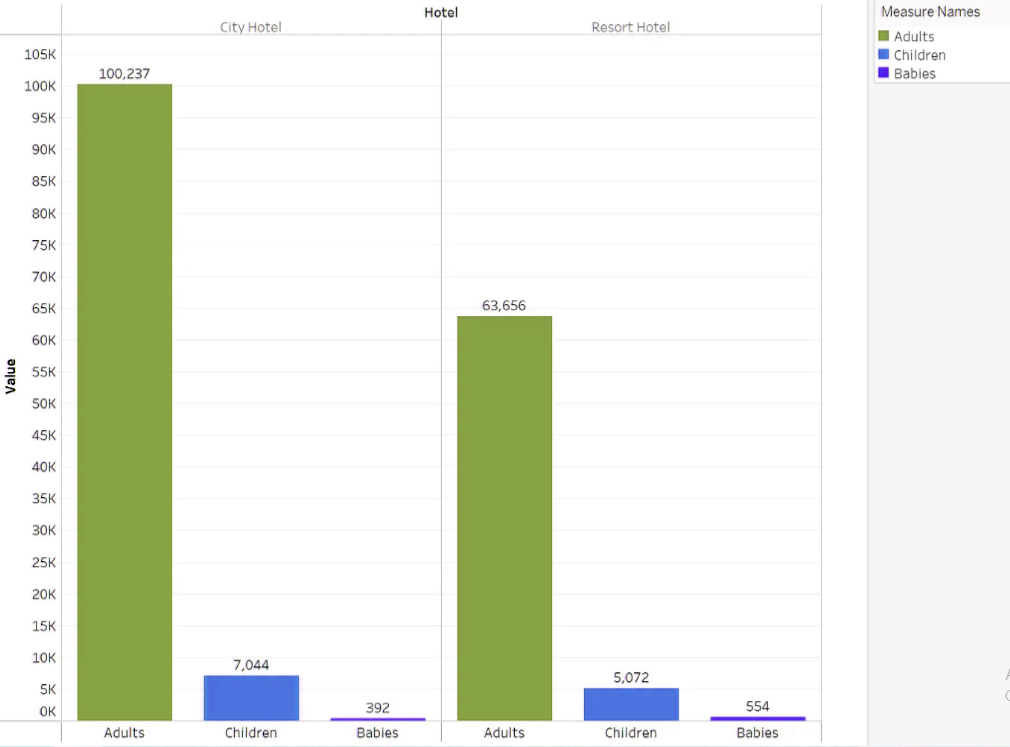
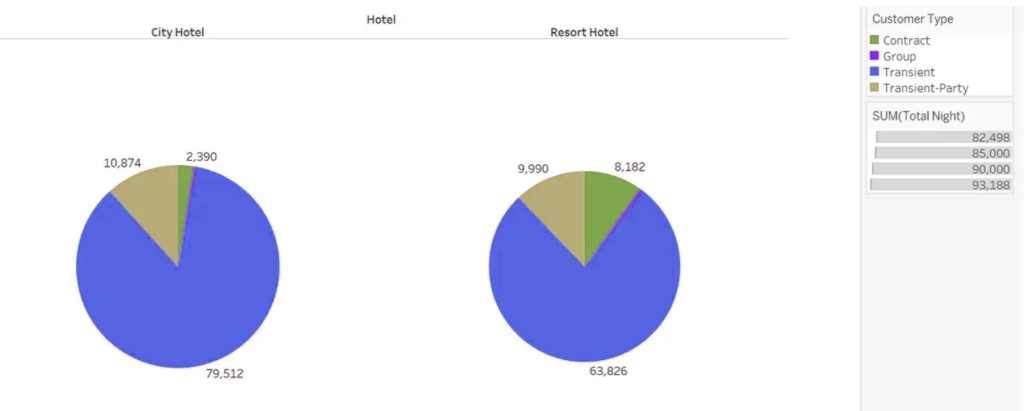


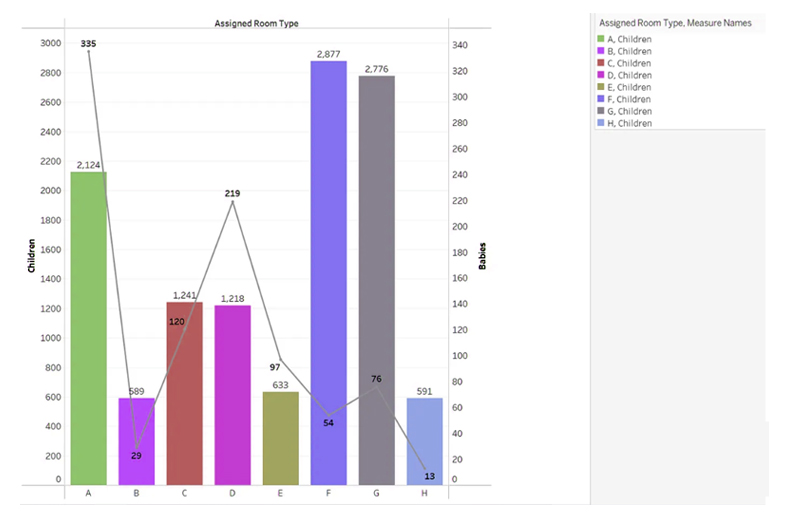


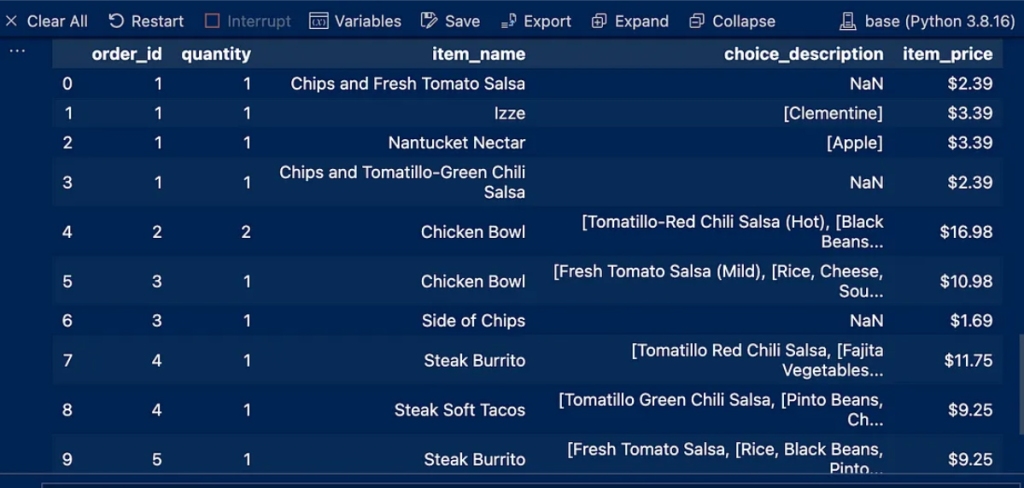


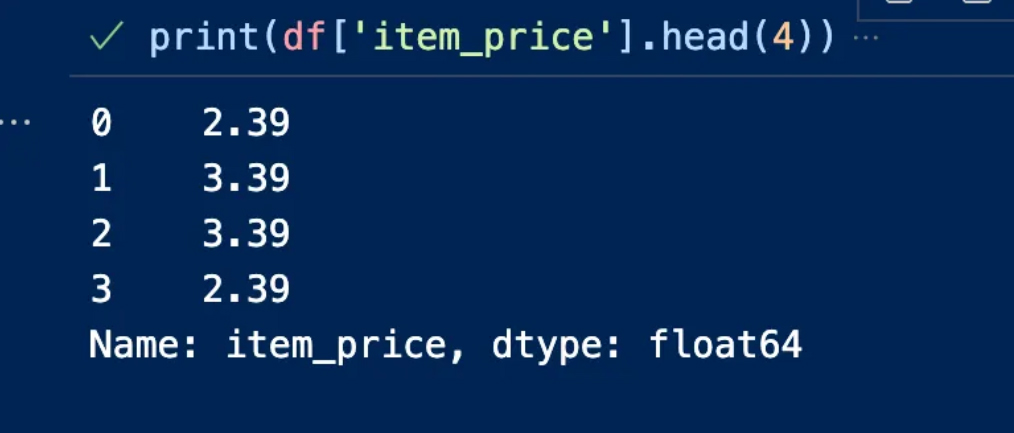

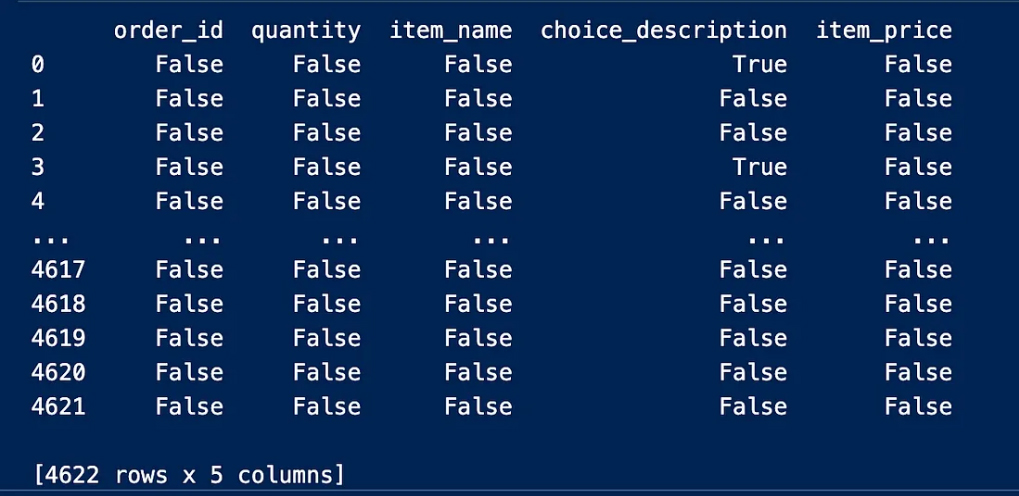


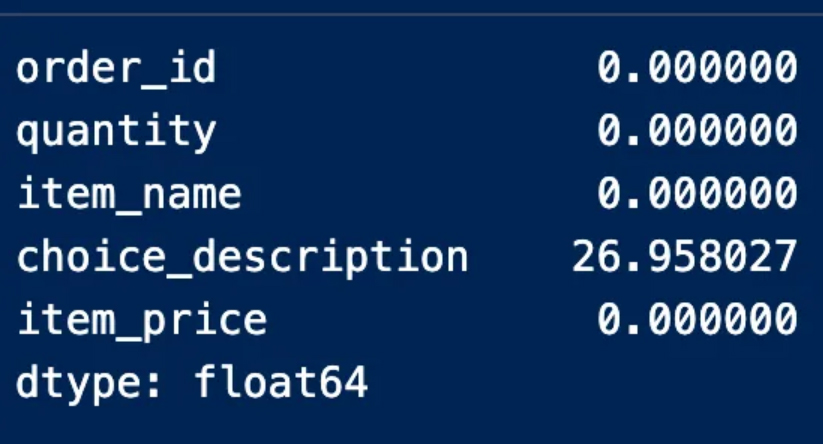

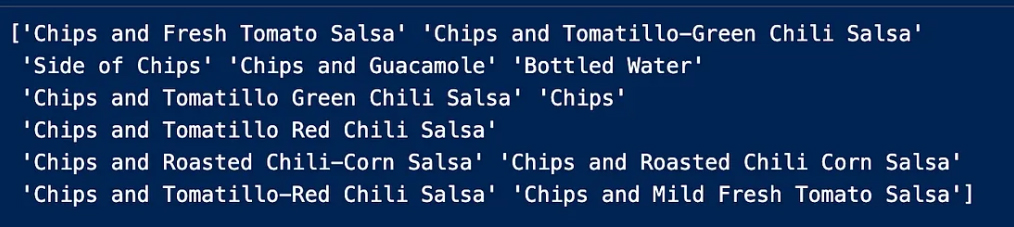


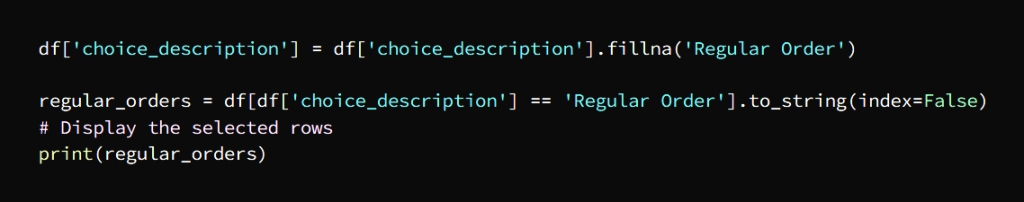
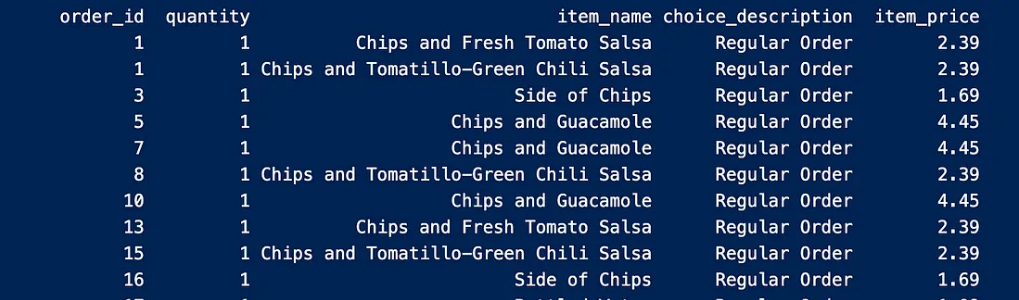

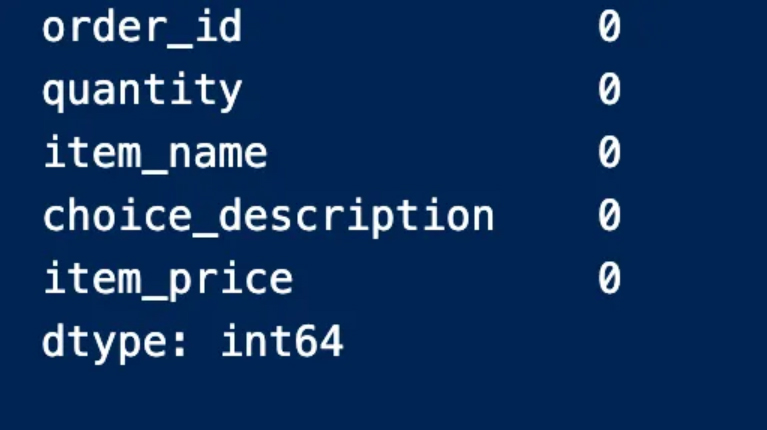


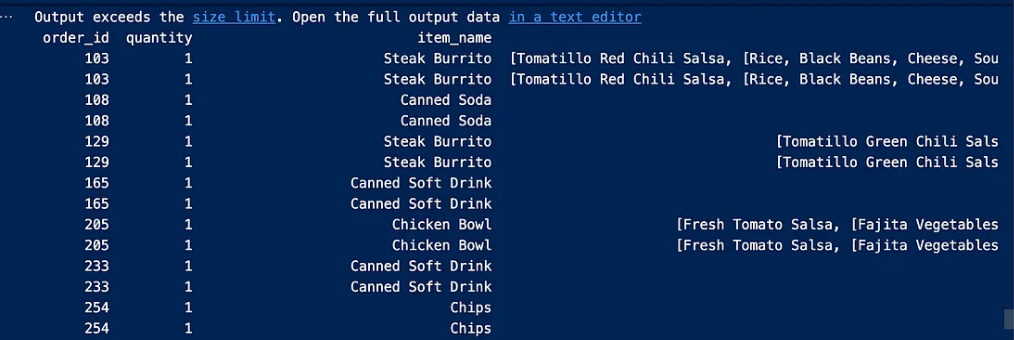


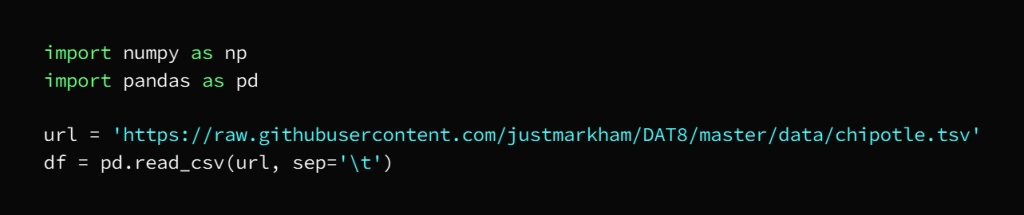


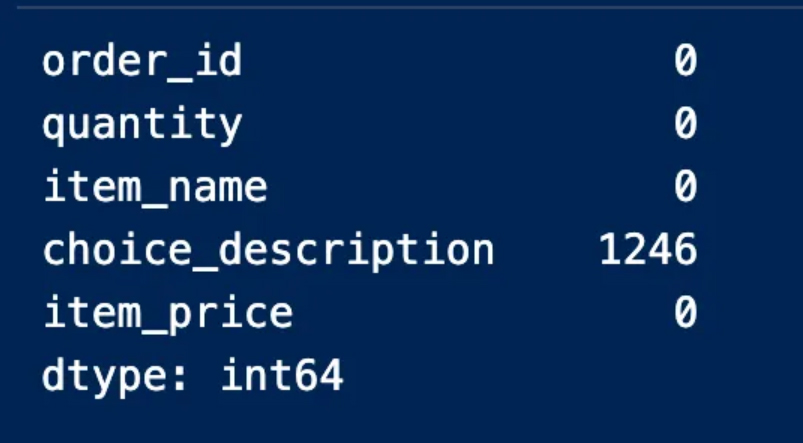


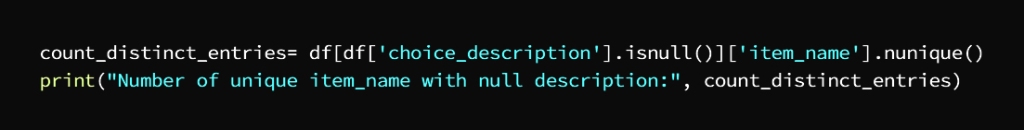


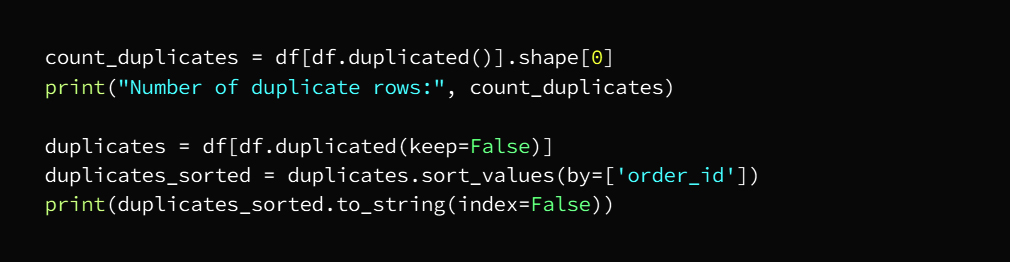
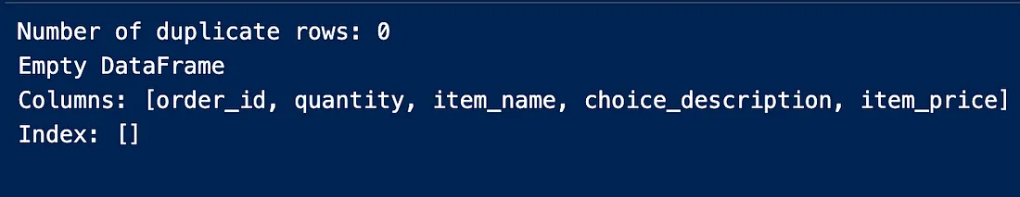
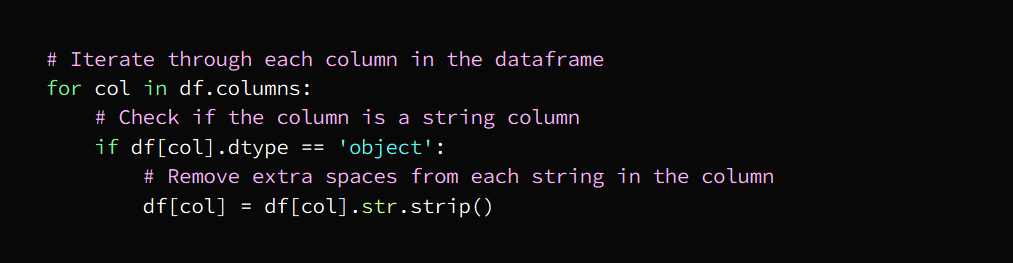


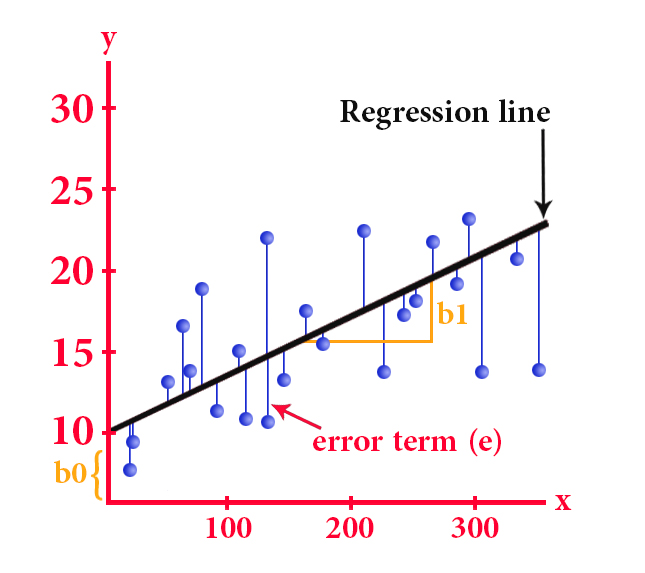
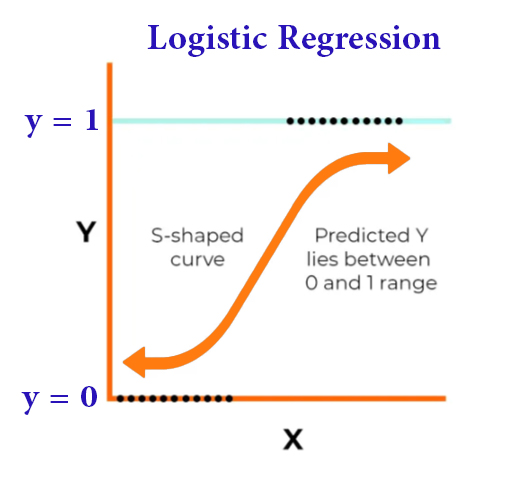


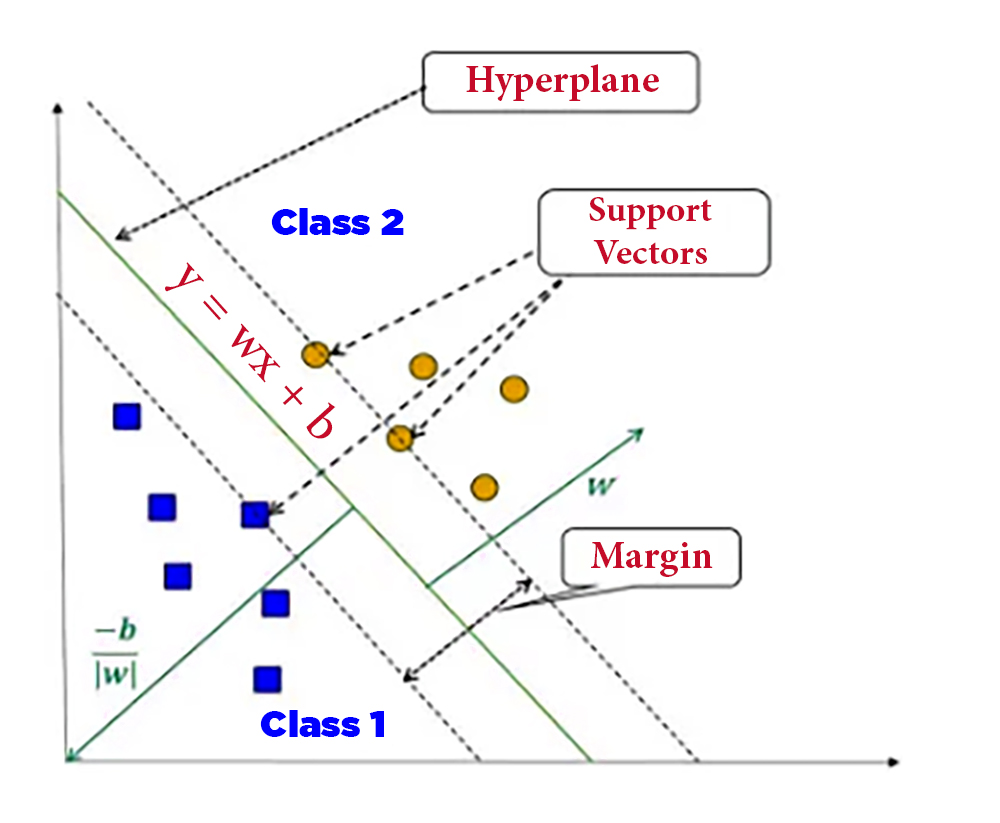
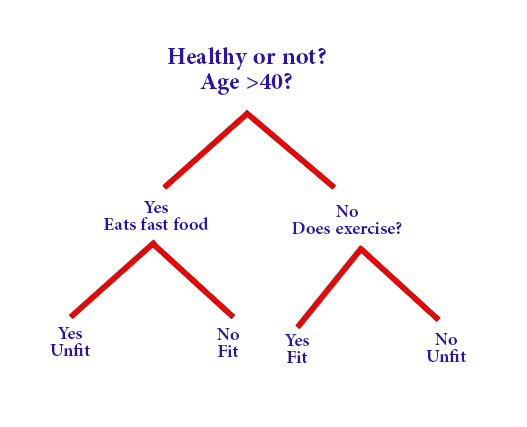
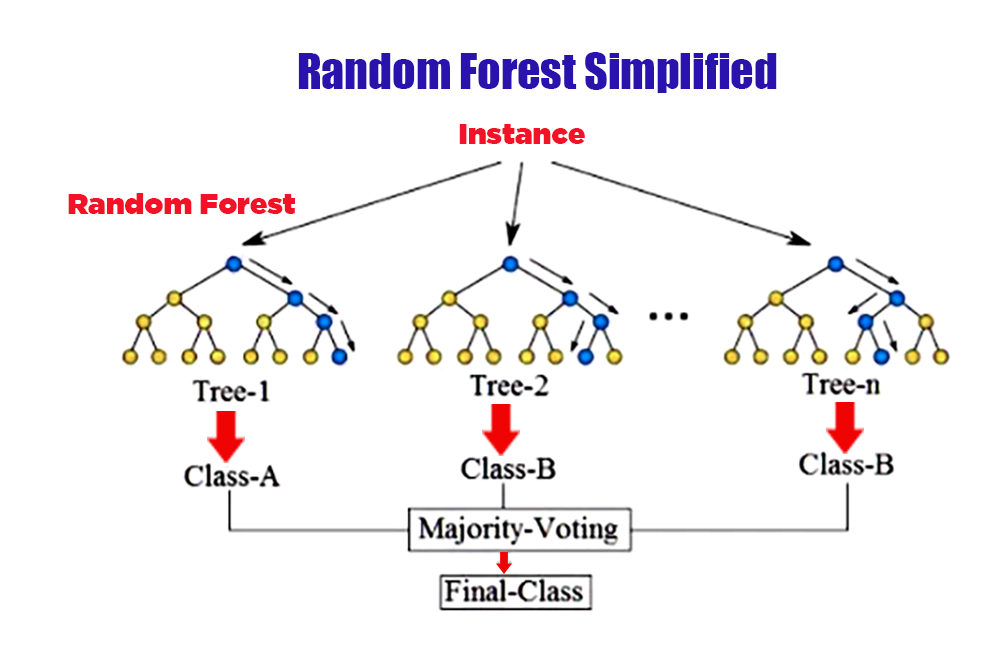
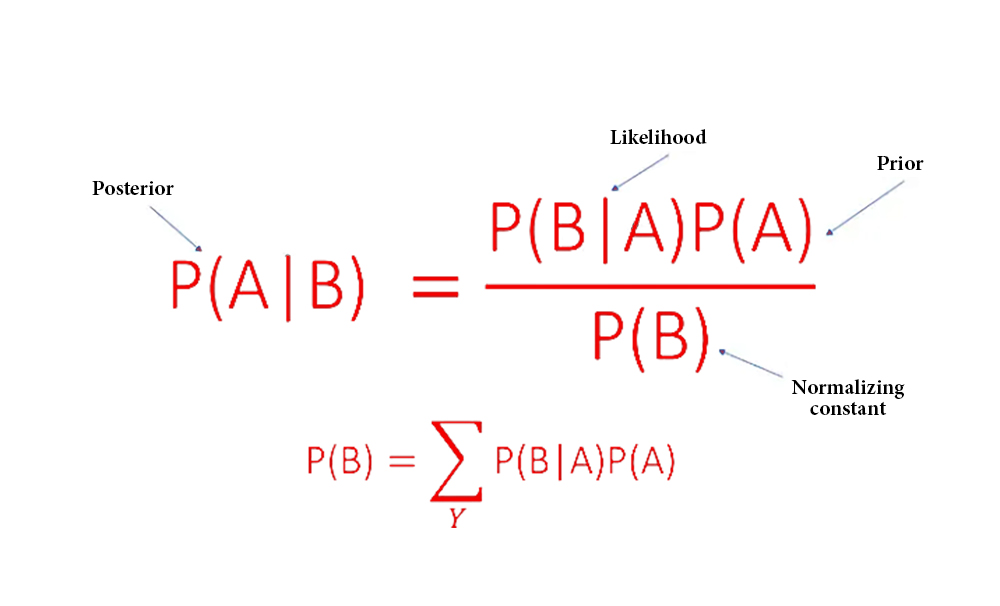
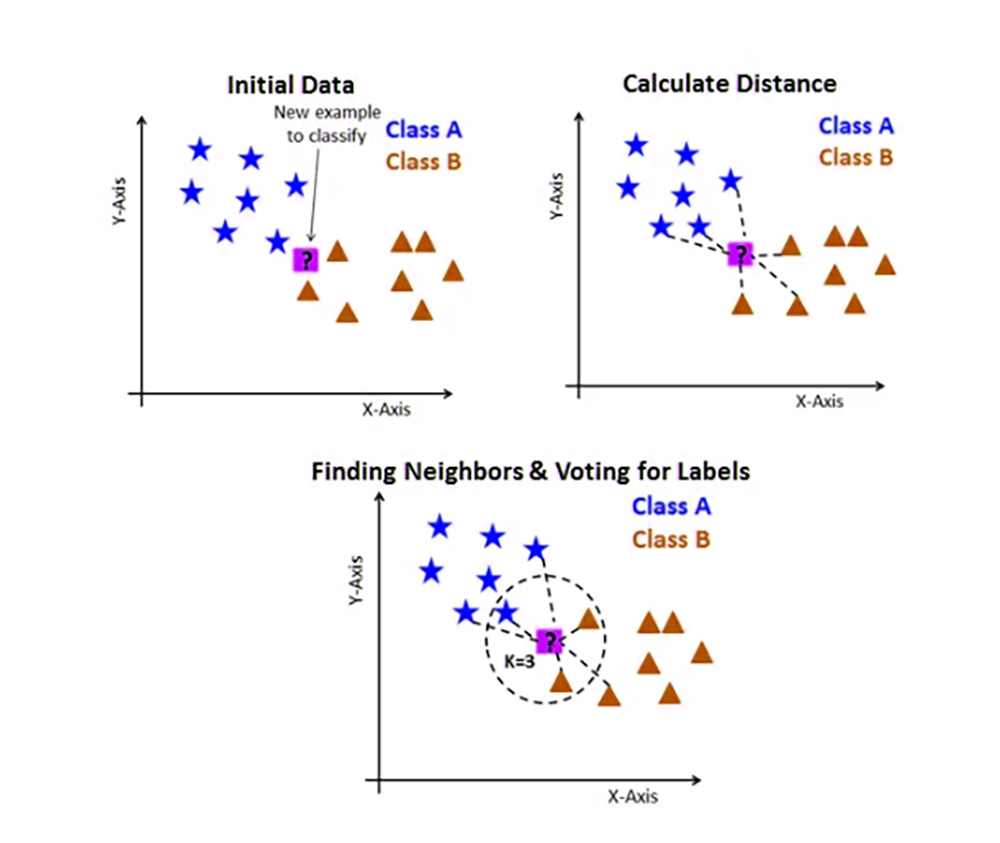
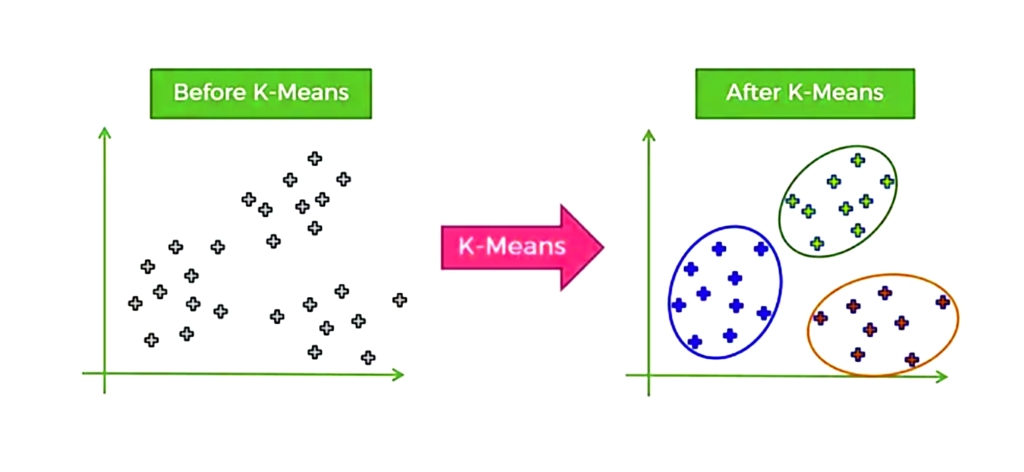


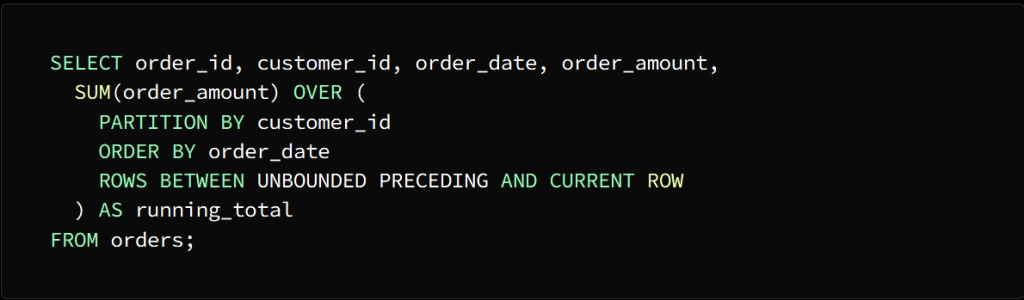

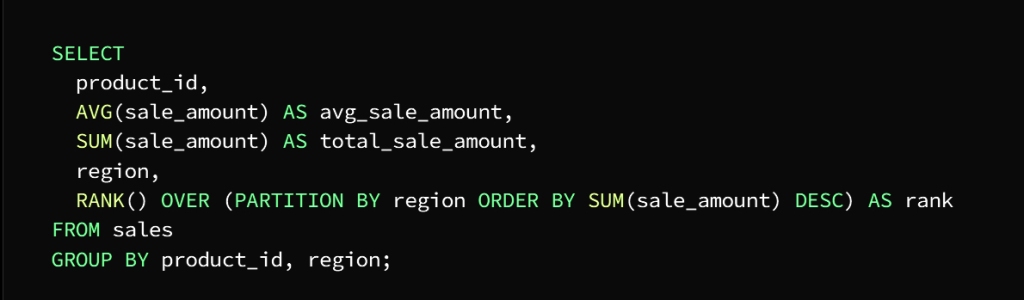
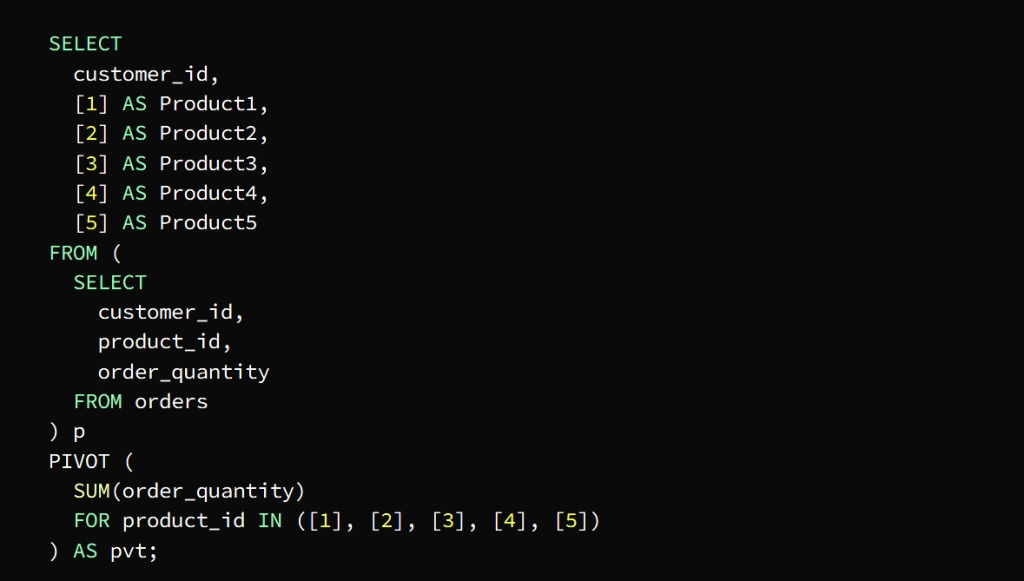

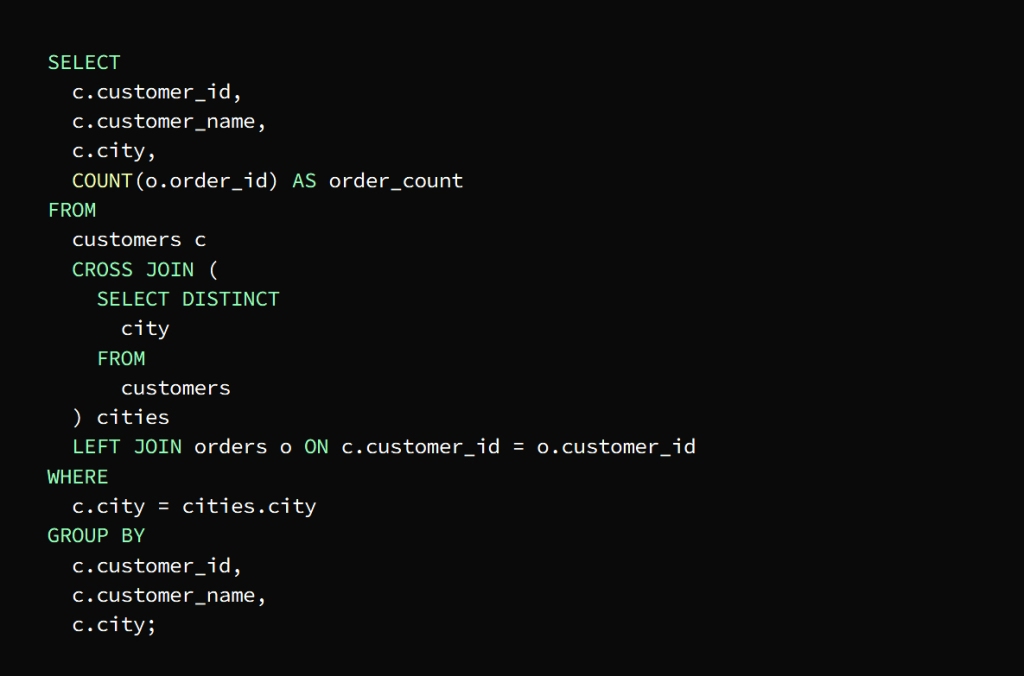


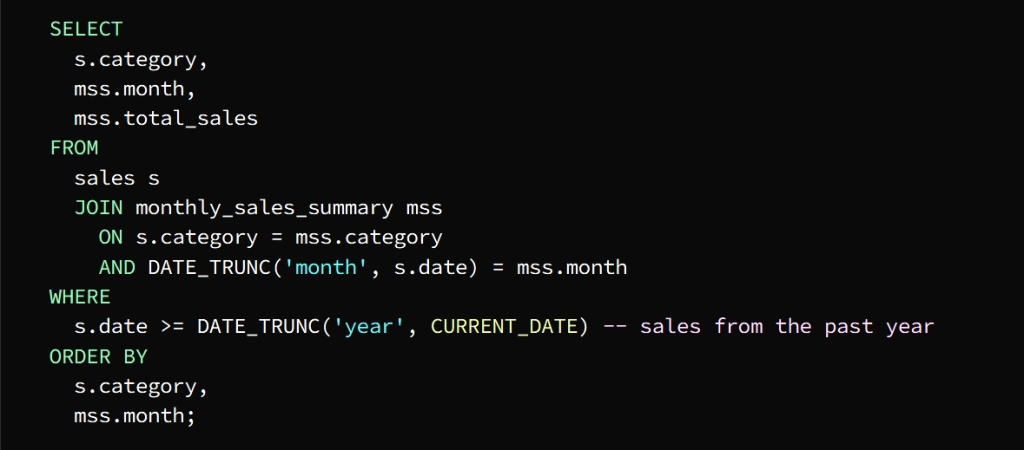


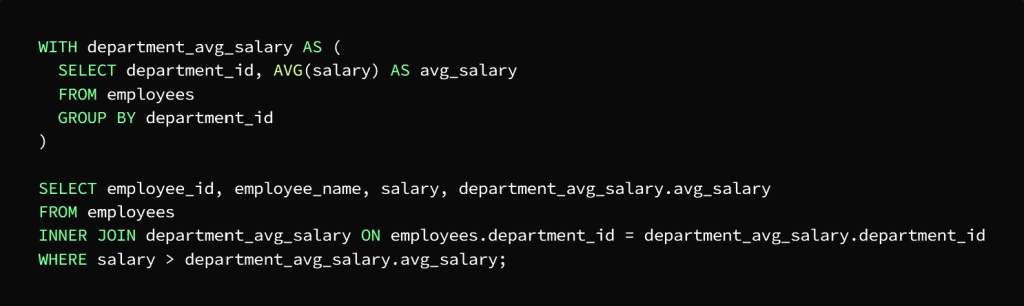


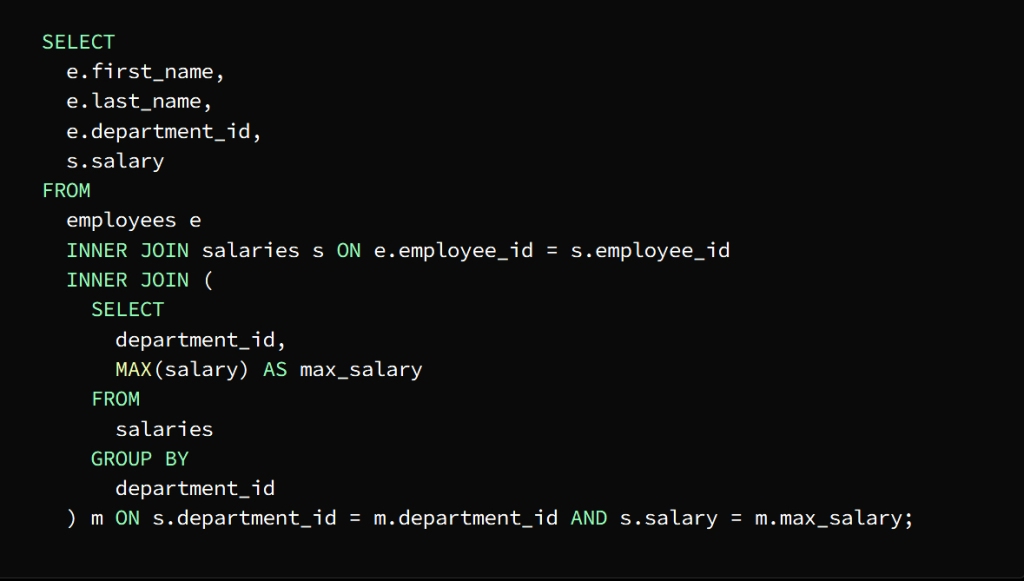


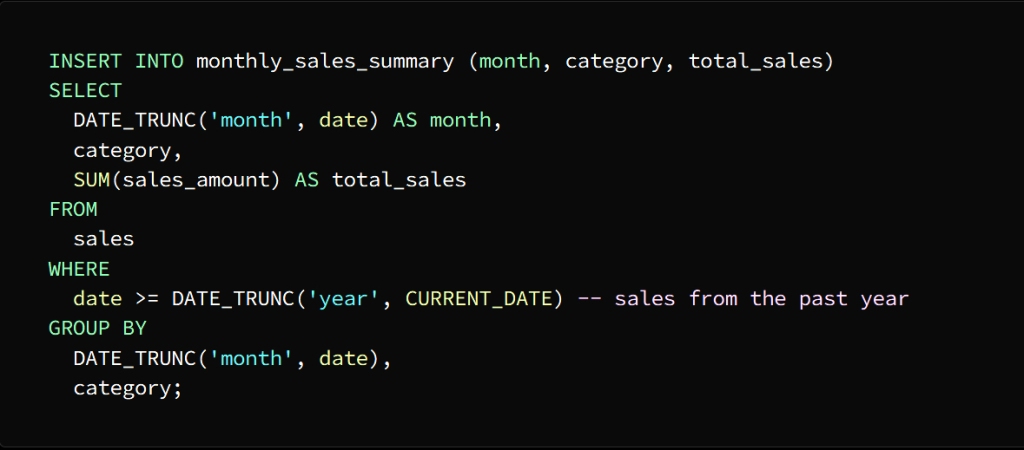

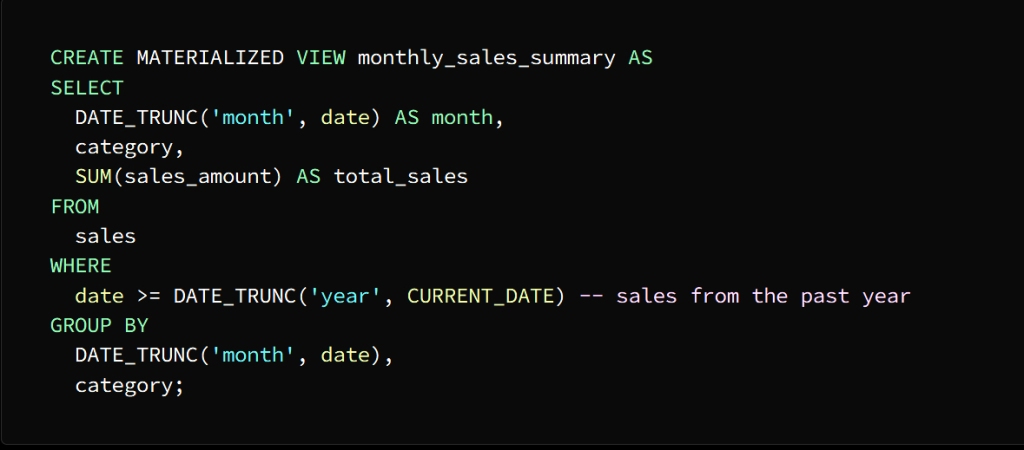


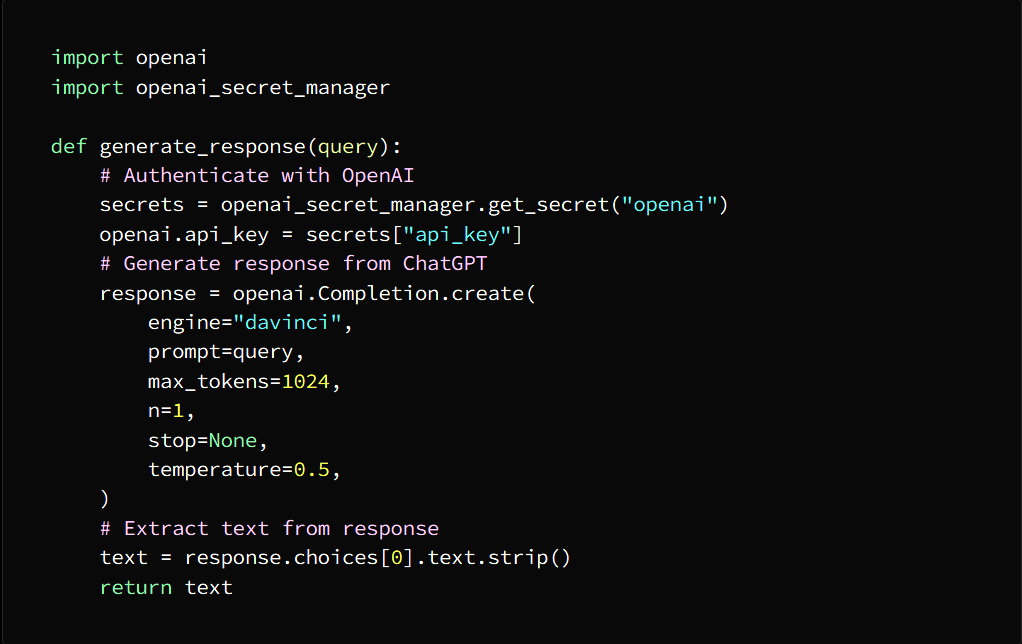


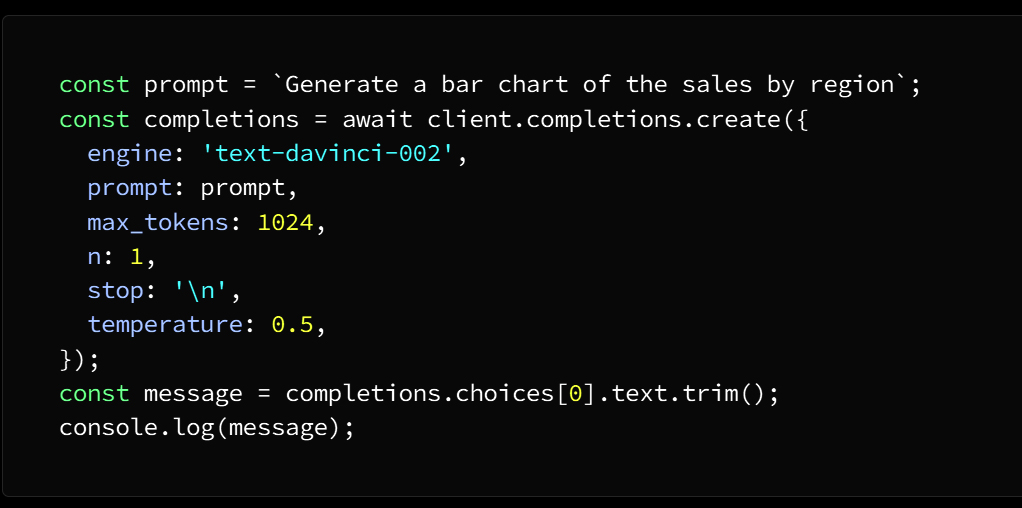
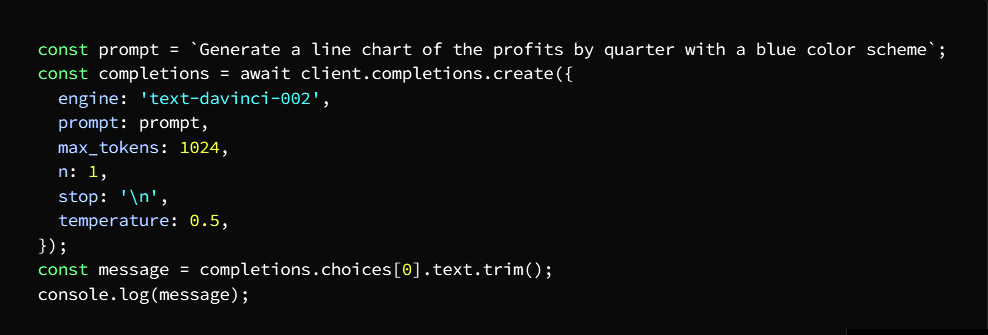


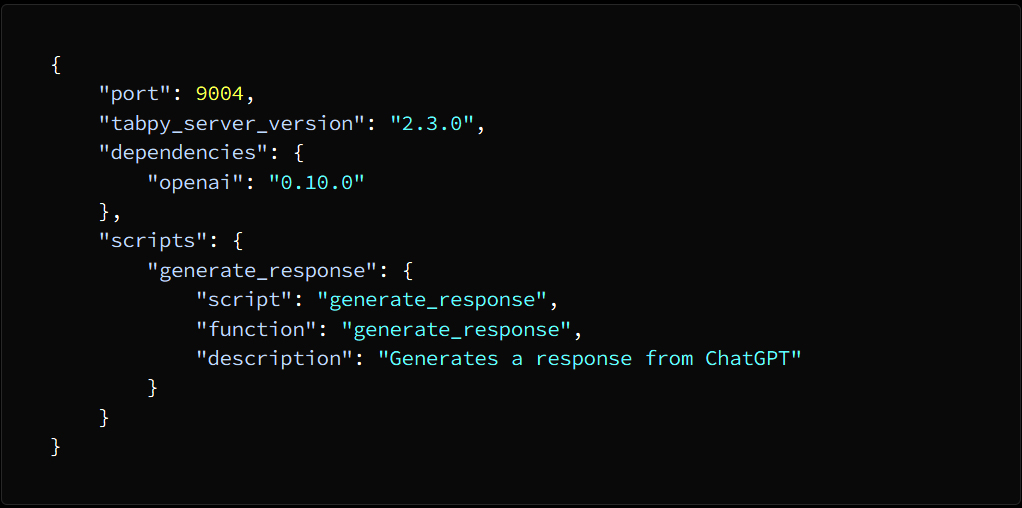

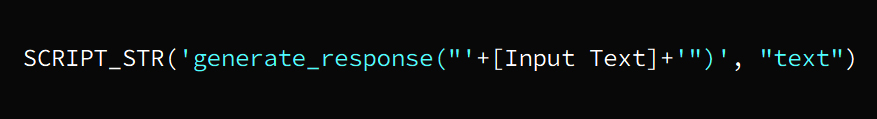


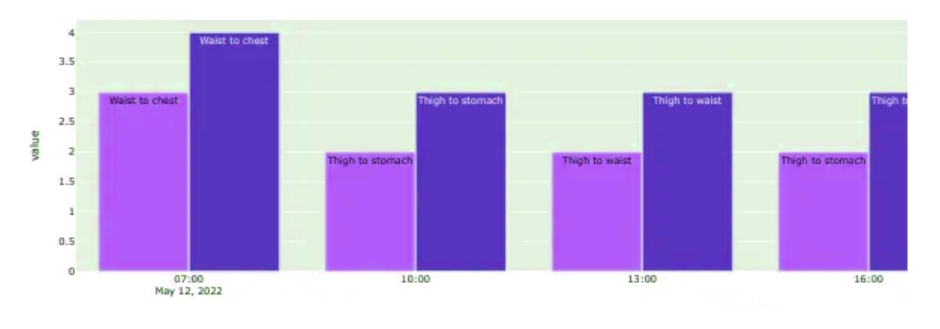
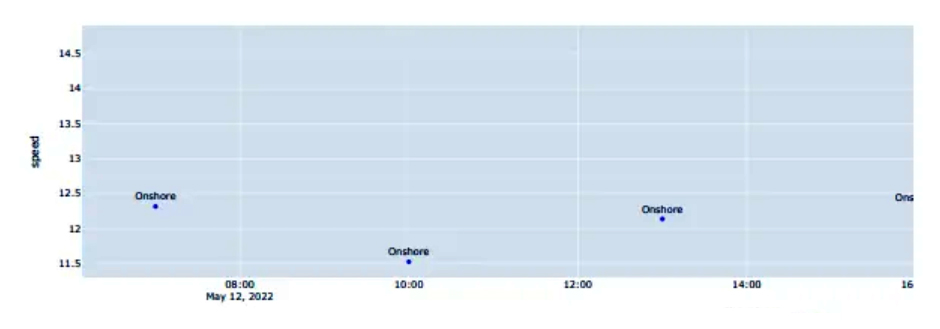


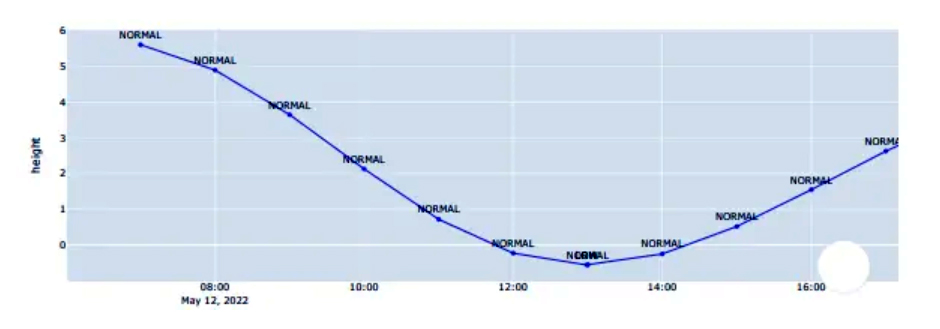


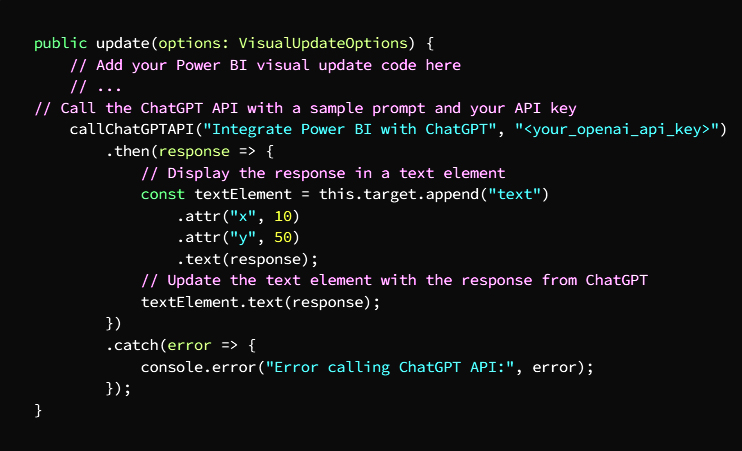


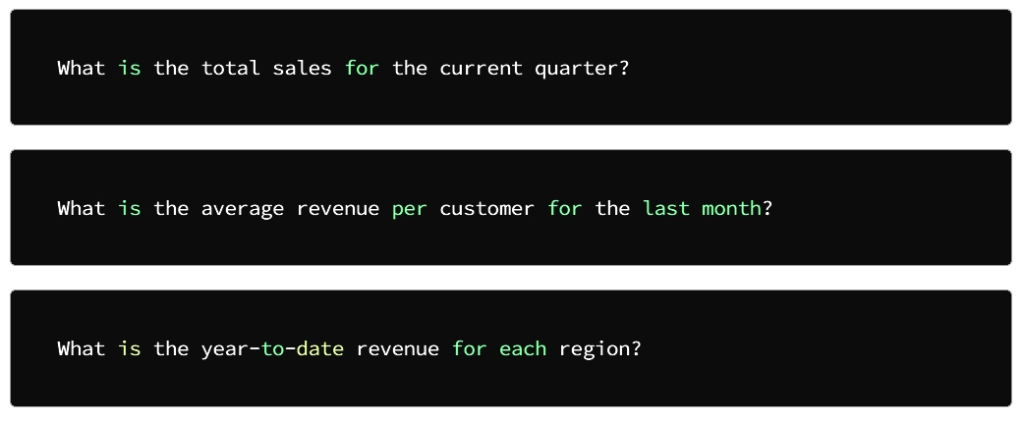


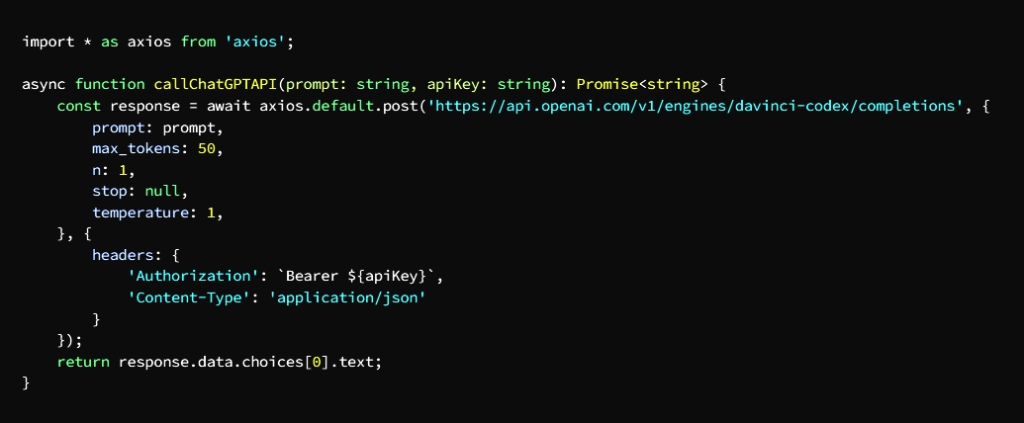

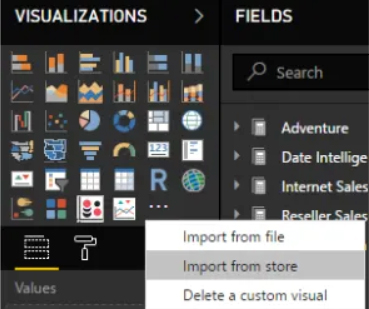


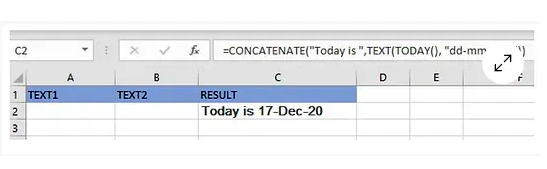


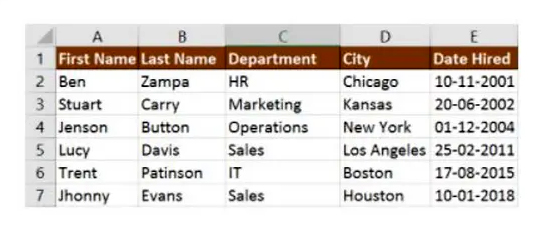


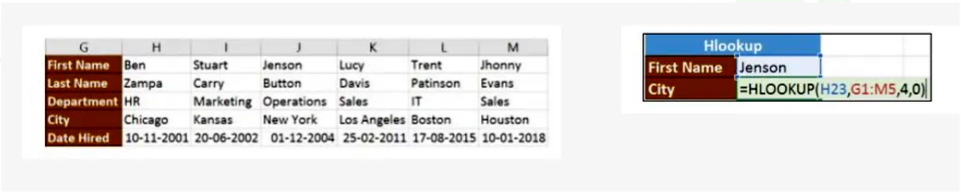


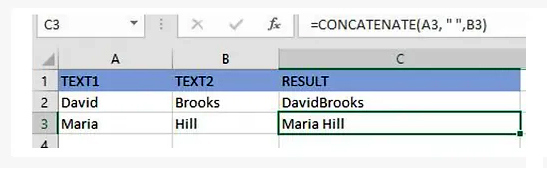


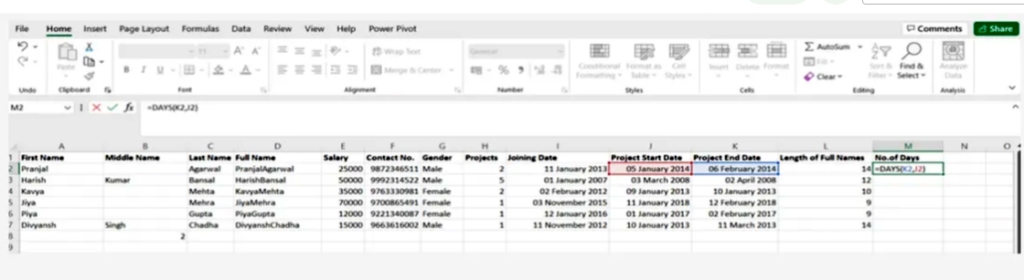


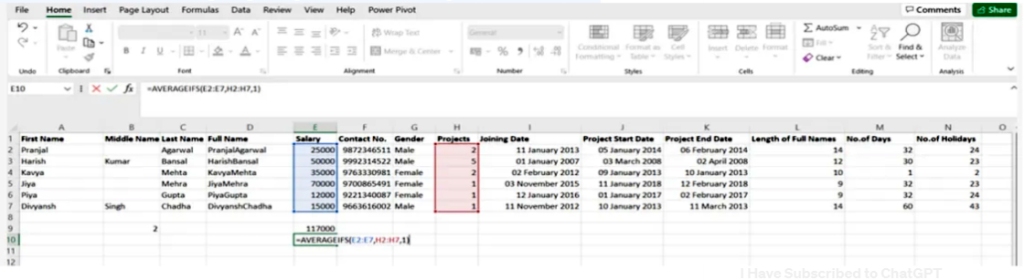
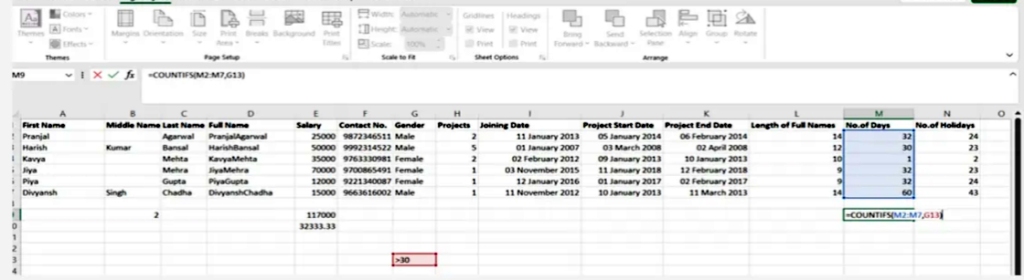
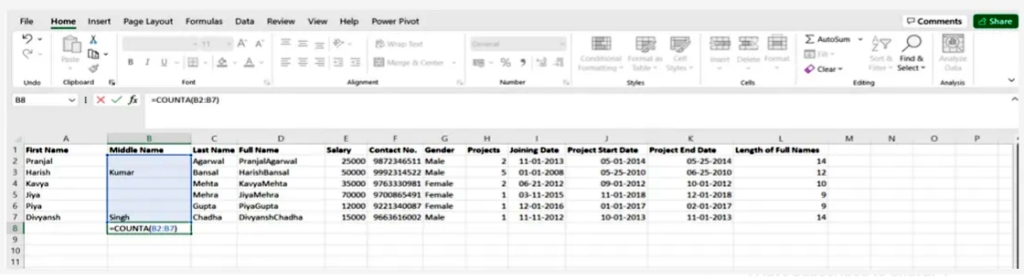

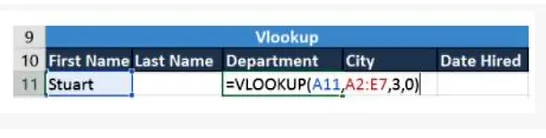
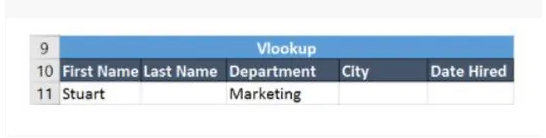


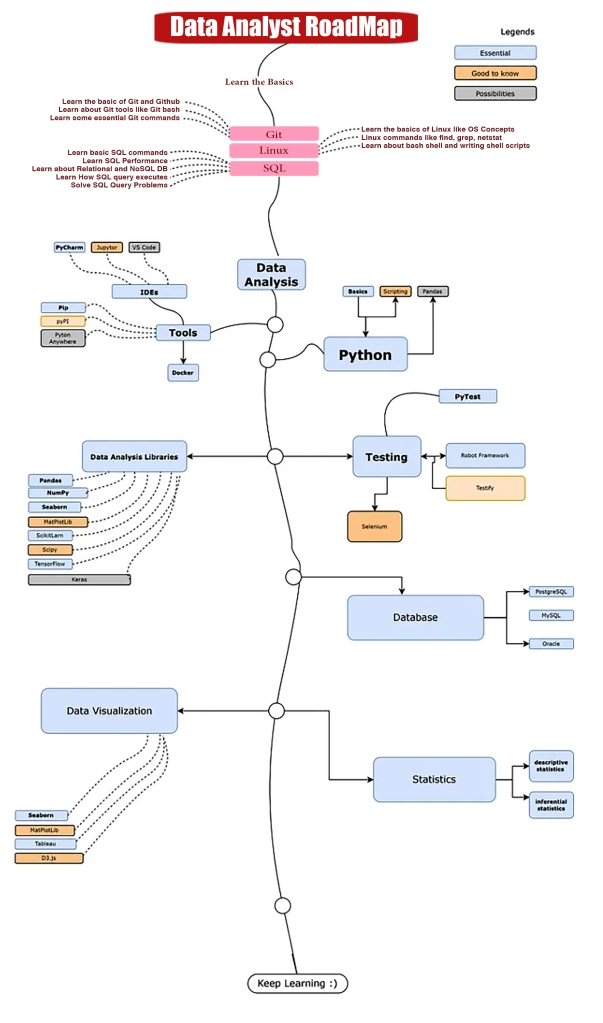


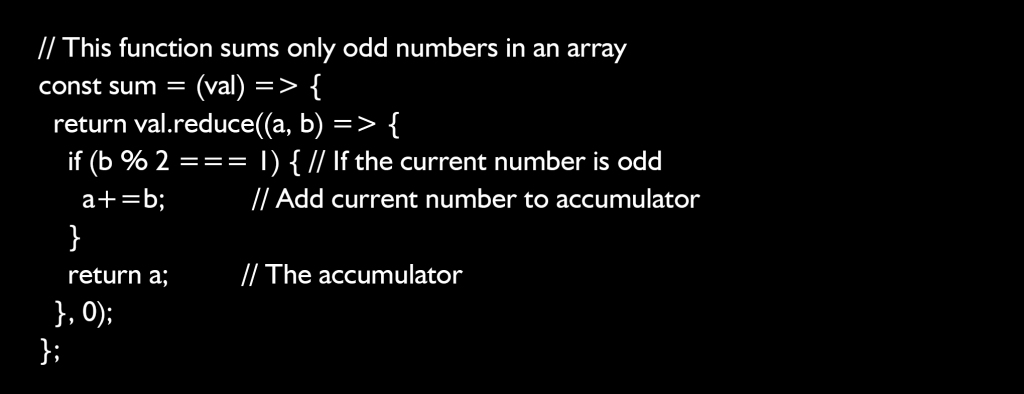
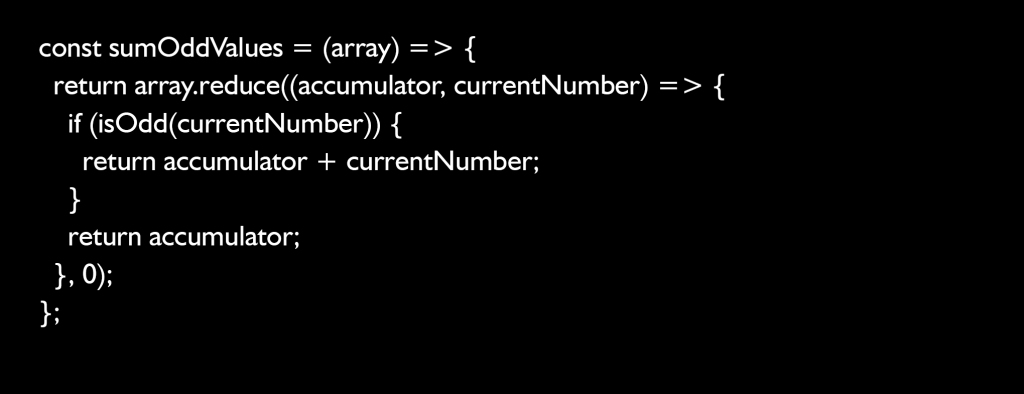
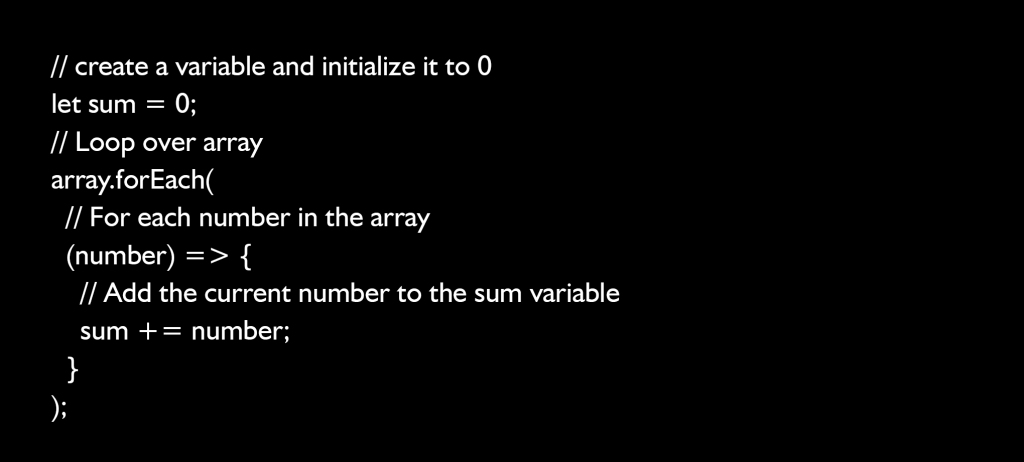
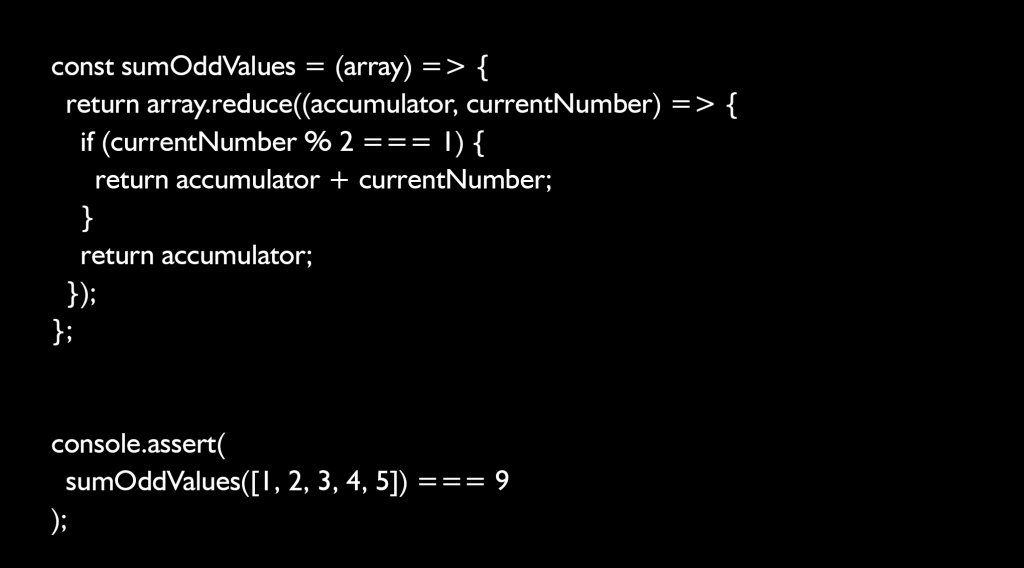

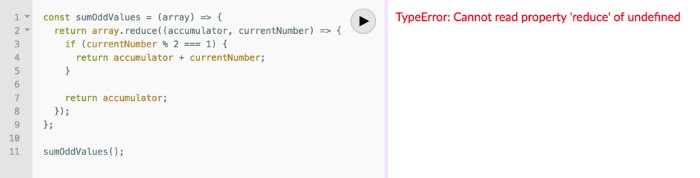


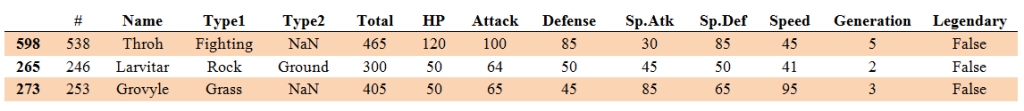
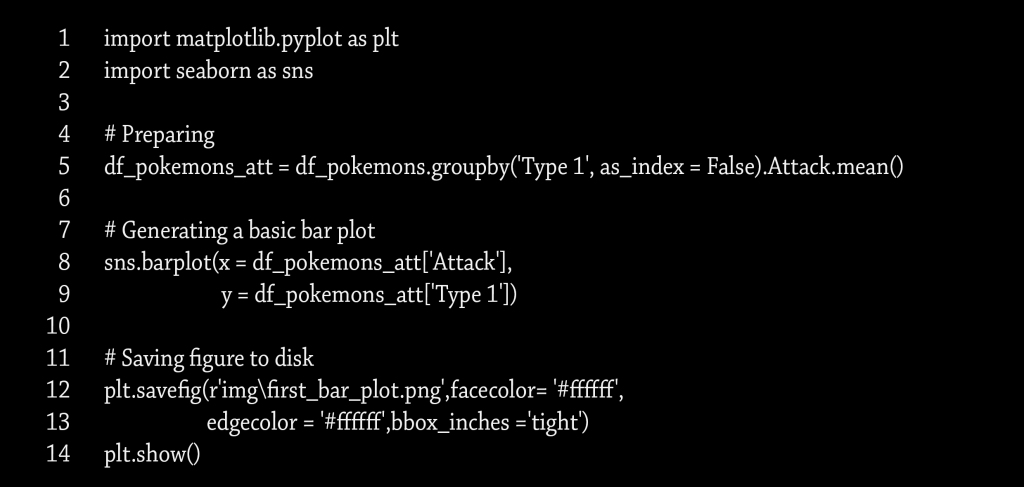

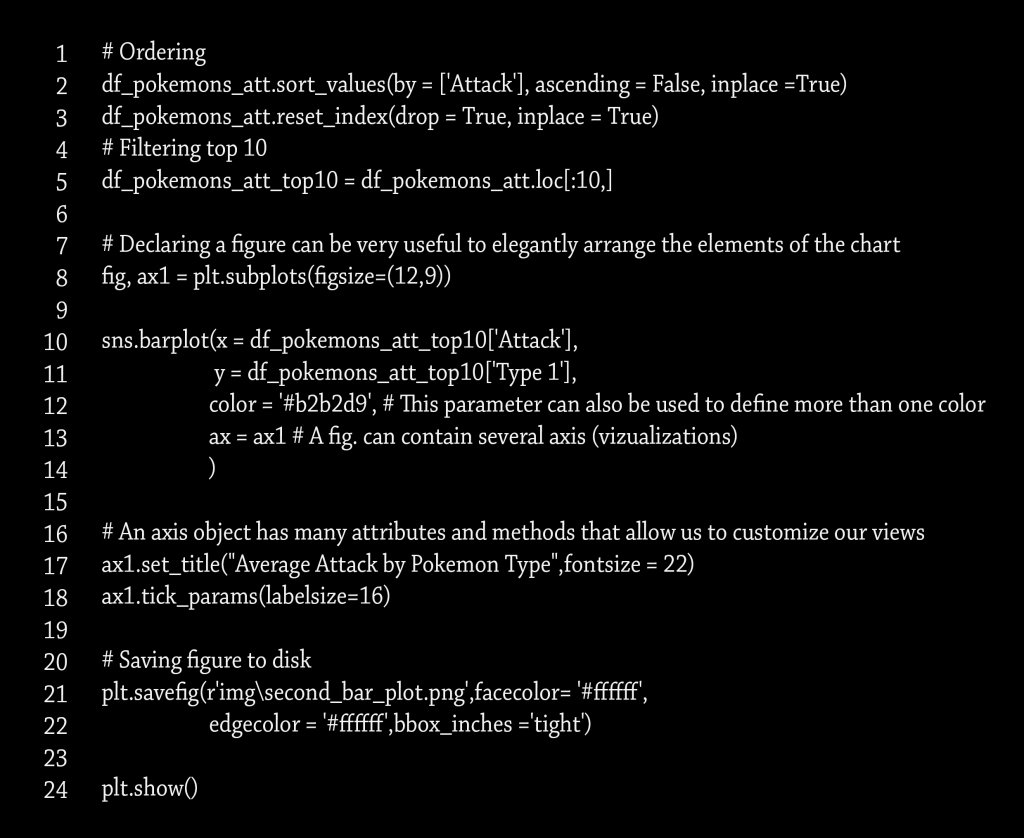
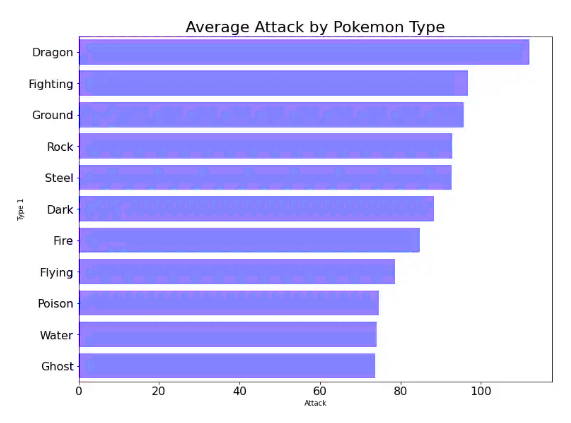

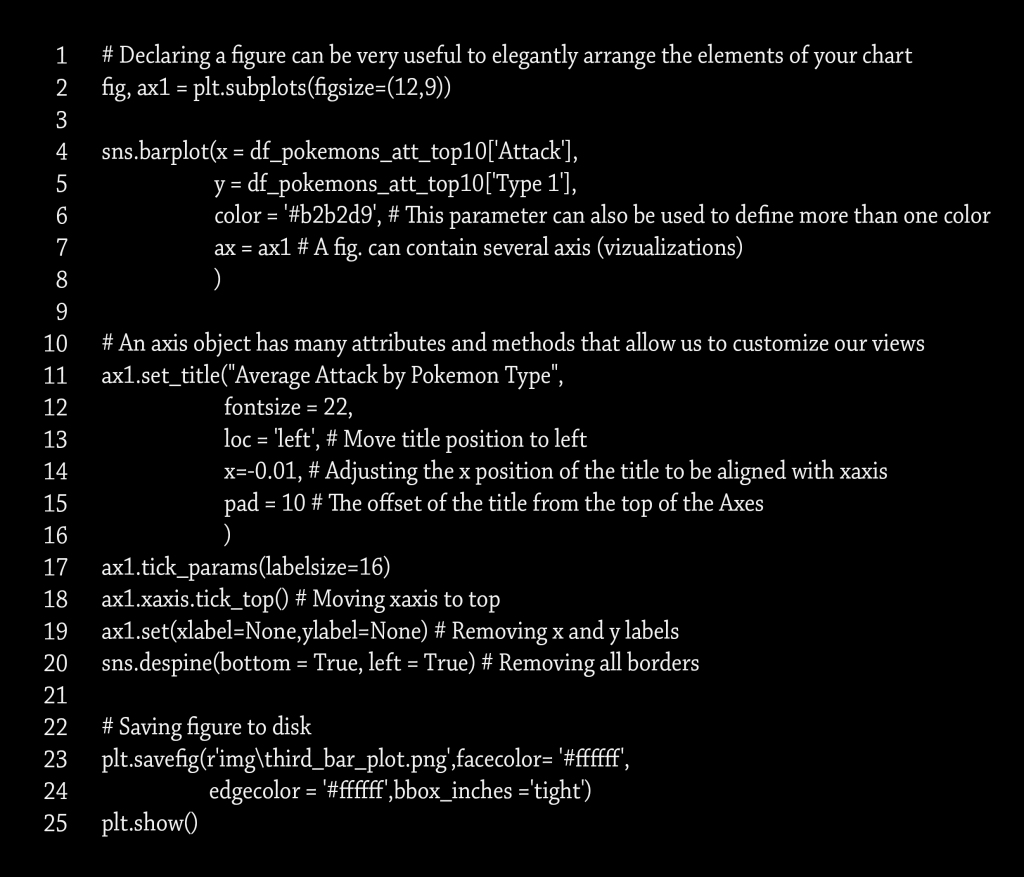


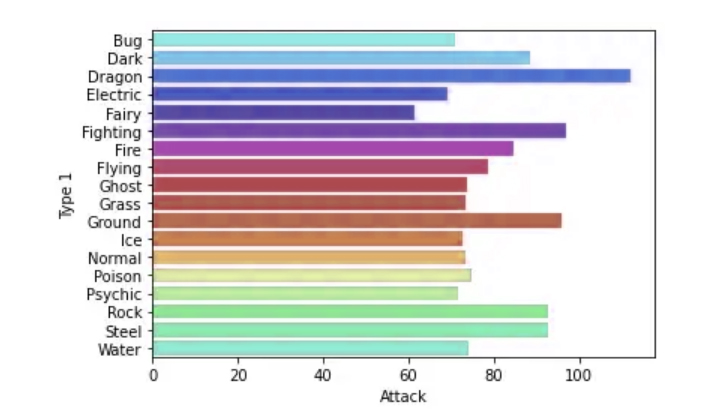


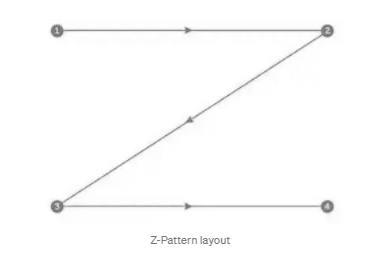

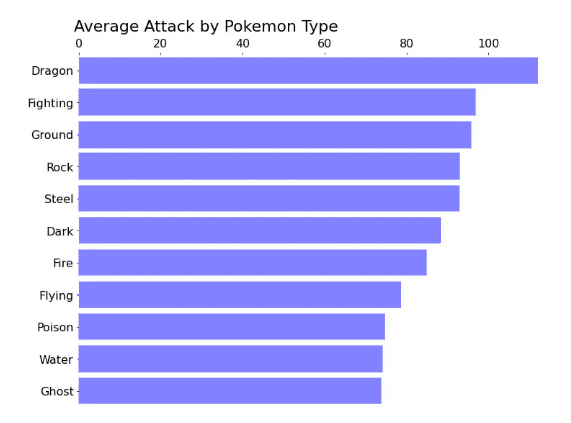


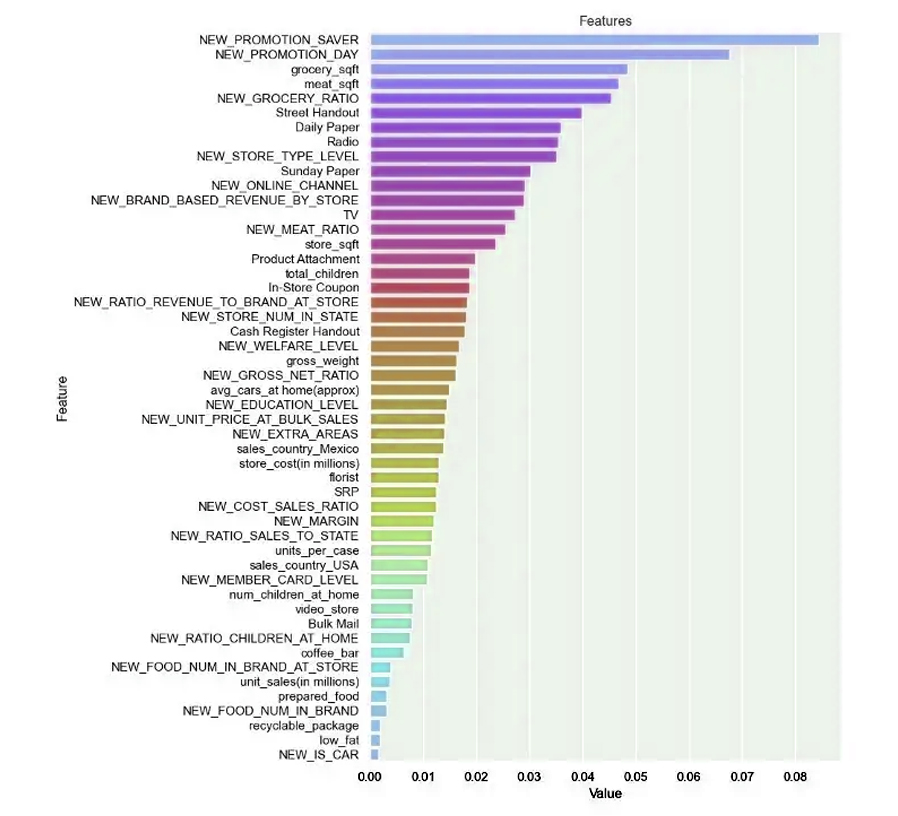


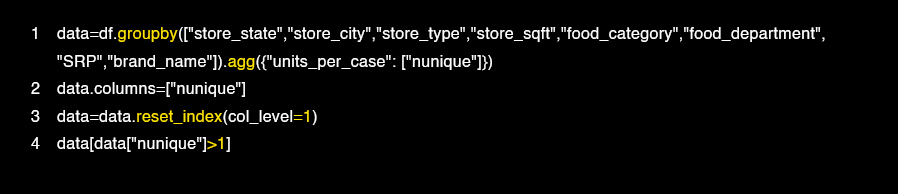
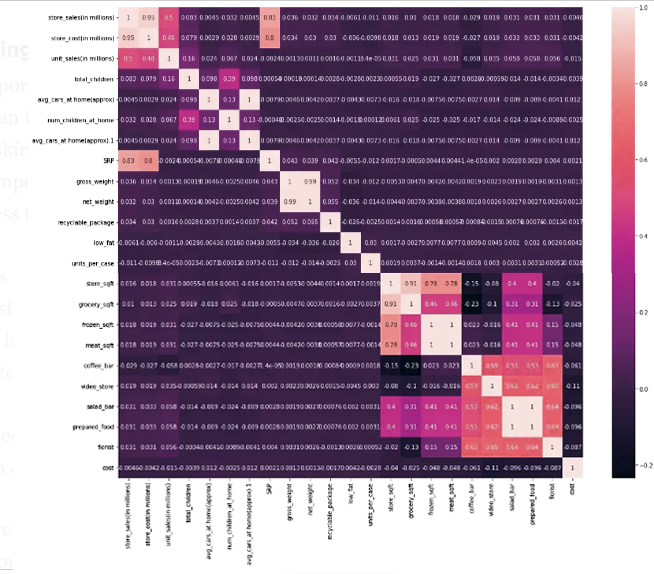

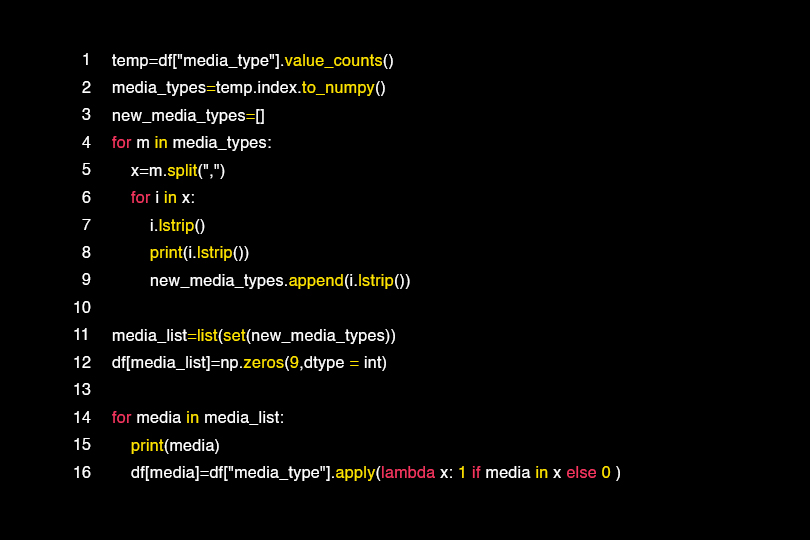
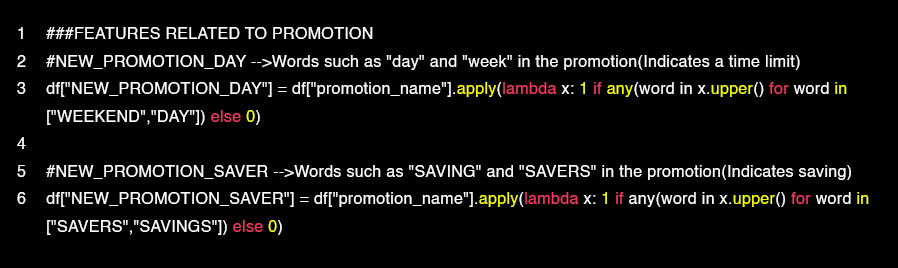
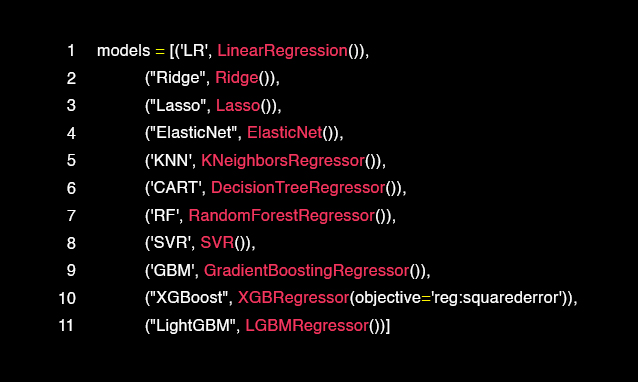


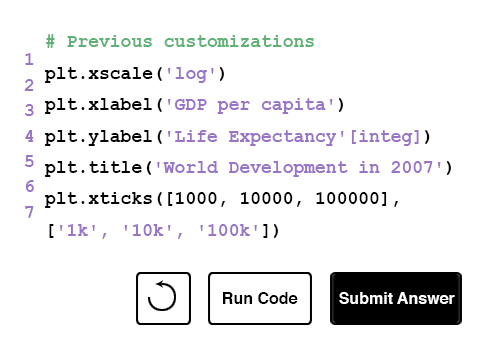
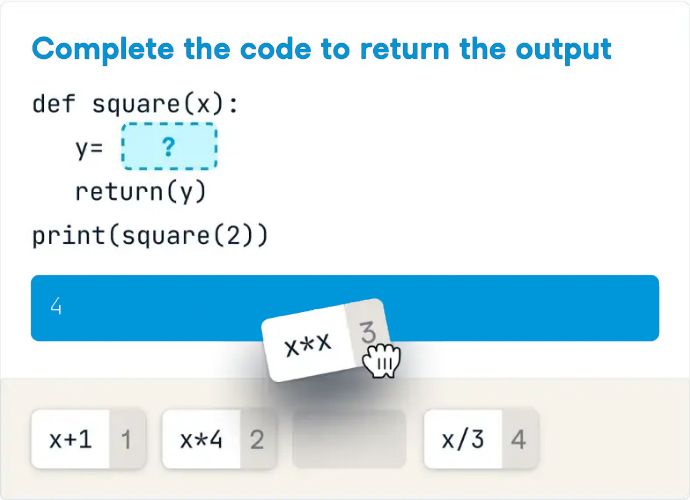


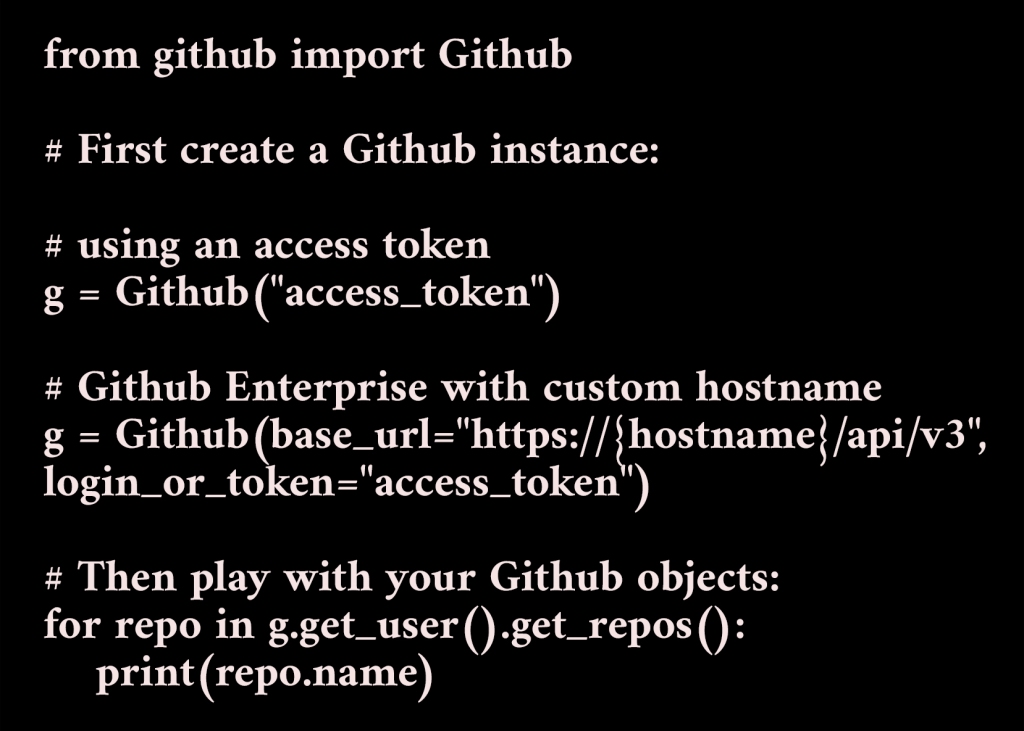


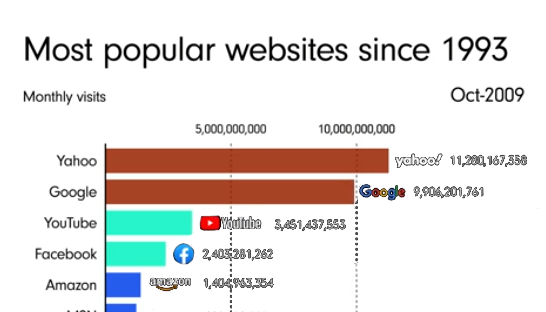


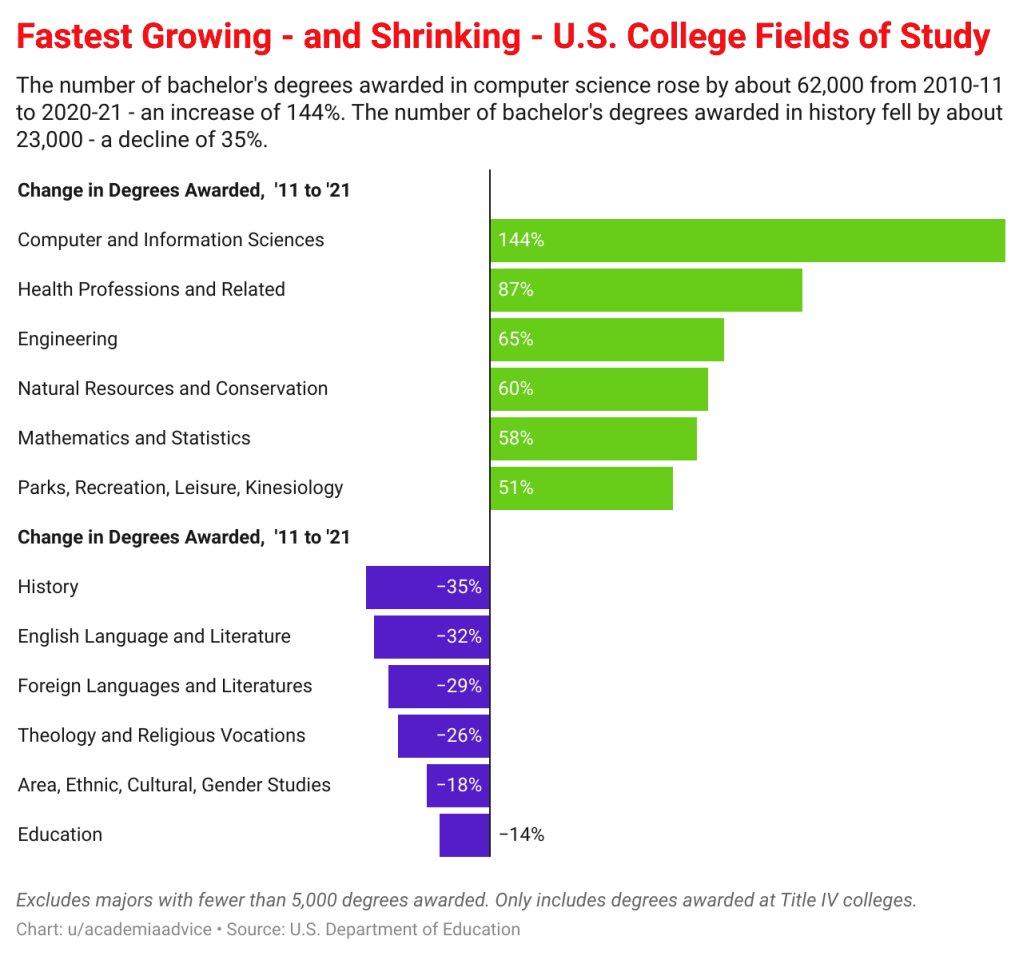

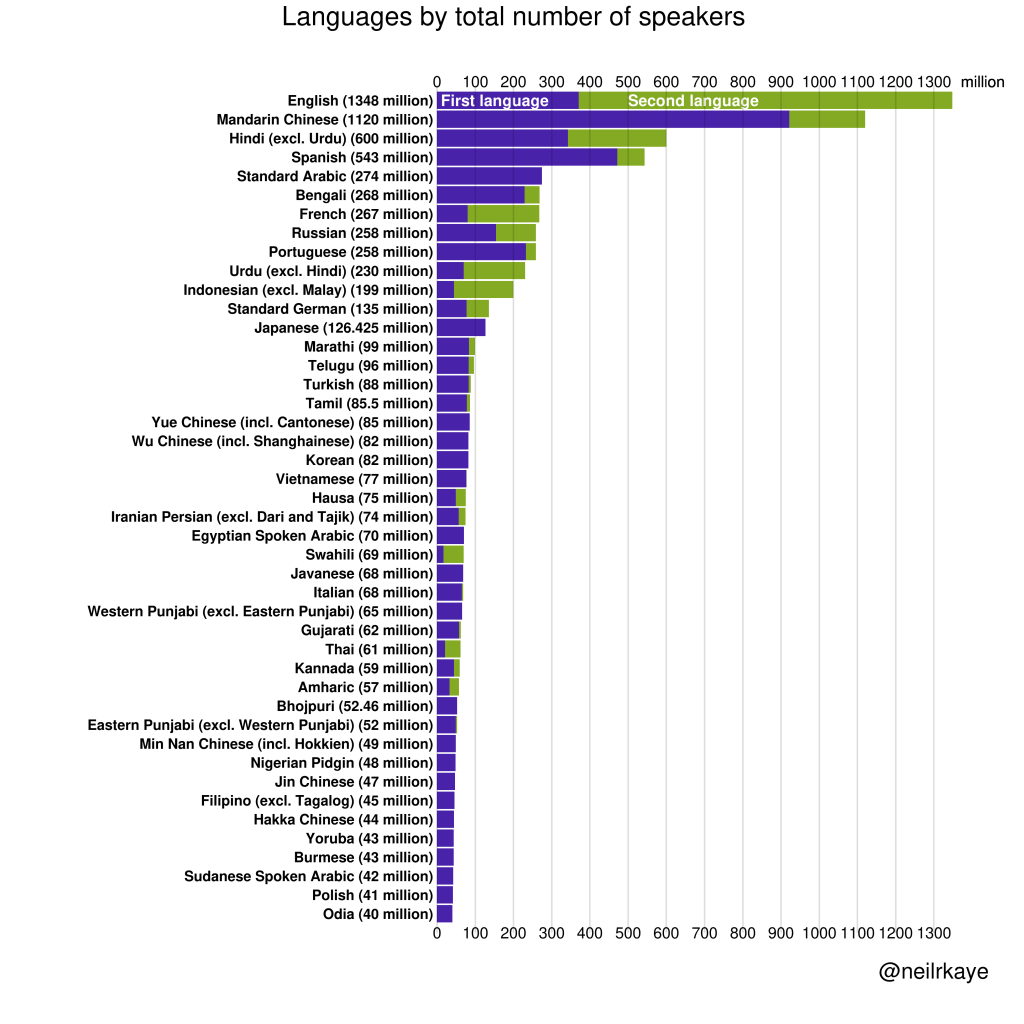


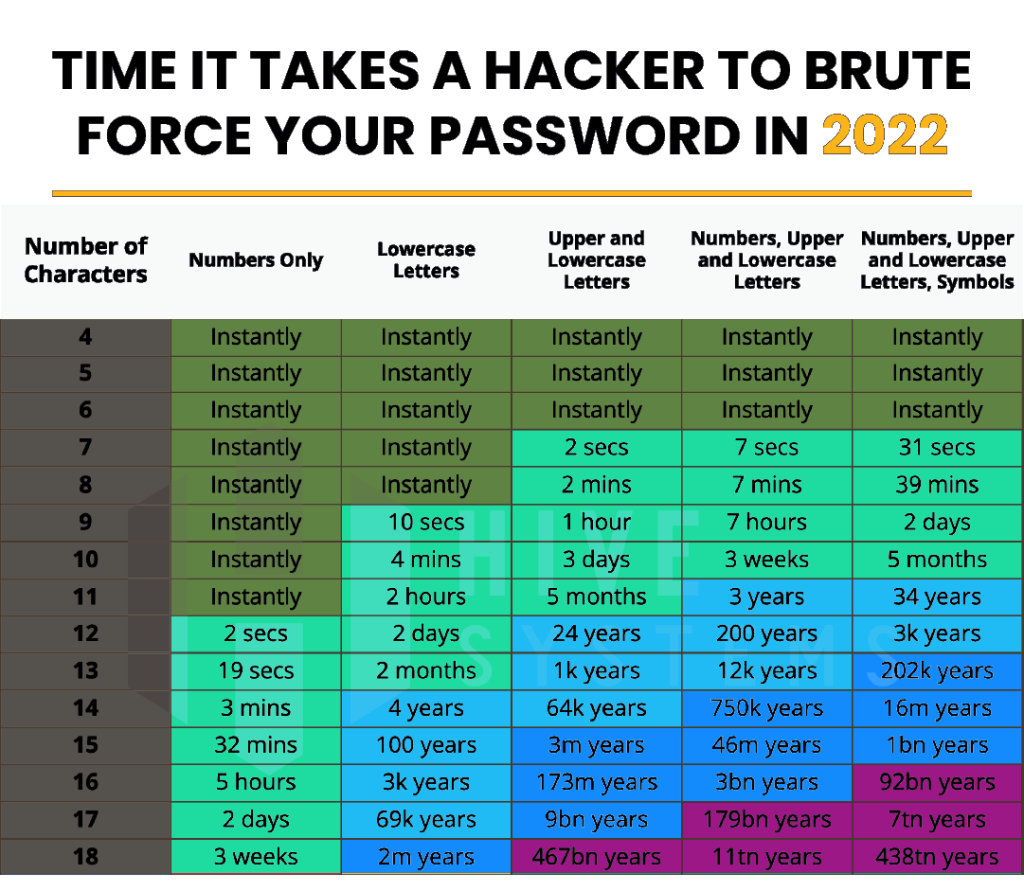
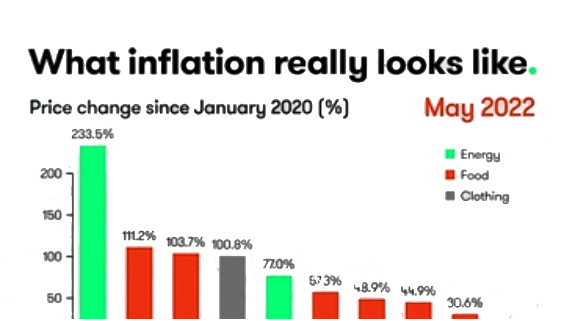
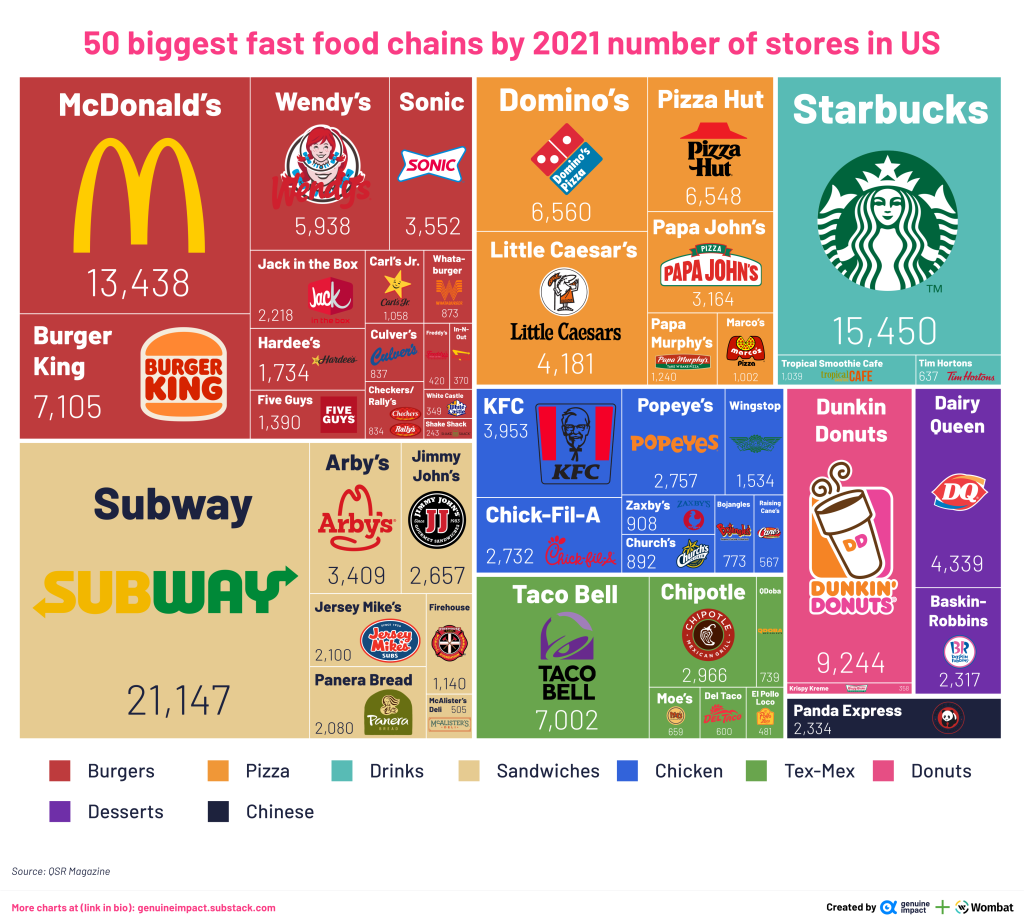
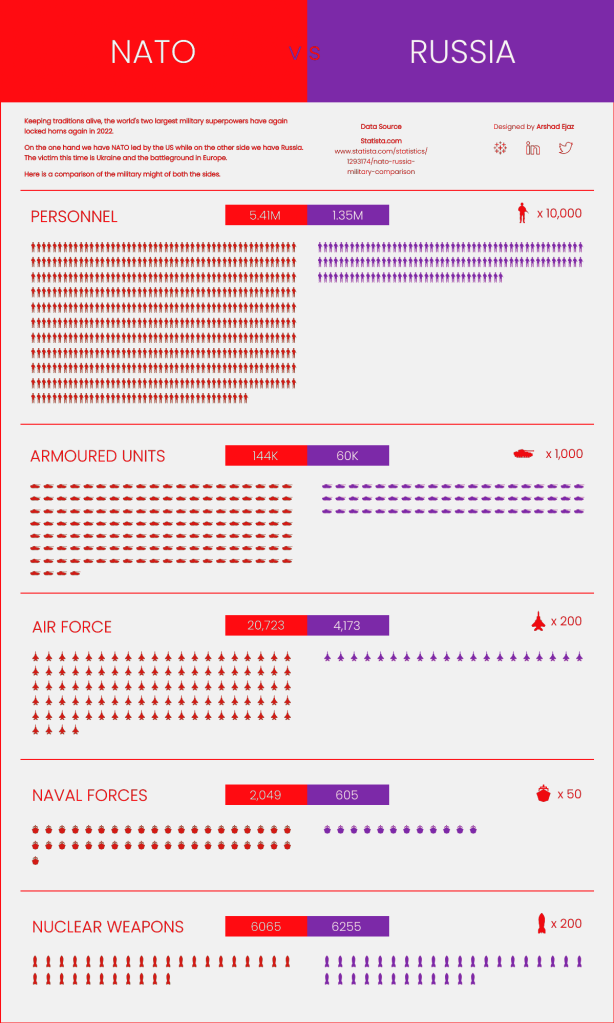

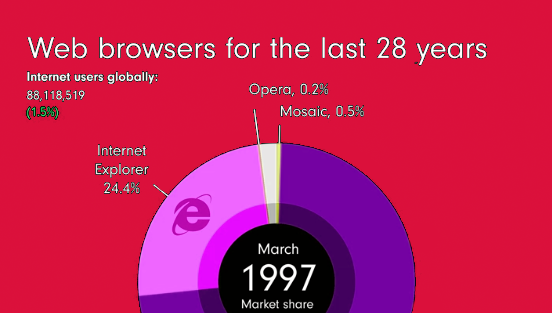

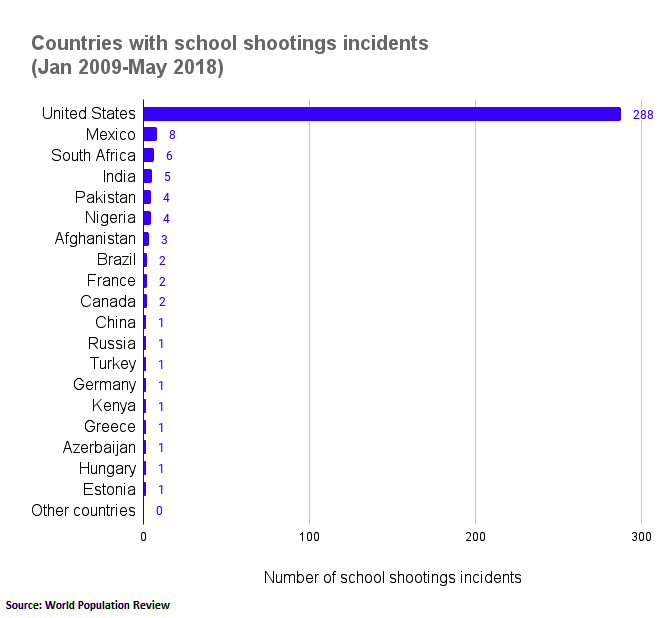
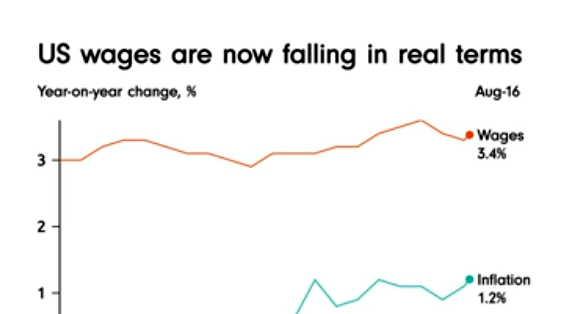


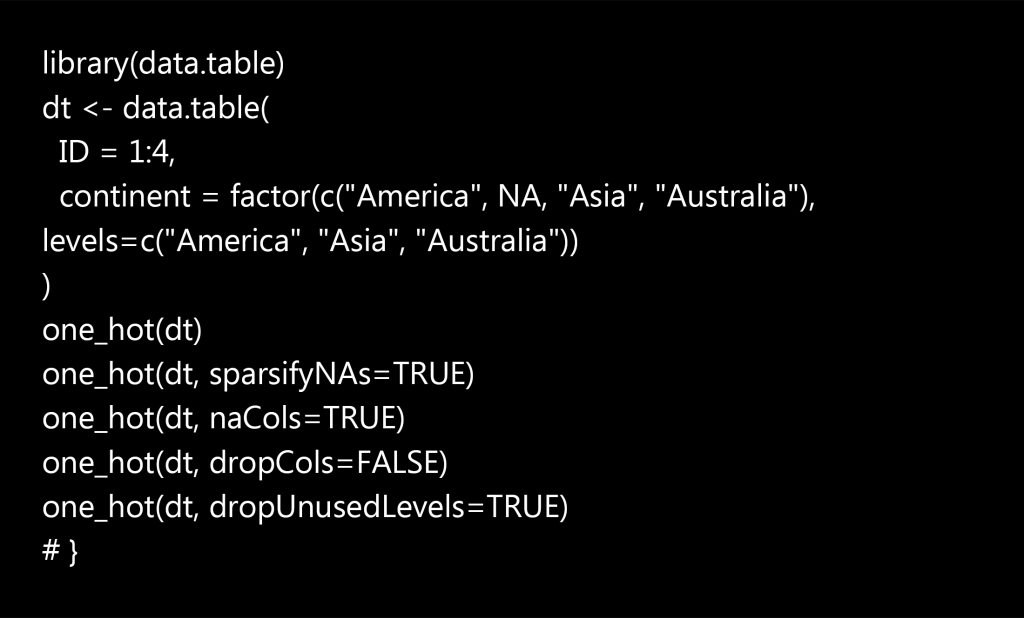


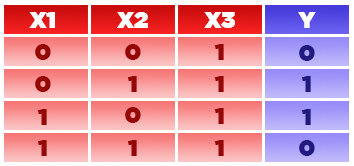

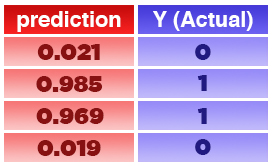


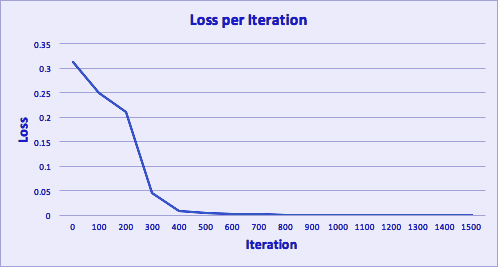


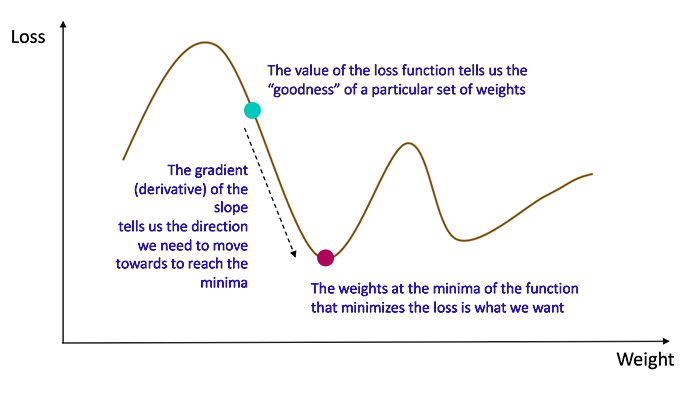
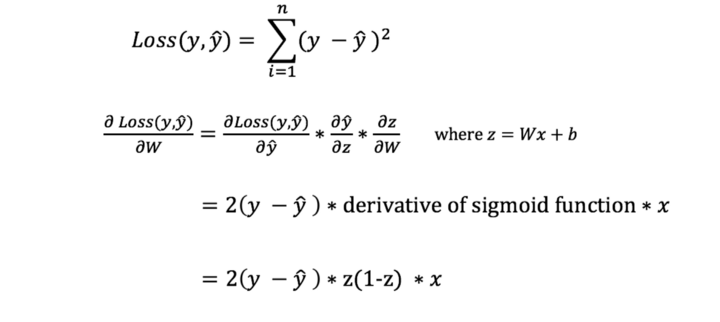
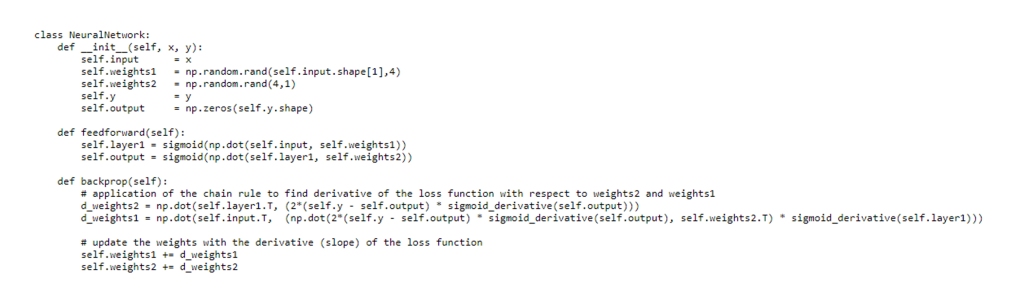

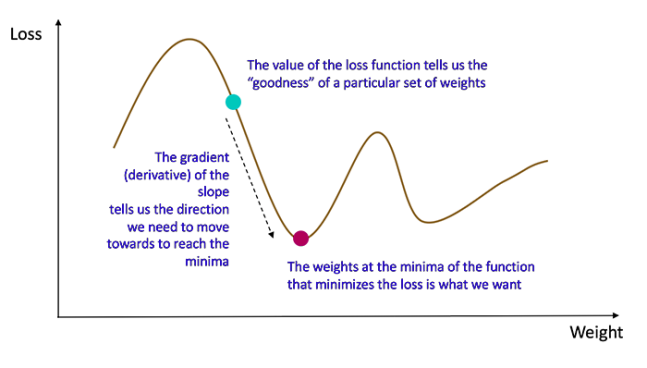


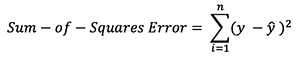


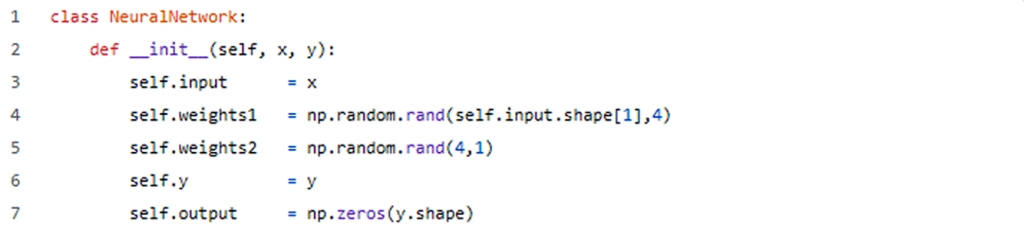


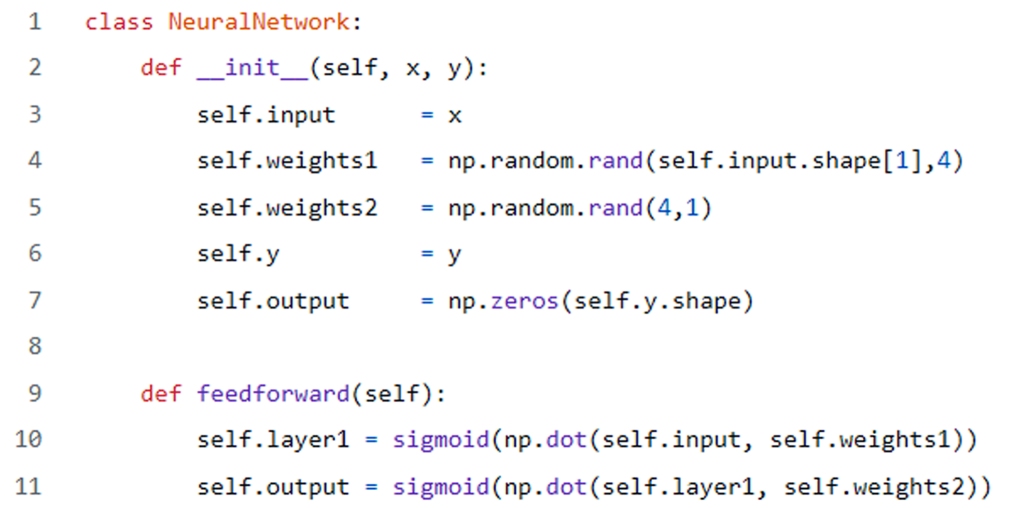

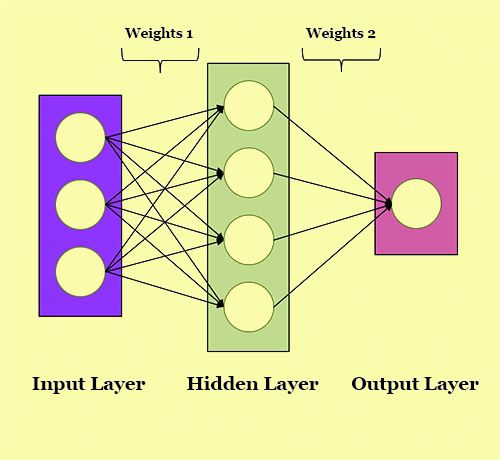


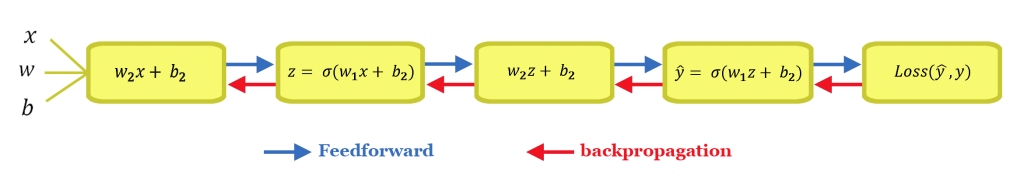


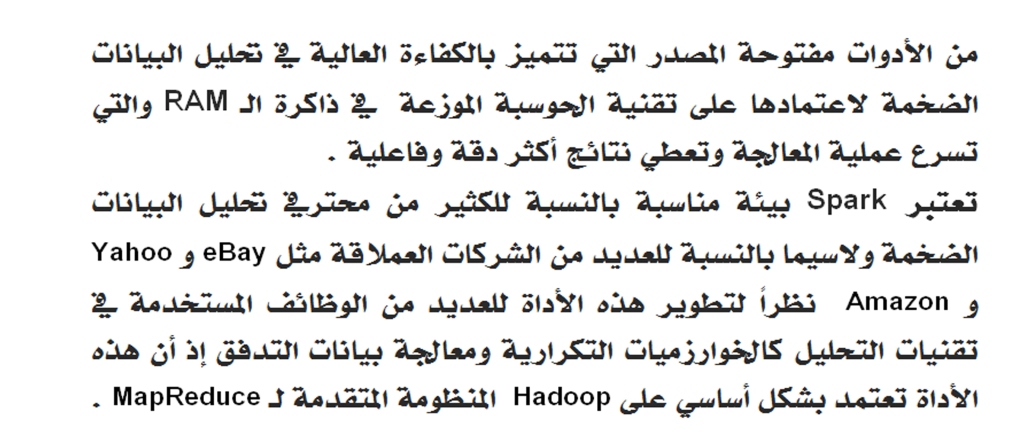


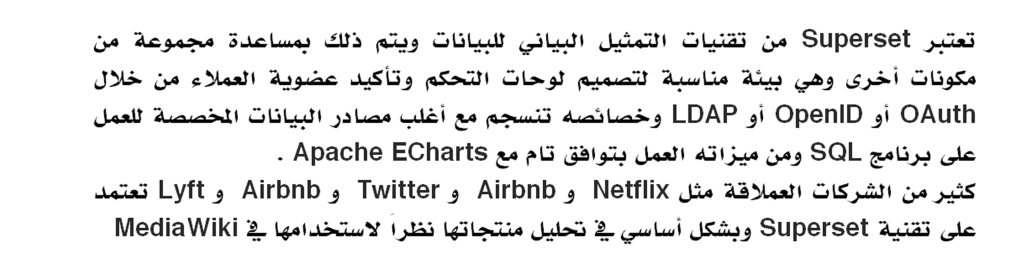


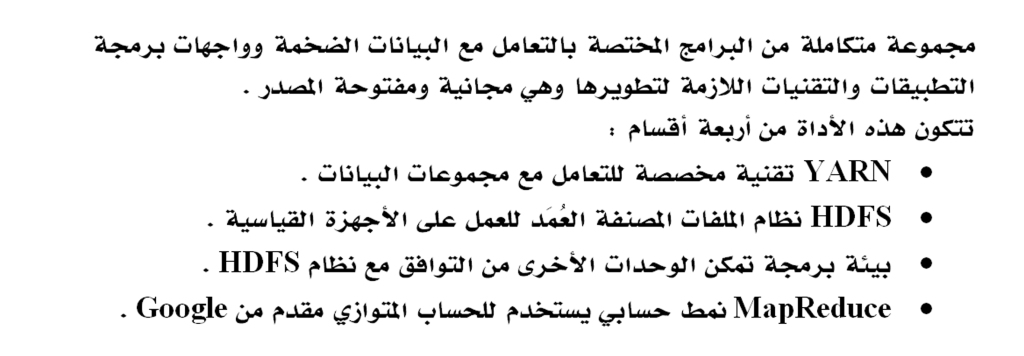


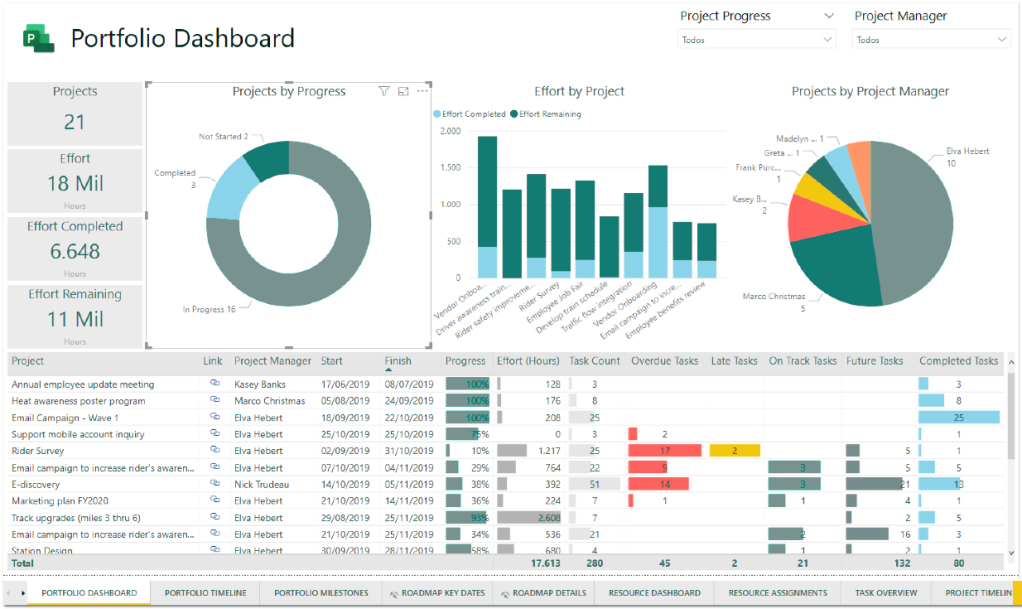
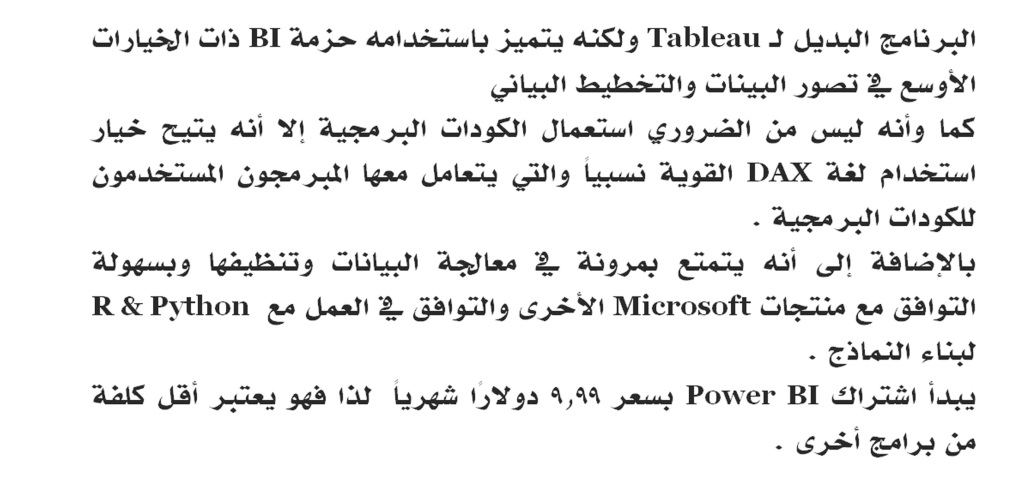


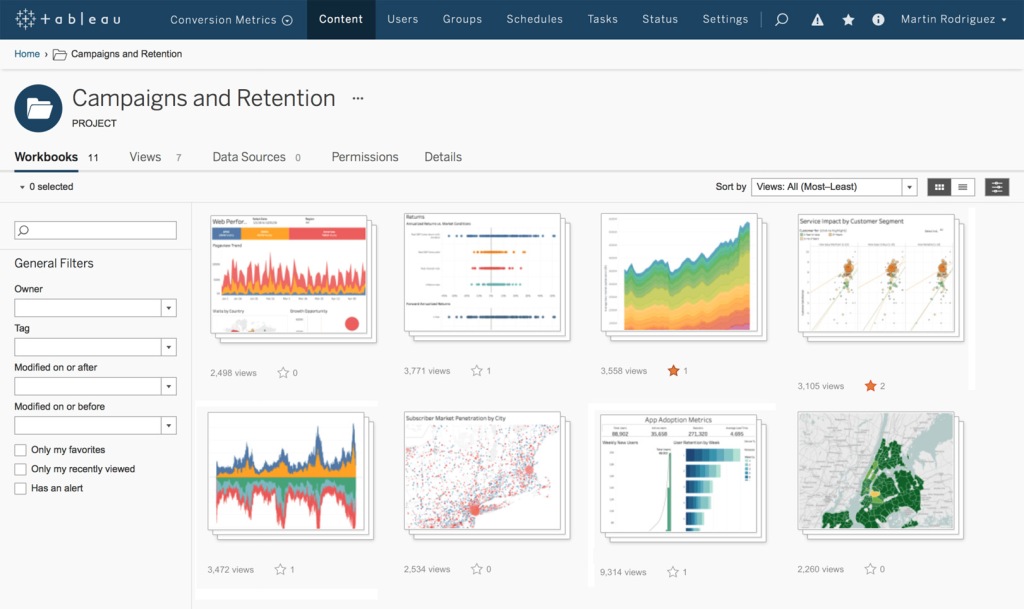


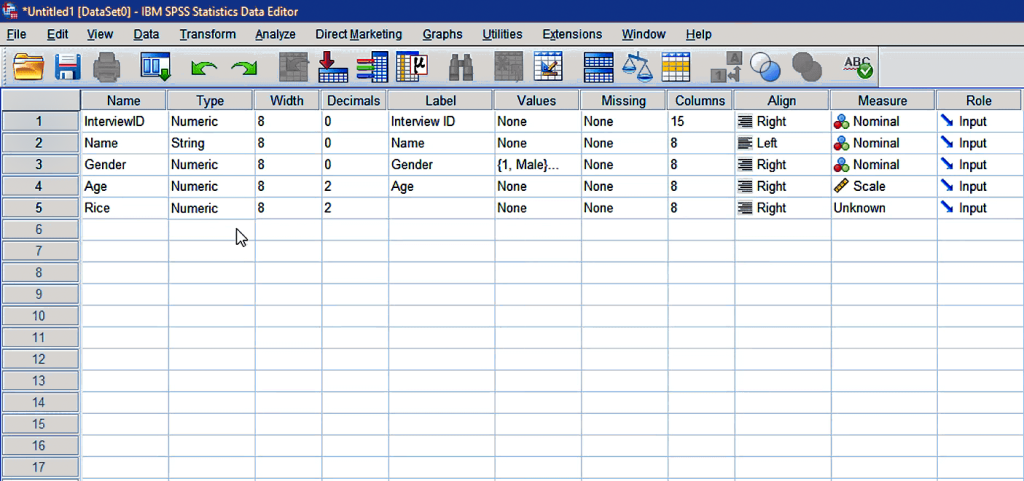


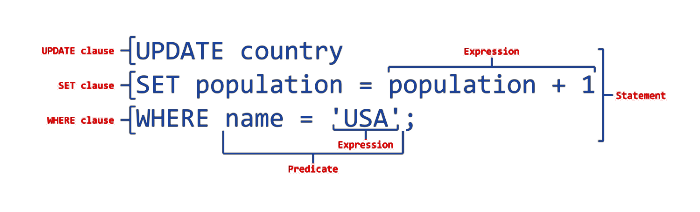


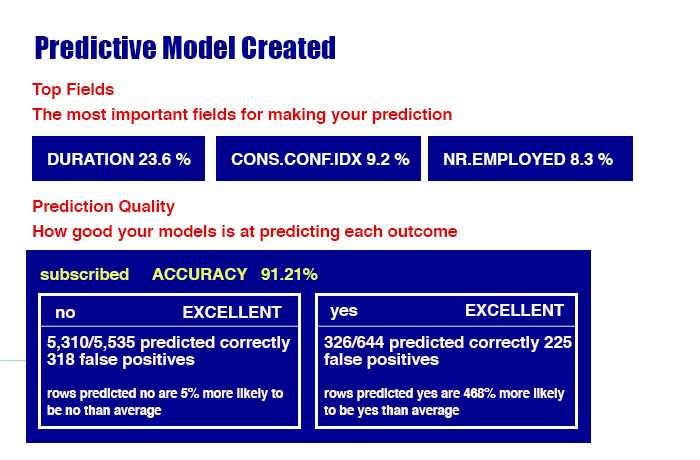


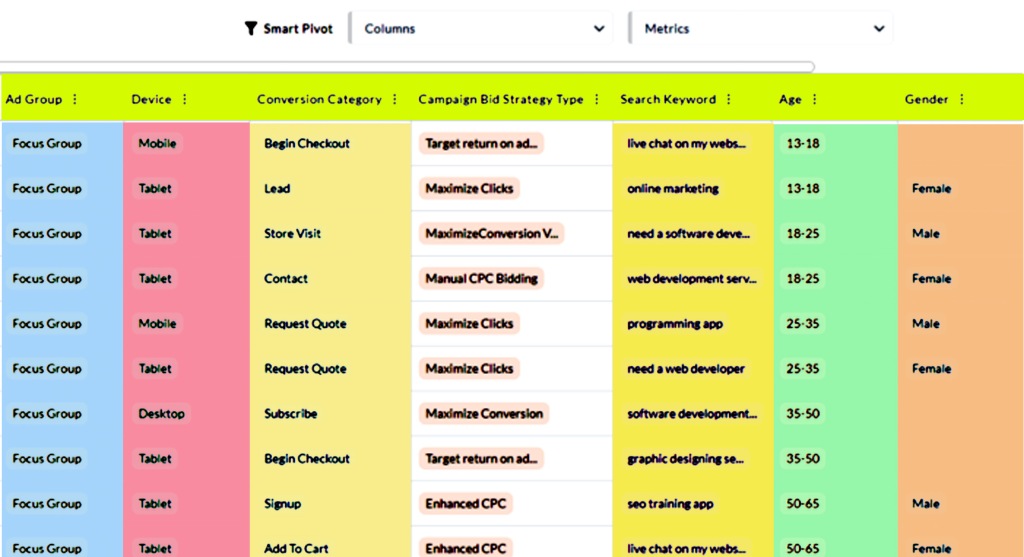


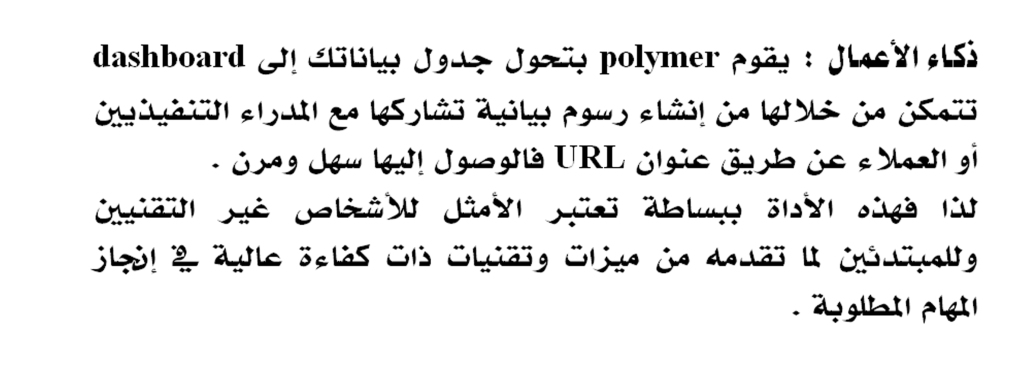


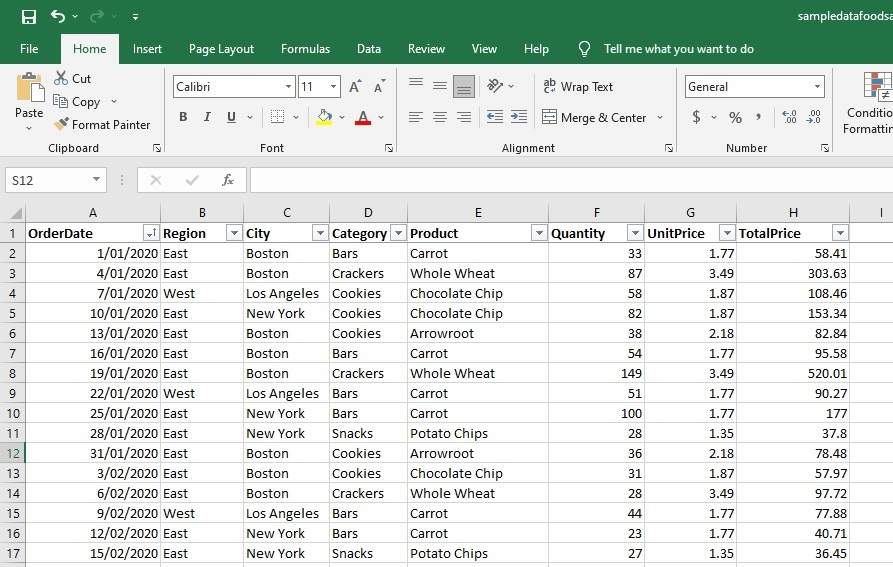


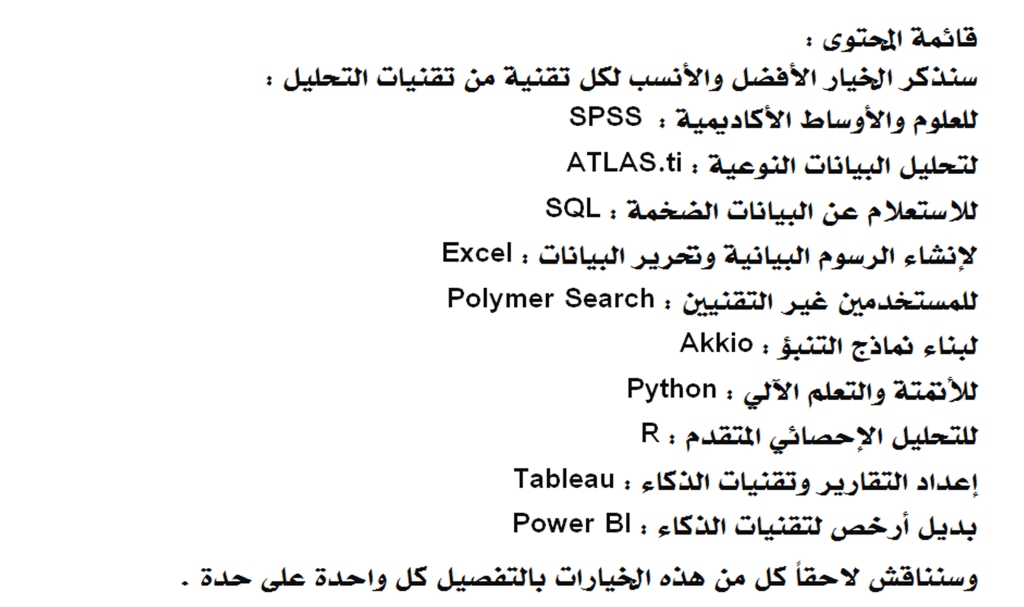


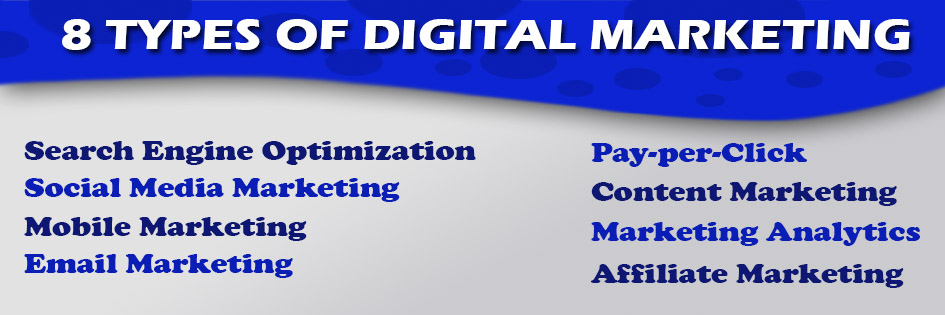


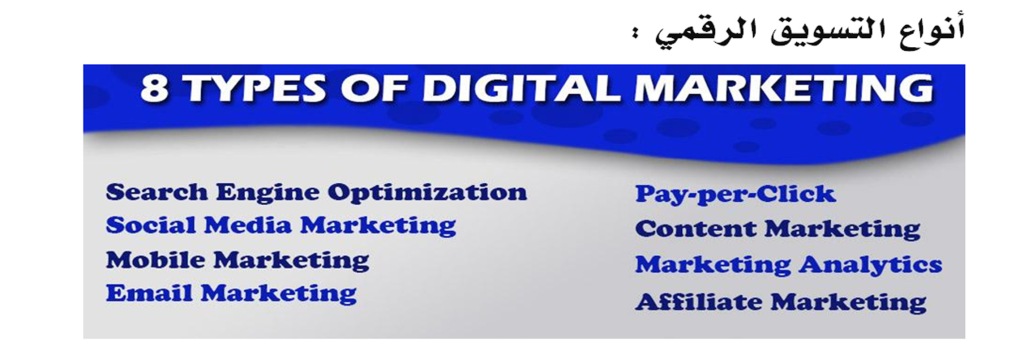
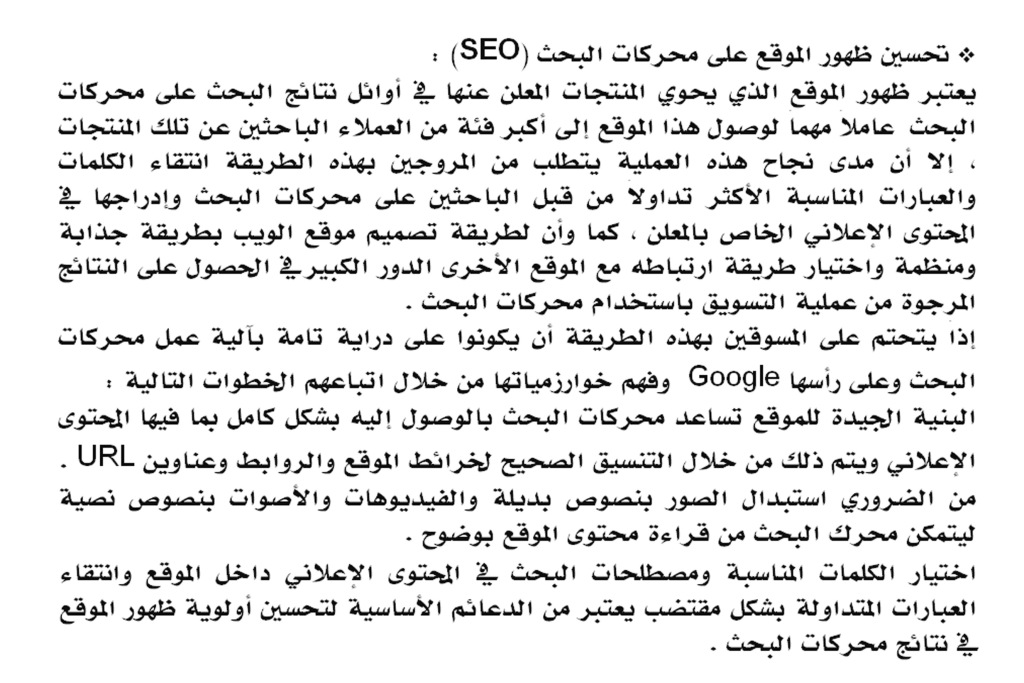


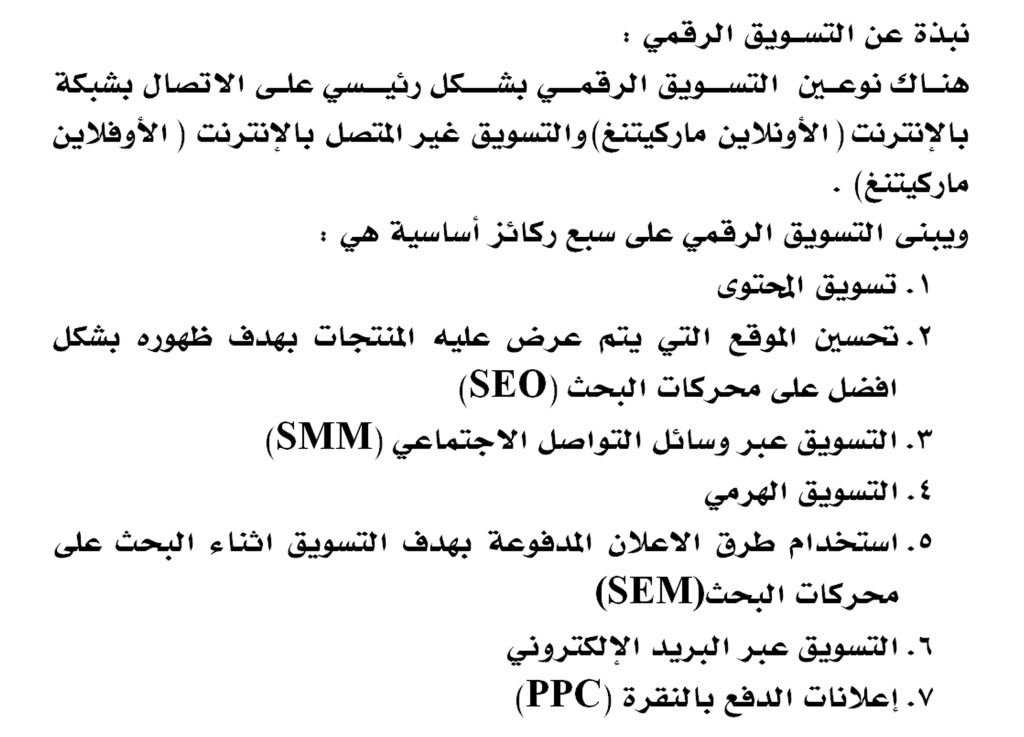


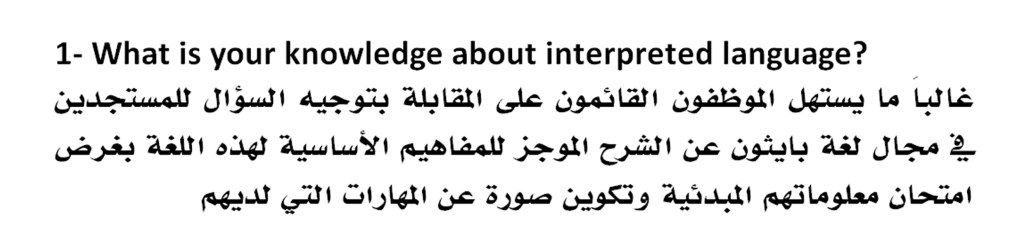


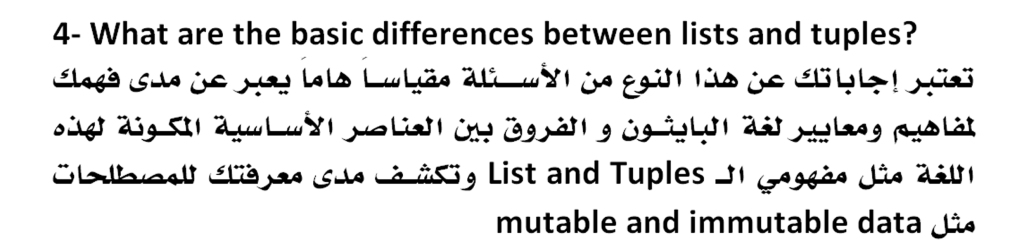


You must be logged in to post a comment.