
Here I will explain visualization by using python. The explanation will be on a real case but I will only introduce python codes with charts explanation.
What is the Dataset about?
We will work on the Breast Cancer Wisconsin (Diagnostic) Dataset. Here, Features are taken from the image of a fine needle aspirate (FNA) of a breast mass. They describe characteristics of the cell nuclei present in the image. You can find this dataset in Kaggle.
What are the Data Visualization steps on this Dataset?
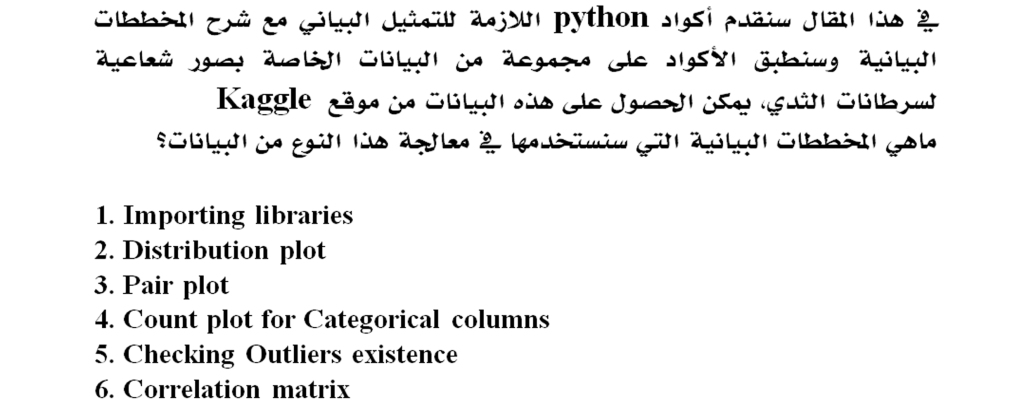
1. Importing libraries
2. Distribution plot
3. Pair plot
4. Count plot for Categorical columns
5. Checking Outliers existence
6. Correlation matrix
Matplotlib & Seaborn are the two main libraries in Python as well as other libraries such as: GGplot and Plotly
So let’s start with the first step:
1. Importing the required libraries:
import matplotlib.pyplot as plt
import seaborn as sns
2. Using Distribution plot for all columns:
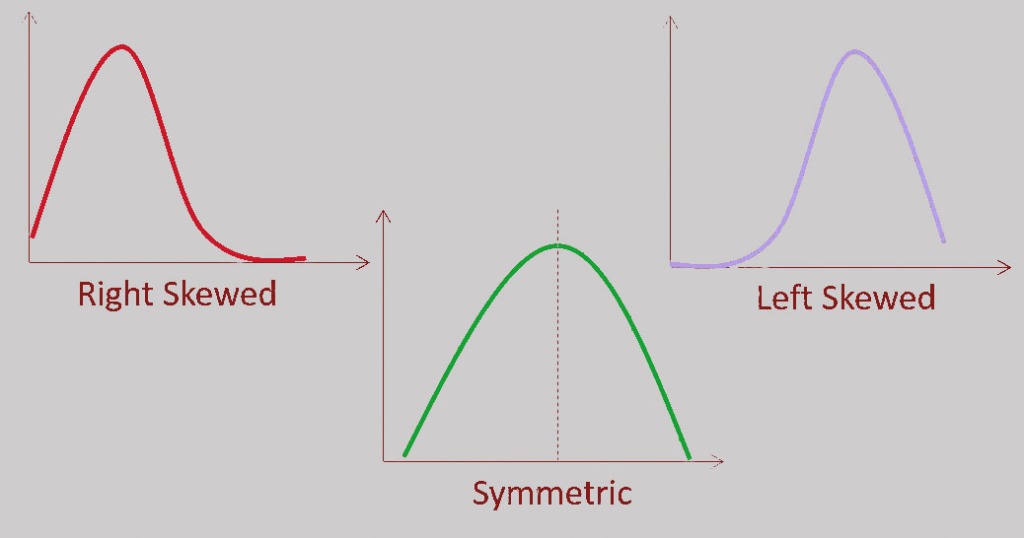
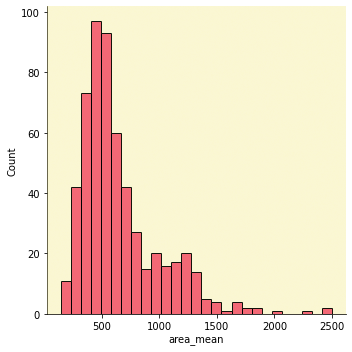
By creating distribution plots, we can know if the data is normally distributed or there is some skew in it, then we may need to make some transformations to get better results from the machine learning models.
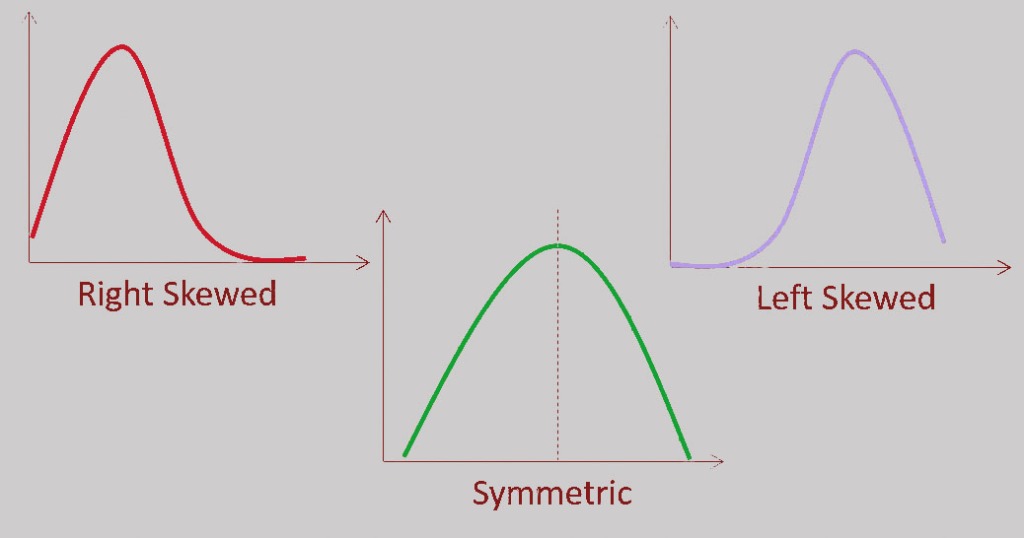

Here we will create the distribution plot for all columns in the dataset and I will display the distribution plot for the “area_mean” column
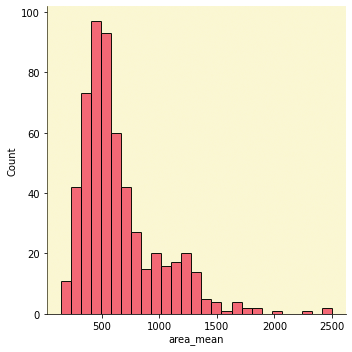
We clearly notice the right skewness for the “area_mean” column, like most of the columns in the data set. This method of analysis called Univariate Analysis, where we take one variable and analyze it, but when we take two variables at the same time and try to find a relationship between them, then it is called Multivariate Analysis.
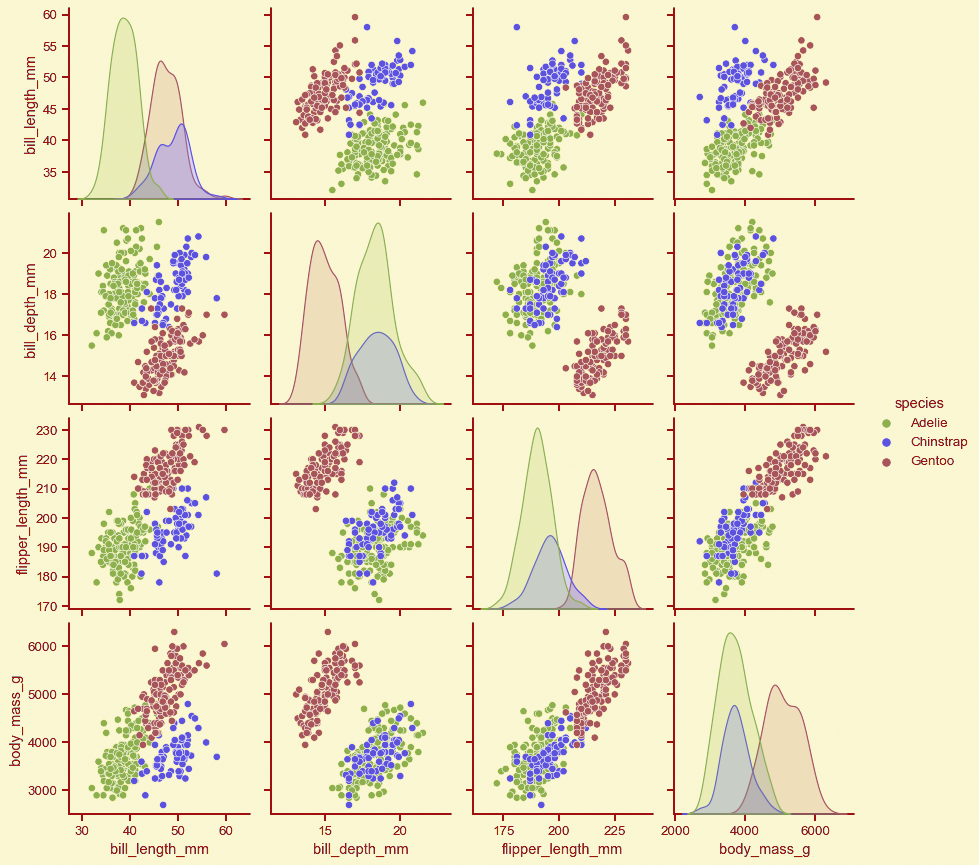
3-Pair plot:
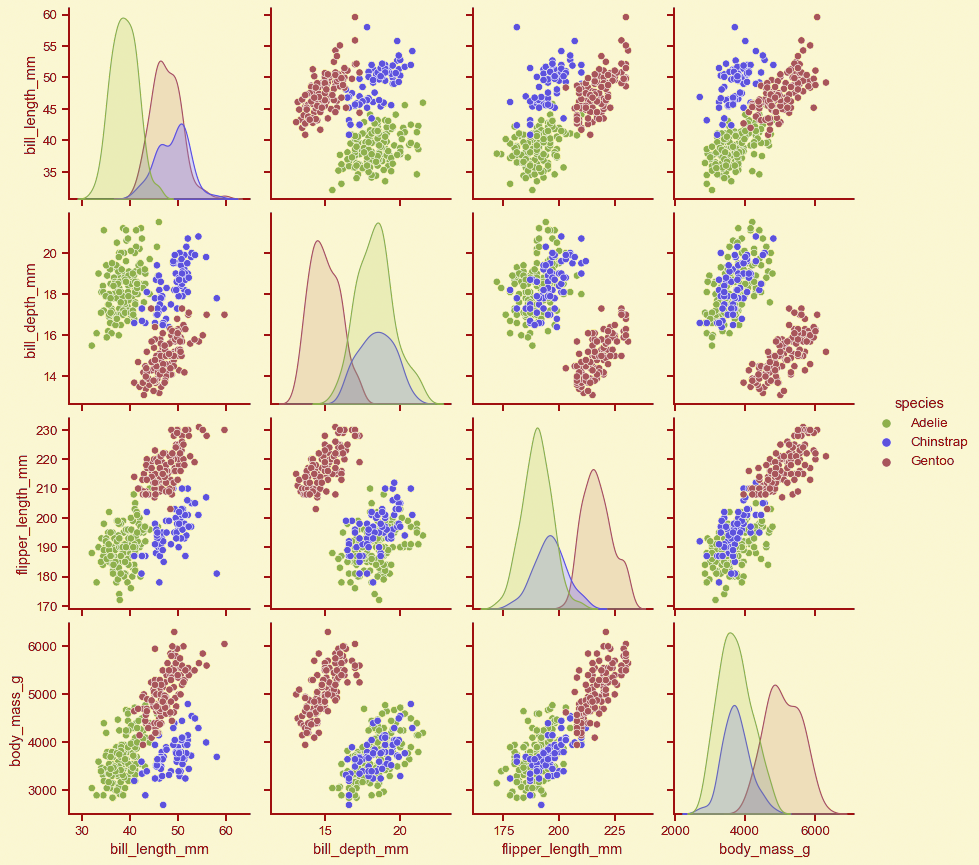
The main concept of the pair plot is to understand the relationship between the variables.
Its code is:

4- Count plot for Categorical columns:
When we have a categorical variable we will plot it in a count plot.
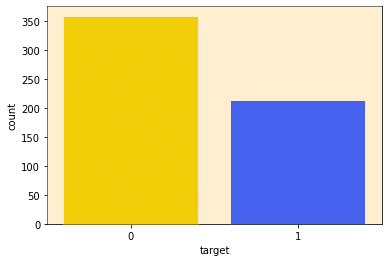
This dataset contains one categorical variable (“target”) with two classes:
0 (Benign) and 1 (Malignant)

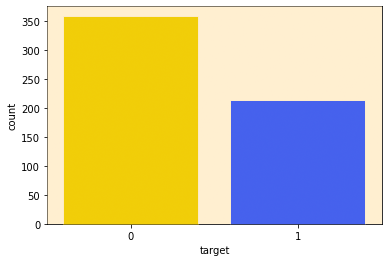
Count plot can show the total counts for each cateu. As we can see, the number of data points with a rating of ‘0’ is higher than that of ‘1’ which means that we have more Benign cases than Malignant cases in this dataset which is an indication about unbalanced Data.
5- Outliers:
Most ML algorithms such as Regression models, K-Nearest Neighbors, etc are sensitive to Outliers, but other models such as Random forest are not affected by Outliers.
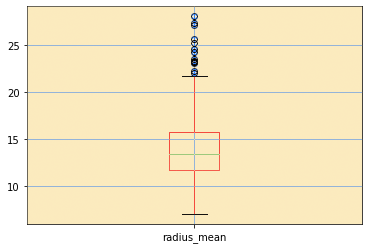
The plot that reveals the outliers is a BOX and Whisker plot:

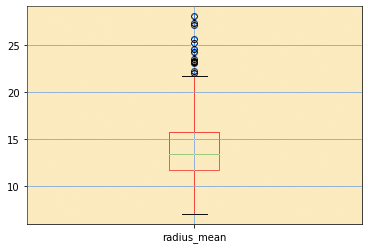
At the top of the plot in the loop we will create a box for all the columns in the data set which we will display to the “radius_mean” variable alone.
The circles at the top of the top whisker and below the bottom whisker represent the values of the Outliers
In our example, the Outliers values are in the top section only.
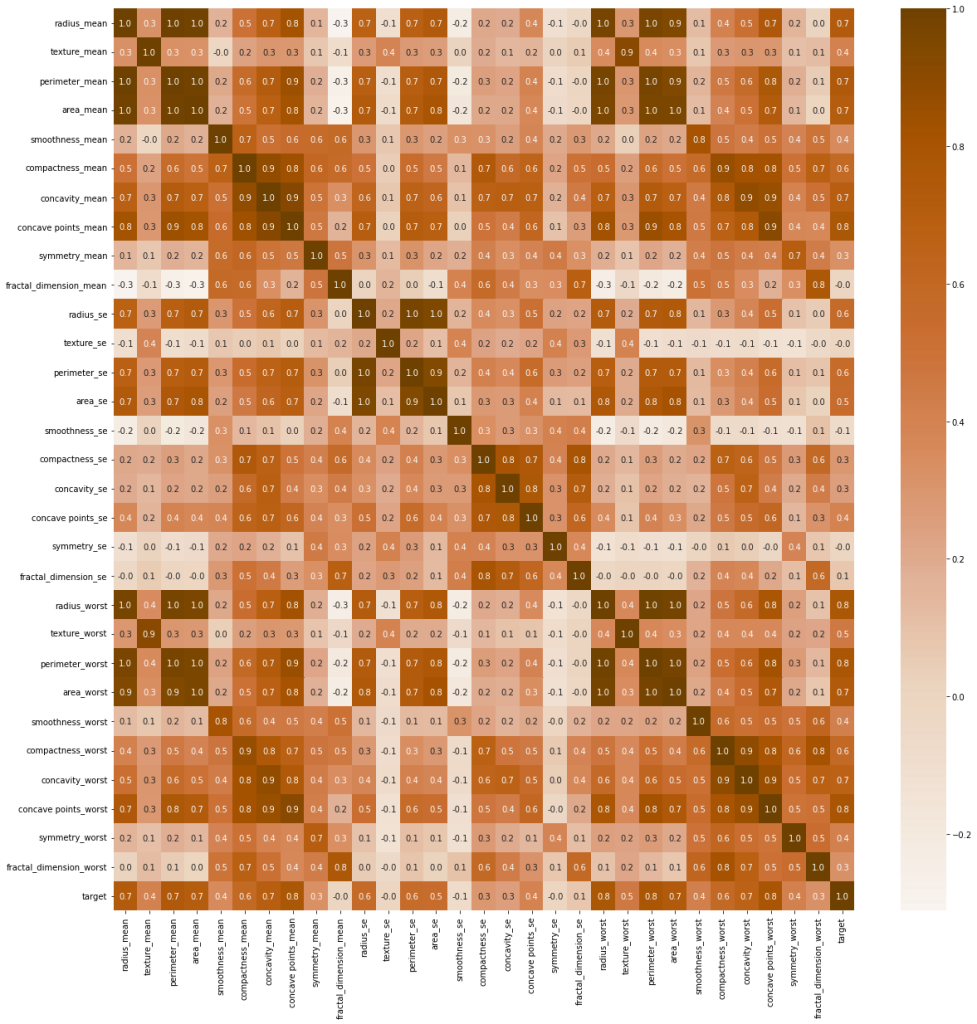
6- Correlation matrix:
Its purpose is to find out the correlation between the variables in the data set so that the useful features are selected and the unnecessary ones removed.

We will create a Heat Map to visualize the relationship between the variables :
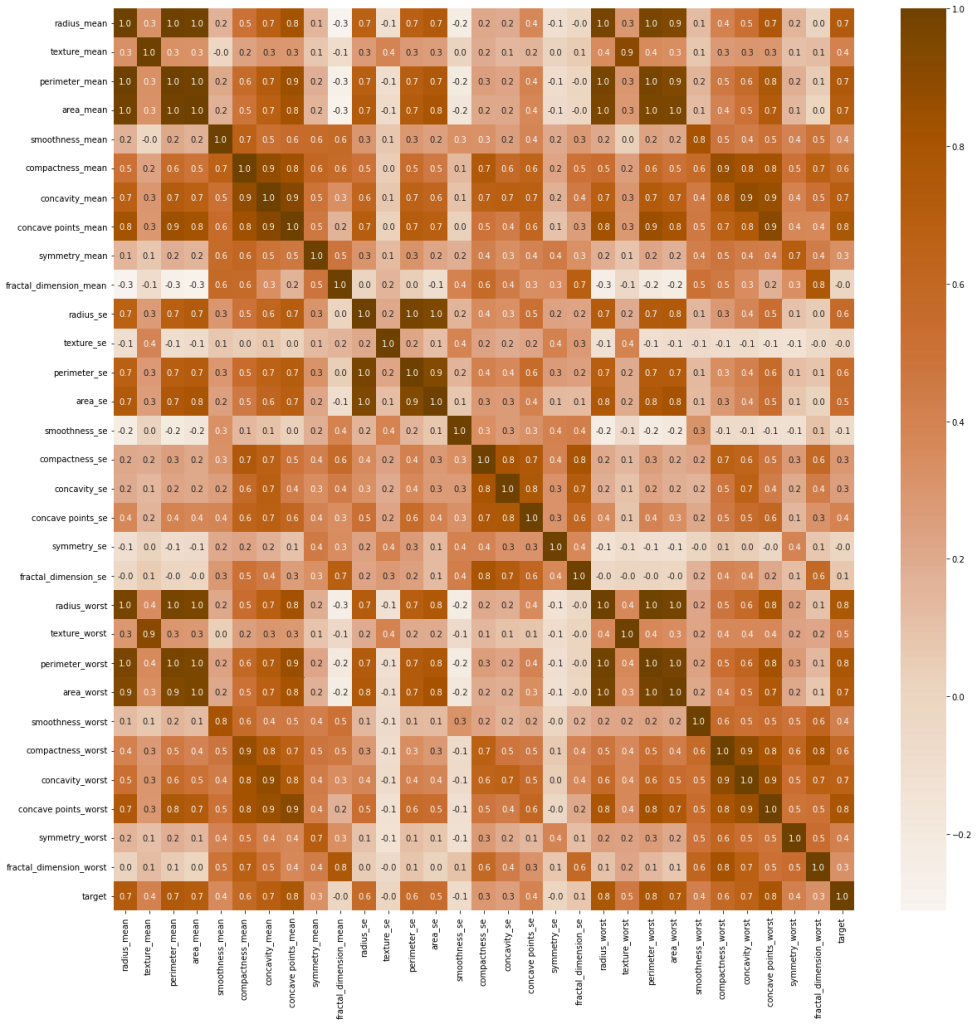
If the correlation between two variables is +1, the correlation is positive, and if the correlation is -1, it is negative
Determining the type of correlation between two variables helps in facing the problem of multiple linearity and assit us to take the decision in removing one of the features especially when we have two independent variables that are highly correlated.
Finally, These are the most popular plots that we can create for the dataset that we have. There are several other plots like Pie chart, Scatter plot, etc. We always decide the plots that we need to use depending on the dataset and the insights we are looking for as the conclusions that we derived from Data Visualization process will be helpful for models applications.

















You must be logged in to post a comment.