Collection of an Advanced SQL Technologies That is Indispensable For Every Data Scientist

Advertisements

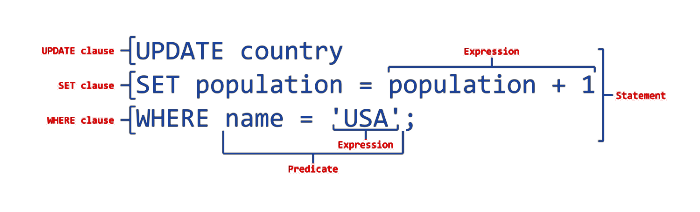
Structured Query Language (SQL) is the standard query language for relational databases. This language is simple and easy to understand, but moving to an advanced level in data analysis requires mastering the advanced techniques of this language.

And when we talk about the techniques that need to be learned to move to an advanced level, we are talking about a system of functions and features that allow you to perform complex tasks on data such as joining, aggregation, subqueries, window functions, and other functions that can deal with big data to obtain effective and accurate results.

Some vivid examples of using advanced SQL techniques

* Window functions

With this technique you can perform arithmetic operations across multiple rows related to the specified row

For example, if we have a table with the following columns:

order_id, customer_id, order_date and order_amount

It is required to calculate the current total sales for each individual customer sorted by order date

SUM can be used to perform this task

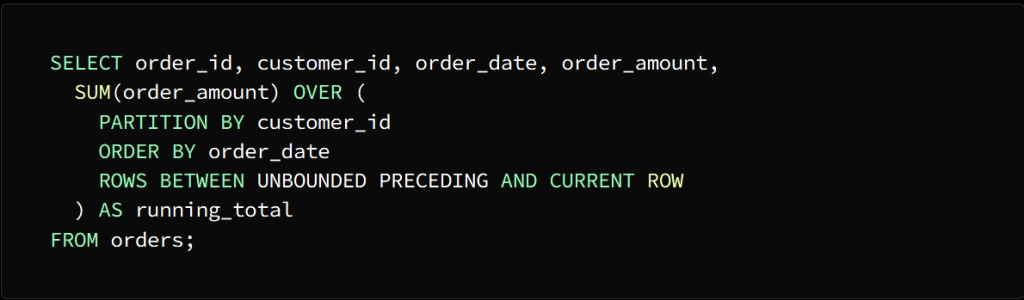
To calculate the current total for each individual customer, the SUM function must be applied to the order_amount column and divided by the customer_id column.

ORDER BY indicates that the rows are ordered according to the order dates in each section

Phrase:

ROWS BETWEEN UNBOUNDED PRECEDING AND CURRENT ROW

Indicates that the calculation is within the window between the rows at the beginning of the section up to the current row

The result of the query will come in the form of a table consisting of the same columns as the orders table, in addition to a column called run_total, which indicates the current total sales for each customer, and as we mentioned, arranged according to the dates of orders

* Common Table Phrases (CTEs)

CTEs allow you to get a set of results that can be used in SQL statements at a later time

For example: We have a table, let’s call it the Employees table, composed of the following columns:

employee_id, employee_name, department_id and salary

What is required is to calculate the average salary for each department, then search for employees with a higher salary than the average salary of the department to which they belong.

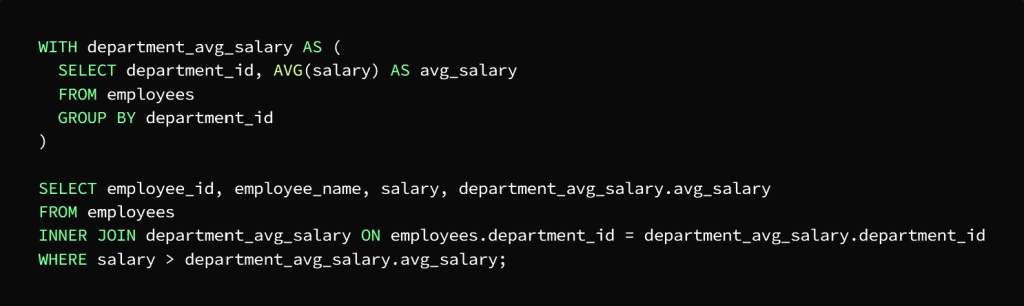
CTE can be used to perform two queries, the first to calculate the average salary of each department and the second to search for employees with higher salaries than the average salary of the department

We note here that the task has been divided into two phases to facilitate the query

The first stage is the salary calculation for each department

The second stage is to find the employees whose salary is higher than the average salary of the department to which they belong

In the first query, CTE, called department_avg_salary, which is assigned to calculate the salary for each department, using the AVG function and the GROUP BY statement, which sorts the employees according to the department to which they belong.

As for the second query, CTE, called department_avg_salary, it is used as if it were a table, then it is joined to the employees table in the department_id column, and then the result is extracted by WHERE to finally get the employees with the highest salary from the average salary of the department they belong to.

* Aggregate functions

Aggregate functions can be defined briefly as functions whose task is to perform an arithmetic operation on a group of values to derive a result in the form of a single value, such as performing arithmetic operations in a table on several rows or columns in order to obtain a useful data summary.

In fact, the use of aggregate functions is a real advantage in the SQL language, as it makes queries in it more easy and accurate.

The functions SUM, AVG, MIN, MAX, and COUNT are the most used in SQL

To be clear: we have a sales table composed of the following columns

sale_id, product_id, sale_date, sale_amount, and region

It is required to calculate the total sales and the average sales for each product separately, and then determine the best-selling product in each region

This is done by following the following steps

We have to sort the sales by product and region, calculate the total and average sales, then discover the best-selling product in the region by using aggregate functions

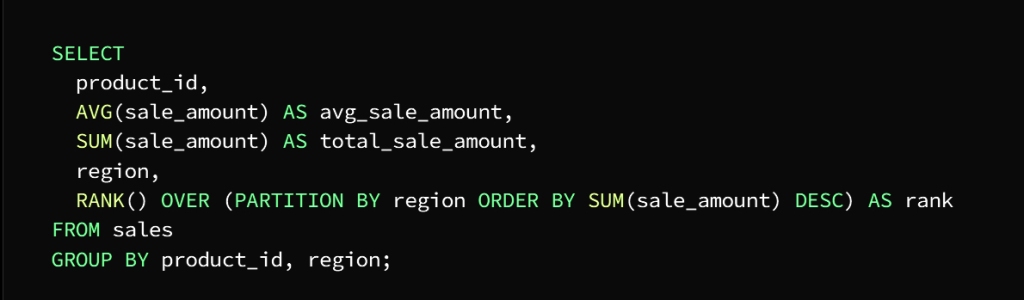
In this example, we use three aggregate functions AVG, SUM, and RANK

We will explain the task of each of them separately

AVG function calculates the average value of the product and the region

SUM function calculates the total value of each product and region using the GROUP BY statement

RANK function finds and explores the best-selling product in each region

To specify sorting by region, the OVER clause takes over this task

And to specify the column to divide the data (area) we use the PARTITION BY statement

As for getting the descending order of the sum of the value of each product in each region specified by the ORDER BY statement

The result of the query on a column shell is:

product_id, region, total_sale_amount, avg_sale_amount, and rank

So that the ranking column indicates the classification of each product in each region according to the total value of sale, so that the best-selling product in each region ranks first.

The uses of aggregate functions vary according to the tasks assigned to them. For example, you can calculate records, calculate maximum values, and other tasks.
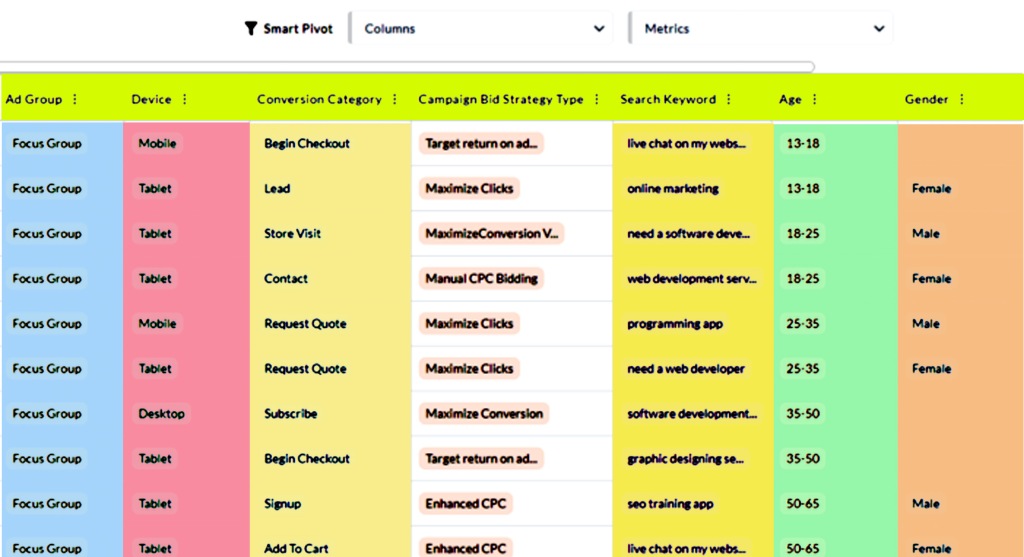
Advertisements

* Pivot tables

They are tables that contain data extracted from large tables in order to analyze it easier, as it allows converting data from rows to columns to display the data in a more coordinated manner.

These tables are built using the PIVOT operator, whose task is to sort the data according to a specific column, and then show the results in the form of a formatted table.

To clarify

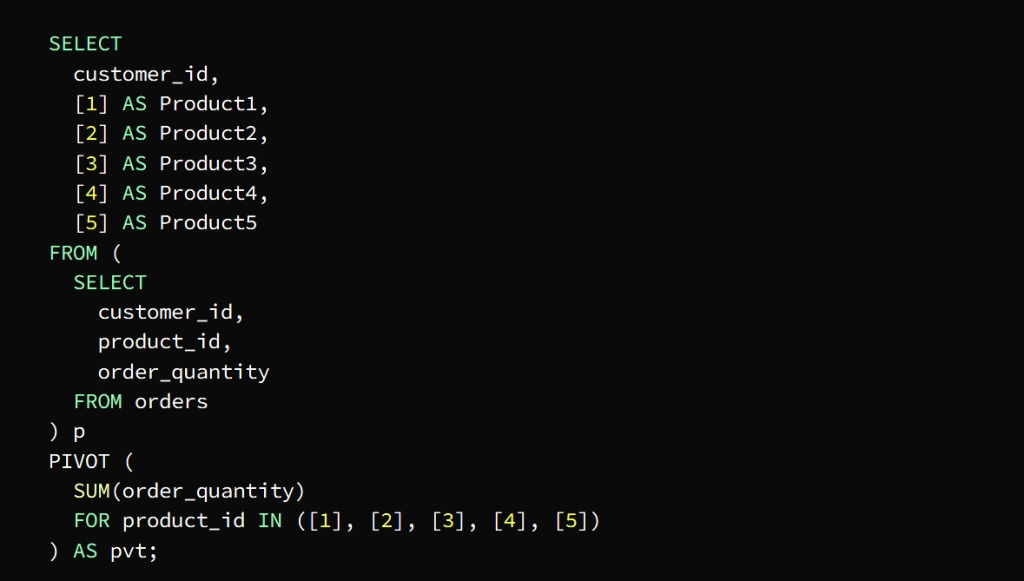
The PIVOT operator in the previous image is used to define the data axis by product_id plus columns per product and rows per customer

The SUM function calculates the total quantity of each product required by each customer

The p subquery extracts the necessary columns from the orders table

Then the PIVOT is run on the subquery in conjunction with the SUM function to find out the total quantity of each product ordered by each customer

The FOR statement is tasked with specifying the pivot column product_id in our example

The IN statement specifies target values ( [1], [2], [3], [4], [5] )

The pivot table appears as a result of a query for the total quantity ordered by each customer in the form of columns for each product and rows for each customer

* Subqueries

They are nested queries whose task is to retrieve data from one or more tables, and its results are used in the main query, and its function can be to sort and group data into one row or group of rows.

Subqueries such as SELECT, FROM, WHERE, HAVING are used within brackets in various places of the SQL statement.

To be clear: we have two tables

The first table is the employees table consisting of the following columns

employee_id, first_name, last_name, department_id

The second table is the payroll table and consists of the following columns

employee_id, salary, salary_date

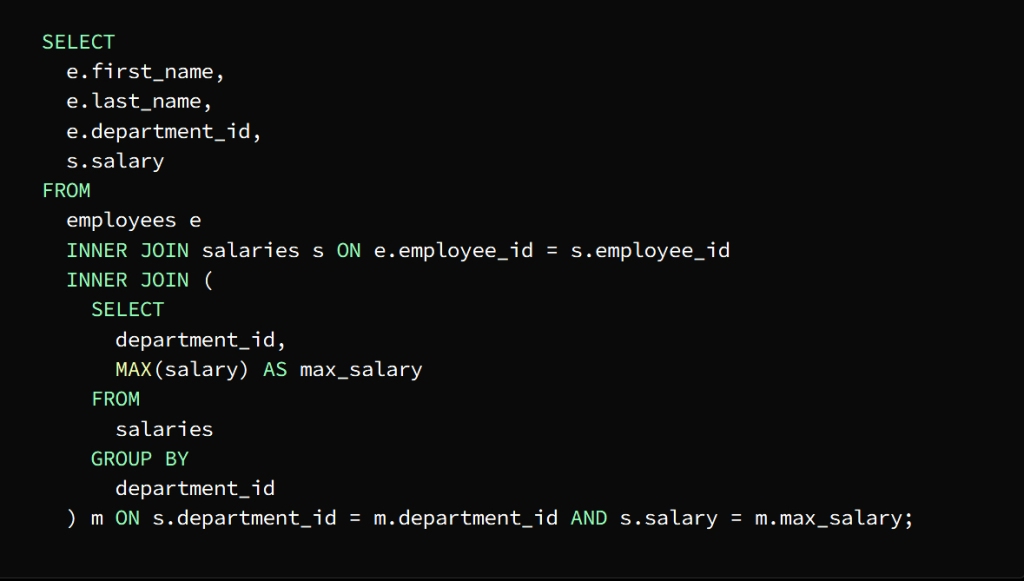
It is required to know the highest paid employees in each department

We can find the highest salary in each department using a subquery and then join the result to the Employees and Salaries tables to extract the names of the employees who earn that salary

 After executing the subquery as a first step, a result set representing the highest salary in each department is returned, then the employee and salary tables are linked to the result of the subquery by means of the main query to extract the names of the highest paid employees in each department.

To demonstrate this join process, an INNER JOIN statement is used to join the Employee and Salary tables, using the employee_id column as the join key.

The subquery is joined to the main query using the department_id column

The salary column is then used to match the highest salary in each department

The result appears in the form of a table containing the names of the highest paid employees in each department along with the department ID and salary

* Cross Joins

Cross Joins are a type of join operation that returns the Cartesian product of two or more tables without using a join condition, but by combining rows from one table with rows from another table separately, then the result is a table consisting of the available combinations of rows from both tables

This operation is useful in certain circumstances, such as performing a calculation that requires all available value combinations from a set of tables, or generating test data, for example

For clarity we have two tables

The first table is the customers table and it consists of columns

customer_id, customer_name, and city

The second table is the orders table and it consists of columns

order_id, customer_id, and order_date

The requirement is to know the total number of orders for each customer in each city

This is done by creating a result set that includes each customer with each city and then joining the result to the orders table to extract the number of requests for each group

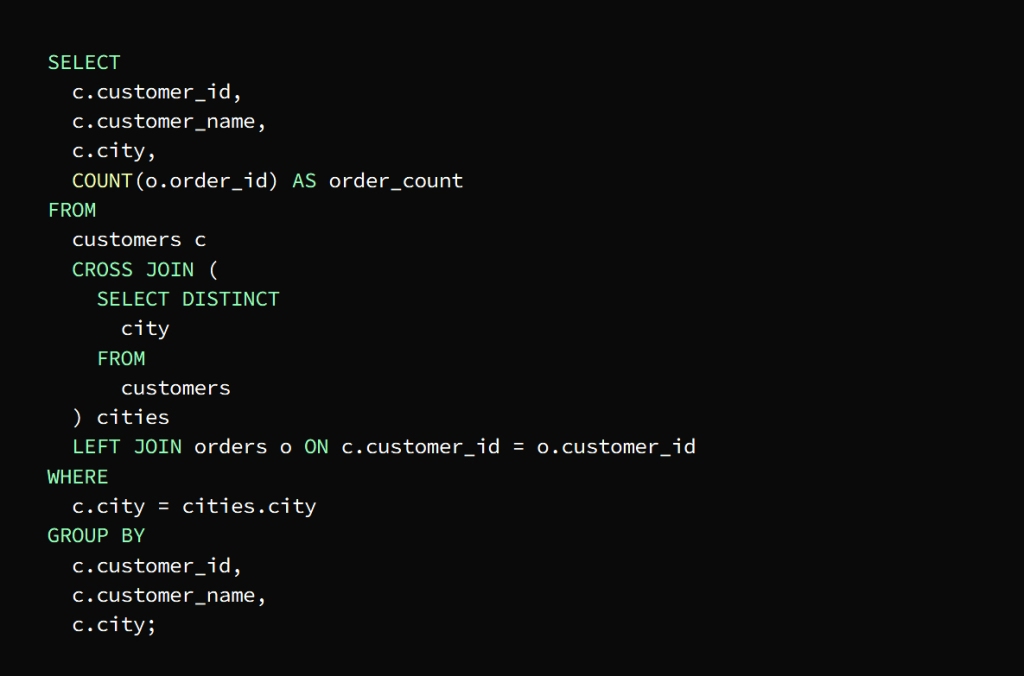
The previous image shows that a result set has been created that includes each customer with each city, and thus the query is Use cross join to return the result set that contains a group that includes the customer and the city

The main query then joins the result of the cross-join with the orders table

Important Notes :

Here left join should be used to keep clients visible in the result even if they did not place any order

In order to ensure that the result of the number of requests for each customer appears in his city, the WHERE clause is used to sort the results and get the rows that match the city in which the customer resides in the cross join

To group the result according to the customer’s ID, name, and city, we use the GROUP BY statement

To calculate the number of orders per customer in each city, we use the COUNT() function.

The result is finally shown in the form of a table containing the total number of orders for each customer in each city
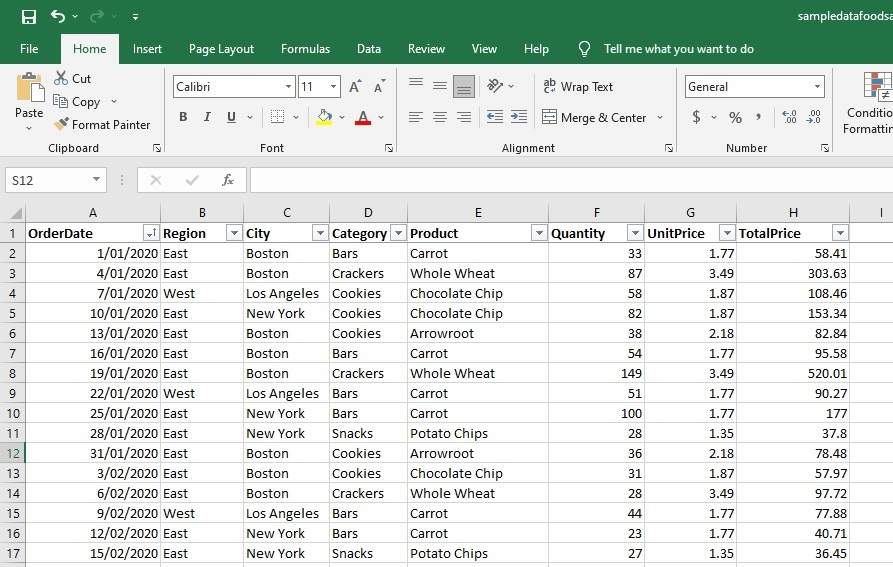
* temporary tables

These tables are relied upon to store the intermediate results in memory or on disk and use them at the end of the work and then get rid of them automatically

Or this type of table is used to divide large and complex queries into smaller parts to make it easier to process

The CREATE TEMPORARY TABLE statement is used to create temporary tables

The SELECT, INSERT, UPDATE, DELETE commands are used to process these tables as if they were regular tables in order to reduce the amount of large and complex data to facilitate processing.

For clarity, we have a sales table consisting of the following columns

date, product, category, sales_amount

It is required to create a report showing the total sales for each category for each month over the past year

We can address this issue through the following actions

The first goal is to obtain the total sales for each category. This is done by creating a temporary table that includes a summary of sales data for each month, and then linking it to the sales table.

This is done by following these steps

Create the temporary table using the CREATE TEMPORARY TABLE statement

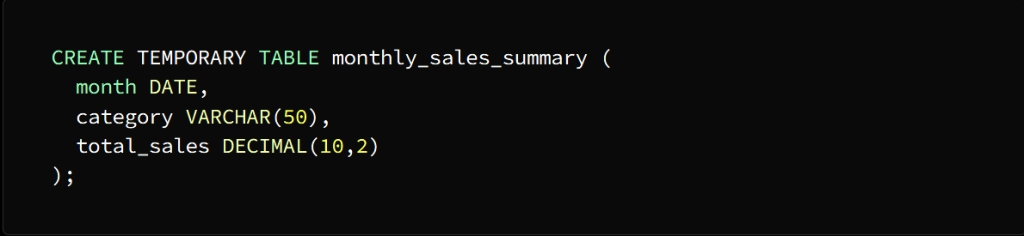
A temporary table named Monthly_sales_summary is created with three columns:

month, category, and total_sales

The month column is of type DATE

category column of type VARCHAR (50)

total_sales column of type DECIMAL(10,2)

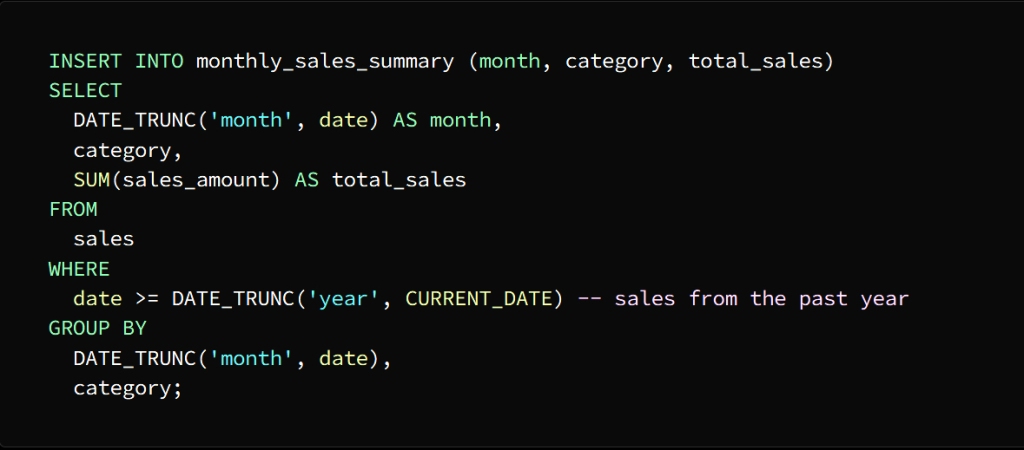
Using the INSERT INTO statement, we populate the temporary table with the shortened data

To separate the date column into the month level and group the sales data by month and category, we used the DATE_TRUNC function

Then we enter the result of this query into the month_sales_summary table, which now contains a summary of sales data for each month separately.

To get the total sales for each category we can join the temporary table with the sales table

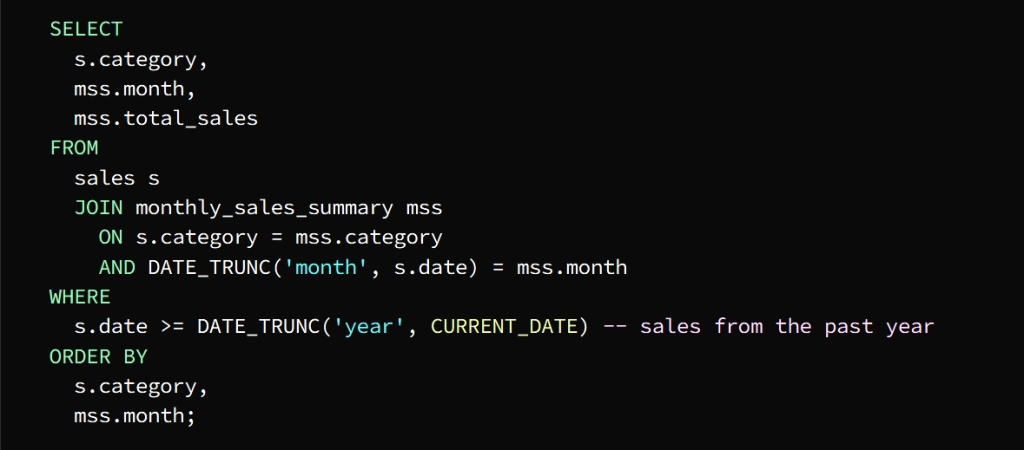
The Sales table is joined with the Monthly_sales_summary table in the columns designated for category and month

From the temporary table, the month, category, and total_sales columns can be selected

To get the required result, which is last year’s sales data, we use the WHERE phrase

To sort the result by category and month we use the ORDER BY statement

The result of the query appears in the form of a table containing the total sales for each category for each month of the previous year

* Materialized Views

The task of these insights is to improve the performance of frequently executed queries, which are various results that are previously stored in the form of actual tables and are called to the original tables without the need to perform operations in them

This process is used to improve the performance of complex queries through data storage and business intelligence applications, which contributes to shortening the time for preparing reports and raising the efficiency of dashboards

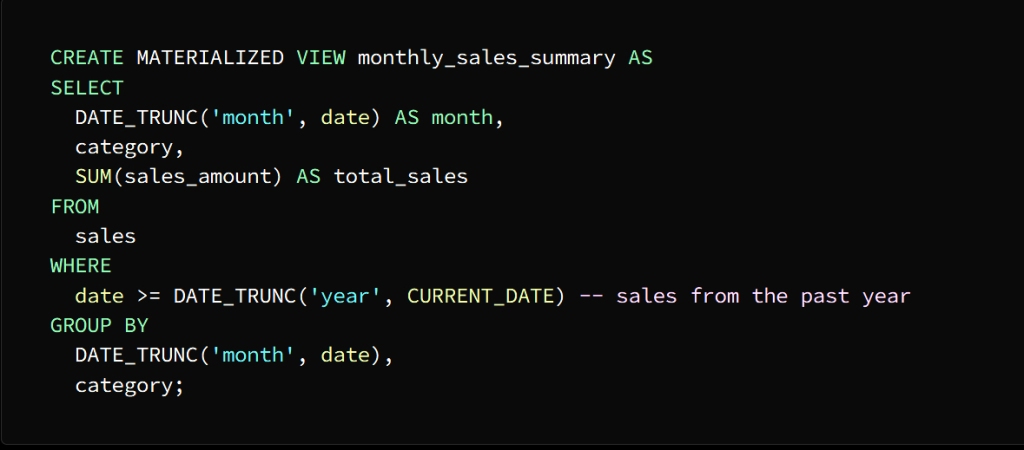
The image above shows that an actual offer named Monthly_sales_summary has been created

This presentation contains a summary of sales data for each category for each month

We use the SELECT statement to store the result in the actual view

Actual views are automatically updated when the underlying data changes although they are similar to tables stored on disk, and can also be updated manually using the

REFRESH MATERIALIZED VIEW

You can query the actual view once it is created just like any other table

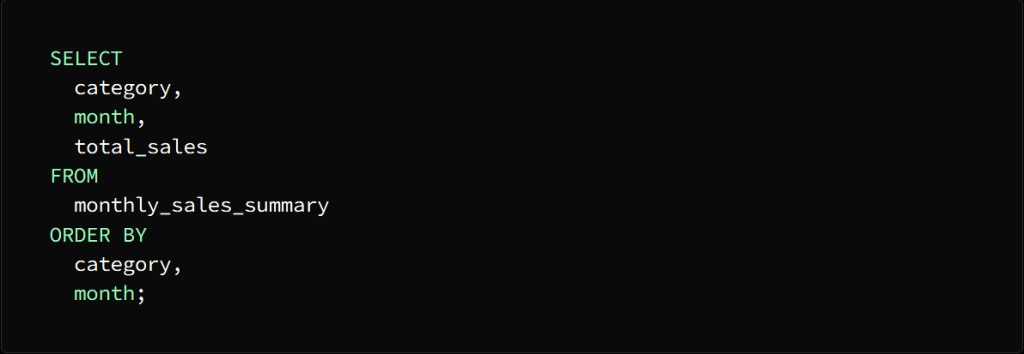
  In the above image the category, month and total sales columns are selected from the actual view month_sales_summary and it sorts the result by category and month

As we mentioned earlier, with the actual view method, you can shorten a lot of the time it takes to run the query, as this method allows you to use pre-calculation and storage of summary data.

In conclusion:

Remember, my reader friend, that keeping abreast of developments and keeping pace with the accelerating technology is very important, and your knowledge of all new technologies and skills makes things easier for you and even increases your scientific level, whether in the field of programming and data analysis or in any other scientific field.

I hope that you have gained a great deal of interest, and please share this information and support the blog so that we can continue to provide everything new, and we are pleased to see your opinions on the comments, thank you.

Advertisements

SQL مجموعة تقنيات

متقدمة لا غنى عنها لكل عالِم بيانات

Advertisements

(SQL)  لغة الاستعلام الهيكلية 

هي لغة الاستعلام القياسية لقاعدة البيانات العلائقية، تمتاز هذه اللغة ببساطتها وسهولة فهمها، إلا أن الانتقال إلى مستوى متقدم في تحليل البيانات يتطلب إتقان التقنيات المتقدمة لهذه اللغة

وعندما نتحدث عن التقنيات المطلوب تعلمها للانتقال إلى مستوى متقدم فإننا نتحدث عن منظومة من الوظائف والميزات التي تتيح لك القيام بمهام معقدة على البيانات كالضم والتجميع والاستعلامات الفرعية ووظائف النافذة وغيرها من الوظائف الأخرى التي يمكنها التعامل مع البيانات الضخمة للحصول على نتائج فعالة ودقيقة

بعض الأمثلة الحية

المتقدمة SQL على استخدام تقنيات

وظائف النافذة *

من خلال هذه التقنية يمكنك تنفيذ عمليات حسابية عبر عدة صفوف مرتبطة بالصف المحدد

كأن يكون لدينا جدول طلبات يضم الأعمدة التالية

order_id, customer_id, order_date, order_amount

والمطلوب حساب المبيعات الإجمالي الحالي لكل عميل على حدة مرتبة حسب تاريخ الطلب

لتنفيذ هذه المهمة SUM بالإمكان الاستعانة بـ

ليتم حساب الإجمالي الحالي لكل عميل على حدى

SUM يجب تطبيق الدالة

order_amount على عمود  

customer_id  ويتم تقسيمها وفق العمود

ORDER BY تشير عبارة

إلى أن ترتيب الصفوف يتم وفق تواريخ الطلب في كل قسم

: تشير عبارة

ROWS BETWEEN UNBOUNDED PRECEDING AND CURRENT ROW

إلى أن الحساب يقع ضمن النافذة المحصورة بين الصفوف الواقعة في بداية القسم حتى الصف الحالي ستأتي نتيجة الاستعلام على شكل جدول مؤلف من نفس أعمدة جدول الطلبات

run_total مضافاً إليها عمود يسمى

والدال على المبيعات الإجمالية الحالية لكل عميل وكما ذكرنا مرتبة حسب تواريخ الطلبات

(CTEs) عبارات الجدول الشائعة*

CTEs تتيح لك

الحصول على مجموعة من النتائج التي يمكن الاستعانة بها

في وقت لاحق SQL في جمل

على سبيل المثال: لدينا جدول ولنطلق عليه اسم جدول الموظفين مؤلف من الأعمدة التالية

employee_id, employee_name, department_id, salary

والمطلوب حساب متوسط الراتب لكل قسم، ثم البحث عن الموظفين الأعلى راتباً من متوسط الراتب الخاص بالقسم الذي ينتمون إليه

لإجراء استعلامين CTE يمكن الاستعانة بـ

الأول لحساب متوسط الراتب كل قسم والثاني للبحث عن الموظفين الأعلى راتباً من متوسط راتب القسم

نلاحظ هنا أنه تم تقسيم المهمة إلى مرحلتين لتسهيل الاستعلام

مرحلة أولى وهي حساب الراتب لكل قسم

مرحلة ثانية إيجاد الموظفين الأعلى راتباً من متوسط راتب القسم الذي ينتمون إليه

CTE ففي الاستعلام الأول

  department_avg_salary والمسمى

المخصص لحساب الراتب لكل قسم وذلك باستخدام

GROUP BY وعبارة AVG دالة

التي تقوم بفرز الموظفين كلٌ حسب القسم الذي ينتمي إليه

CTE أما الاستعلام الثاني

department_avg_salary المسمى

فيستخدم كما لو كان جدولاً ثم يتم

department_id ضمه إلى جدول الموظفين في العمود

WHERE ثم يتم استخلاص النتيجة بواسطة

لنحصل في النهاية على الموظفين الأعلى راتباً من متوسط الراتب الخاص بالقسم الذي ينتمون إليه

الدالات التجميعية *

يمكن تعريف الدالات التجميعية بشكل مختصر على أنها وظائف مهمتها إجراء عملية حسابية على مجموعة من القيم لاستخلاص نتيجة على شكل قيمة واحدة كإجراء عمليات حسابية في جدول على عدة صفوف أو أعمدة بغية الحصول على خلاصة بيانات مفيدة

وفي الحقيقة يعتبر استخدام الدالات التجميعية

SQL مكسباً حقيقياً في لغة

إذ تجعل الاستعلامات فيها أكثر سهولة ودقة

وتعتبر الدالات

SUM, AVG, MIN, MAX, COUNT

SQL هي الأكثر استخداماً في

وللتوضيح: لدينا جدول مبيعات مؤلف من الأعمدة التالية

sale_id, product_id, sale_date, sale_amount, region

والمطلوب حساب المبيعات الإجمالية ومتوسط المبيعات الخاصة بكل منتج على حدة ثم تحديد المنتج الأكثر مبيعاً في كل منطقة

يتم ذلك من خلال اتباع الخطوات التالية

علينا فرز المبيعات حسب المنتج والمنطقة وحساب إجمالي ومتوسط المبيعات ثم اكتشاف المنتج الأكثر مبيعاً في المنطقة وذلك عن طريق الاستعانة بالدالات التجميعية

استخدمنا في هذا المثال

AVG, SUM, RANK ثلاث دالات تجميعية 

وسنبين مهمة كل واحدة منها على حدة

AVG الدالة

مهمتها حساب متوسط قيمة المنتج والمنطقة

SUM الدالة

مهمتها حساب القيمة الإجمالية لكل منتج والمنطقة

GROUP BY باستخدام عبارة

RANK الدالة

مهمتها استكشاف المنتج الأكثر مبيعاً في كل منطقة

ولتحديد الفرز وفق كل منطقة

هذه المهمة OVER تتولى عبارة

ولتحديد العمود لتقسيم البيانات (المنطقة)

PARTITION BY  نستخدم عبارة

أما للحصول على الترتيب التنازلي لمجموع قيمة كل منتج في

ORDER BY كل منطقة تحدده عبارة

: تأتي نتيجة الاستعلام على شكل أعمدة هي

product_id, region, total_sale_amount, avg_sale_amount, rank

بحيث يدل عمود الترتيب على تصنيف كل منتج في كل منطقة وفق القيمة الإجمالية للبيع بحيث يحصل المنتج الأكثر مبيعاً في كل منطقة على المرتبة الأولى

تتنوع استخدامات الدالات التجميعية حسب المهام الموكلة إليها فيمكنك مثلاً حساب السجلات وحساب الحد الأقصى للقيم وغيرها من المهام الأخرى

Advertisements

الجداول المحورية *

وهي جداول تحوي بيانات مستخلصة من جداول كبيرة بغية تحليلها بشكل أسهل بحيث تتيح تحويل البيانات من الصفوف إلى الأعمدة لعرض البيانات بشكل أكثر تنسيقاً

يتم بناء هذه الجداول

PIVOT بالاستعانة بعامل التشغيل

والذي مهمته فرز البيانات وفق عمود معين ثم إظهار النتائج على شكل جدول منسق

للتوضيح

PIVOT استُخدِمَ عامل التشغيل

في الصورة السابقة لتحديد محور البيانات

product_id حسب معرف المنتج

بالإضافة إلى أعمدة لكل منتج وصفوف لكل عميل

SUM يأتي دور الدالة

لتقوم بحساب الكمية الإجمالية لكل منتج مطلوب من قبل كل عميل

pأما الاستعلام الفرعي

يتولى مهمة استخراج الأعمدة الضرورية من جدول الطلبات

PIVOT ثم يتم تشغيل

على الاستعلام الفرعي بالتعاون

SUM مع الدالة

لمعرفة الكمية الإجمالية لكل منتج يتم طلبه من قبل كل عميل

FOR أما عبارة

product_id فمهمتها تحديد العمود المحوري

في مثالنا هذا

IN أما عبارة

تحدد القيم المستهدفة ( [1]، [2]، [3]، [4]، [5] ) 

يظهر الجدول المحوري كنتيجة للاستعلام عن الكمية الإجمالية التي طلبها كل عميل على شكل أعمدة لكل منتج وصفوف لكل عميل

الاستعلامات الفرعية *

وهي استعلامات متداخلة مهمتها استعادة بيانات من جدول واحد أو أكثر ونتائجها تستخدم في الاستعلام الرئيسي كما ويمكن أن تكون وظيفتها فرز البيانات وتجميعها في صف واحد أو مجموعة صفوف تستخدم الاستعلامات الفرعية مثل

SELECT, FROM, WHERE, HAVING 

SQL ضمن أقواس في أماكن متعددة من عبارة

وللتوضيح: لدينا جدولين

الجدول الأول هو جدول الموظفين يتألف من الأعمدة التالية

employee_id, first_name, last_name, department_id

الجدول الثاني هو جدول الرواتب ويتألف من الأعمدة التالية

employee_id, salary, salary_date

والمطلوب معرفة الموظفين الأعلى راتباً في كل قسم

يمكننا إيجاد الراتب الأعلى في كل قسم باستخدام استعلام فرعي ثم ضم النتيجة إلى جدولَي الموظفين والرواتب لاستخلاص أسماء الموظفين الذين يتقاضون هذا الراتب

 بعد تنفيذ الاستعلام الفرعي كخطوة أولى يتم إرجاع مجموعة نتائج تمثل الراتب الأعلى في كل قسم ثم يتم ربط جداول الموظفين والرواتب بنتيجة الاستعلام الفرعي بواسطة الاستعلام الرئيسي لاستخراج أسماء الموظفين الأعلى راتباً في كل قسم

ولشرح عملية الانضمام هذه

INNER JOIN تستخدم عبارة

للانضمام إلى جداول الموظفين والرواتب وذلك باستخدام

 كمفتاح الانضمام  employee_id العمود معرف الموظف

ويتم ربط الاستعلام الفرعي بالاستعلام الرئيسي

department_id باستخدام العمود معرف القسم

salary ثم يتم استخدام عمود الراتب

لمطابقة الراتب الأعلى في كل قسم

فتظهر النتيجة على شكل جدول يحوي أسماء الموظفين الأعلى راتباً في كل قسم بجانب معرف القسم والراتب

Cross Joins

Cross Joins عمليات الانضمام المتقاطعة

هي أحد أنواع عمليات الربط التي تعيد المنتج الديكارتي لجدولين أو أكثر دون استخدام شرط ربط بل بتجميع صفوف من جدول مع صفوف من جدول آخر كل على حدة ثم تكون النتيجة جدول يتألف من مجموعات الصفوف المتاحة من كلا الجدولين

تفيد هذه العملية في ظروف معينة كإجراء عملية حسابية تتطلب كل مجموعات القيمة المتاحة من مجموعة جداول أو إنشاء بيانات الاختبار مثلاً

للتوضيح لدينا جدولان

وهو يتألف من الأعمدة customers الجدول الأول هو جدول العملاء

customer_id, customer_name, city

وهو يتألف من الأعمدة orders الجدول الثاني هو جدول الطلبات

order_id, customer_id, order_date

المطلوب هو معرفة عدد الإجمالي لطلبات كل عميل في كل مدينة

يتم ذلك بإنشاء مجموعة نتائج تضم كل عميل مع كل مدينة ثم ضم النتيجة إلى جدول الطلبات لاستخراج عدد طلبات كل مجموعة

توضح الصورة السابقة أنه تم إنشاء مجموعة نتائج تضم كل عميل مع كل مدينة

cross join وبهذا يكون الاستعلام استخدم

لتعود مجموعة النتائج التي تحتوي مجموعة تضم العميل والمدينة

ثم ينضم الاستعلام الرئيسي إلى نتيجة الضم التبادلي مع جدول الطلبات

:ملاحظات هامة

left join هنا يجب استخدام

للمحافظة على ظهور العملاء في النتيجة حتى لو لم يقوموا بتقديم أي طلب

ولضمان ظهور نتيجة عدد طلبات كل عميل في مدينته

WHERE تستخدم عبارة

لفرز النتائج والحصول على الصفوف التي تطابق المدينة

cross join التي يقيم فيها العميل في

لتجميع النتيجة وفق معرف العميل واسمه ومدينته

GROUP BY نستخدم عبارة

ولحساب عدد طلبات كل عميل في كل مدينة

COUNT () نستخدم الدالة

تظهر النتيجة في النهاية على شكل جدول يحتوي العدد الإجمالي لطلبات كل عميل في كل مدينة

جداول مؤقتة *

يتم الاعتماد على هذه الجداول لتخزين النتائج الوسيطة في الذاكرة أو على القرص واستخدامها في نهاية العمل ثم التخلص منها تلقائياً

أو يستخدم هذا النوع من الجداول لتقسيم الاستعلامات الكبيرة والشائكة إلى أجزاء أصغر لتسهيل معالجتها

CREATE TEMPORARY TABLE تستخدم عبارة

لإنشاء الجداول المؤقتة

SELECT, INSERT, UPDATE, DELETE وتستخدم الأوامر

لمعالجة تلك الجداول كأنها جداول عادية بغية تقليل كمية البيانات الكبيرة والمعقدة لتسهيل معالجتها

وللتوضيح لدينا جدول مبيعات يتألف من الأعمدة التالية

date, product, category, sales_amount

والمطلوب إنشاء تقرير يبين المبيعات الإجمالية لكل فئة لكل شهر على خلال العام الفائت

يمكننا معالجة هذا الموضوع من خلال الإجراءات التالية

الهدف الأول هو الحصول على إجمالي المبيعات لكل فئة ويتم ذلك بإنشاء جدول مؤقت يشمل ملخص لبيانات المبيعات عن كل شهر ثم ربطه بجدول المبيعات

ويتم ذلك باتباع الخطوات التالية

:إنشاء الجدول المؤقت

وذلك باستخدام عبارة

CREATE TEMPORARY TABLE

Monthly_sales_summary فينشأ جدول مؤقت يسمى

يتألف من ثلاثة أعمدة

month, category, total_sales

DATEمن النوع month عمود الشهر

VARCHAR (50) من نوع category عمود الفئة

total_sales عمود إجمالي المبيعات

DECIMAL (10،2) من نوع

INSERT INTO وباستخدام عبارة

نقوم بتعبئة الجدول المؤقت بالبيانات المختصرة

لفصل عمود التاريخ إلى المستوى الشهر وتجميع بيانات المبيعات وفق الشهر والفئة

DATE_TRUNC استخدمنا الدالة

ثم نقوم بإدخال نتيجة هذا الاستعلام

month_sales_summary في جدول

الذي أصبح يحوي ملخص لبيانات مبيعات كل شهر على حدة وللحصول على إجمالي مبيعات كل فئة يمكننا الانضمام إلى الجدول المؤقت مع جدول المبيعات

يتم الانضمام إلى جدول المبيعات

Monthly_sales_summary مع جدول

في الأعمدة المخصصة للفئة والشهر

ومن الجدول المؤقت يمكن تحديد أعمدة

 month, category, total_sales

ولنحصل على النتيجة المطلوبة وهي بيانات مبيعات العام الماضي

WHERE نستخدم عبارة

ولفرز النتيجة حسب الفئة والشهر

ORDER BY نستخدم عبارة

تظهر نتيجة الاستعلام على شكل جدول يحوي إجمالي المبيعات لكل فئة عن كل شهر من العام الفائت

الرؤى الفعلية *

مهمة هذه الرؤى تحسين أداء الاستعلامات التي يتم تنفيذها بشكل متكرر وهي عبارة عن نتائج متنوعة مخزنة مسبقاً على شكل جداول فعلية ويتم استدعاؤها إلى الجداول الأصلية دون الحاجة إلى إجراء العمليات فيها

يستفاد من هذه العملية في تحسين أداء الاستعلامات المعقدة من خلال تخزين البيانات وتطبيقات ذكاء الأعمال مما يسهم في اختصار الوقت بالنسبة لإعداد التقارير ورفع كفاءة لوحات المعلومات

توضح الصورة أعلاه أنه تم إنشاء

Monthly_sales_summary عرض فعلي اسمه

هذا العرض يحوي ملخص لبيانات المبيعات لكل فئة عن كل شهر  

SELECT نستخدم عبارة

لتخزين النتيجة في الرؤية الفعلية

يتم تحديث طرق العرض الفعلية تلقائياً عندما تتغير البيانات الأساسية على الرغم من أنها تشبه الجداول من حيث تخزينها على القرص، كما ويمكن تحديثها يدوياً باستخدام عبارة

REFRESH MATERIALIZED VIEW

يمكنك الاستعلام عن العرض الفعلي بمجرد إنشائه كأي جدول آخر

في الصورة أعلاه يتم تحديد أعمدة الفئة والشهر وإجمالي المبيعات

month_sales_summary من طريقة العرض الفعلية

ويقوم بفرز النتيجة وفق الفئة والشهر

كما ذكرنا سابقاً بطريقة العرض الفعلي يمكنك اختصار الكثير من الوقت الذي يستغرقه تشغيل الاستعلام إذ أن هذه الطريقة تتيح لك استخدام الحساب المسبق لبيانات الملخص وتخزينها

:ختاماً

تذكر صديقي القارئ أن مواكبة التطورات والسير في ركب التكنولوجيا المتسارعة أمر غاية في الأهمية ومعرفتك بكل ما جديد من تقنيات ومهارات يسهل عليك كثيراً من الأمور بل ويزيد من مستواك العلمي سواء في مجال البرمجة وتحليل البيانات أو في أي مجال علمي آخر

أتمنى أن تكونوا قد حصلتم على قسط كبير من الفائدة ونرجو مشاركة هذه المعلومات ودعم المدونة لنستمر في تقديم كل ما هو جديد ويسعدنا مشاهدة آرائكم على التعليقات وشكراً

Advertisements

A Comprehensive Spotlight on SQL For Data Analysis

Advertisements

SQL is a powerful programming language dedicated to data in relational databases. It is a language that has existed for decades and is relied upon by many large companies around the world. Data analysts use it to access, read, process and analyze data saved in the database to form a comprehensive view that helps make the right decisions.

We will discuss in detail the mechanism and stages of working on this tool in terms of its query capabilities with databases, while mentioning the types of data analysis.

data analysis

All companies of all sizes and specializations seek advancement and growth, so their primary goal in this approach is to satisfy customers and provide them with the best services. By expanding the customer base, the company grows and thrives, and therefore most companies intend to examine, purify, transform and model data to extract valuable information that helps in making critical decisions, this process It’s called data analysis

Types of data analysis

This classification is done according to the types of data and terms of reference for the analysis process

Descriptive analysis:

It is the main analysis on which the rest of the types of analyzes are based, and it is the simplest, so it is the most used for data in all commercial activities at the present time. This analysis allows extracting trends between the raw data and giving a view of the events in their time. Here, the initial answer to “what happened” appears by summarizing the previous data, and it is usually represented in the form of a dashboard

Diagnostic analysis:

It is the step that immediately follows the previous step, which is to delve deeper into the previous question, “What happened?” This step is embodied in asking another question, which is “Why did it happen?” Diagnostic analysis, then, is the one that completes the work of the descriptive analysis by taking the initial readings resulting from the descriptive analysis and deepening them to interpret and analyze them in order to reach more correlations between the data, so that features of behavior patterns begin to form for us, and from the learned aspects also is that if problems arise during work, then you are Now you have enough data related to this problem, so the solution becomes easier, and thus this saves you from having to re-work

Predictive analytics:

It is complementary to the work of the two previous analyses, and from its name it seems that it makes probabilities and predictions about the events that will come later based on previous predictions in addition to the current variables. Thus, this analysis represents the answer to the third question, which is “what might happen in the future”?

This type of analysis helps companies make more accurate and effective decisions

Mandatory Analysis:

It is the final limit of data analysis capabilities, as it is not satisfied with forecasting or forecasting, but rather proposes options to benefit from the results of previous analyzes, and determines the steps that must be implemented in the event of a potential problem or forming a plan to develop work. This is done by using advanced techniques such as machine learning algorithms. Especially when dealing with huge amounts of data

So this analysis is the answer to the question “what should we do next”? Which defines the general approach to the company’s business plan

What are the advantages of SQL when used in data analysis?

* Easy and uncomplicated language

* Speed in query processing

* Ability to call up big data from different databases

* Providing various documents to analysts

Advertisements

Explain the use of SQL in data analysis

Temporary tables

Temporary tables in SQL are defined as tables that are created to perform a temporary task and persist for a specific period of time or during a session by storing and processing intermediate results using the same join, select, and update techniques.

Assembly as per requirement

For example, this phrase is used to count the number of employees in each department or to obtain the salaries of the department in total, so it is used to extract summary data based on different groups, whether on one or more columns

aggregation functions

Its task is to perform an arithmetic operation on a set of values to extract a single value

String functions and operations

The task of SQL string operators is to perform matching on the form, sequence, capitalize the string, and other matching functions

Date and time operations

Some of the services offered by SQL are many types of date and time tasks such as

SYSUTCDATETIME()

CURRENT_TIMESTAMP

 GETDATE()

 DAY()

 MONTH()

 YEAR()

 DATEFROMPARTS()

DATETIME2FROMPARTS()

TIMEFROMPARTS()

DATEDIFF()

DATEADD()

ISDATE()

etc. It is used to implement date and time entries

Display and indexing methods

The database is the main repository for the index, so indexing the view helps speed up work and improve the performance of queries and applications that use it

Join:

This statement is used to combine different tables in databases using a primary key and a foreign key

The following explains the different types of JOINs in SQL with an example of data in left and right tables

(INNER) JOIN: Returns records that contain identical values in both tables

LEFT (OUTER) JOIN: Returns all records from the left table and matching records from the right table

RIGHT (OUTER) JOIN : Returns all records from the right table and matching records from the left table

FULL (OUTER) JOIN : Returns all records when there is a match in the left or right table

windows functionality

They are intended to work within an array of rows to extract one value per row from the underlying query so they simplify queries as much as possible

nested queries

It is a query inside another query, and the result of the inner query is used by the outer query

Data analysis tools:

SQL: The standard programming language for performing programming used to communicate with relational databases, and it also has a major role in retrieving the required information.

Python: a versatile programming language, which is very popular in the field of technology and programming, and no data analyst can do without it. It relies on the principle of its work on readability, so it is not classified within complex programming languages. different analysis

R: Its tasks and features are not much different from Python, except that it is specialized in performing statistical analysis of data

Microsoft Excel: The most famous program in the world in the field of spreadsheets. It has many different features, ranging from scheduling, performing calculations, and typical graphing functions for data analysis.

Tableau: It is intended for creating visualizations and interactive dashboards without the need for high coding expertise, so it is the perfect tool for commercial data analysis

In conclusion

We put in your hands, dear reader, everything related to the SQL language

If you see that there is information that we did not mention regarding this programming language, share it with us in the comments to exchange information and benefit everyone, Thank you.

Advertisements

لتحليل البيانات SQL إضاءة شاملة على

Advertisements

هي لغة برمجة قوية SQL

مخصصة للبيانات الموجودة في قواعد البيانات العلائقية وهي لغة موجودة منذ عشرات السنين وتعتمد عليها الكثير من الشركات الكبرى في جميع أنحاء العالم إذ يستخدمها محللو البيانات للوصول إلى البيانات المحفوظة في قاعدة البيانات وقراءتها ومعالجتها وتحليلها لتكوين رؤية شاملة تساعد على اتخاذ القرارات الصحيحة

وسنتناول بالتفصيل آلية ومراحل العمل على هذه الأداة من حيث إمكانات استعلاماتها مع قواعد البيانات مع ذِكر أنوع تحليل البيانات

تحليل البيانات

تسعى جميع الشركات على مختلف أحجامها واختصاصاتها إلى الارتقاء والنمو لذا هدفها الأساسي في هذا النهج هو إرضاء العملاء وتقديم أفضل الخدمات لهم فبتوسع قاعدة العملاء تنمو الشركة وتزدهر وبالتالي تعمد معظم الشركات على فحص وتنقية وتحويل ونمذجة البيانات لاستخراج معلومات قيّمة تساعد في اتخاذ القرارات الحاسمة، هذه العملية تسمى تحليل البيانات

أنواع تحليل البيانات

ويتم هذا التصنيف حسب أنواع البيانات والاختصاصات المحددة لعملية التحليل

:التحليل الوصفي

هو التحليل الرئيسي الذي ترتكز عليه باقي أنواع التحليلات وهو أبسطها لذا فهو الأكثر استعمالاً للبيانات في كافة النشاطات التجارية في الوقت الراهن. يسمح هذا التحليل باستخلاص الاتجاهات بين البيانات الأولية وإعطاء نظرة عن الأحداث في وقتها وهنا تظهر الإجابة الأولية على “ماذا حدث” من خلال تلخيص البيانات السابقة وتتمثل عادة على شكل لوحة معلومات

:التحليل التشخيصي

وهو الخطوة التي تلي الخطوة السابقة مباشرة والتي تتمثل في التعمق أكثر في السؤال السابق “ماذا حدث” فتتجسد هذه الخطوة في طرح سؤال آخر وهو “لماذا حدث”؟  فالتحليل التشخيصي إذاً هو الذي يتمم عمل التحليل الوصفي من خلال أخذ القراءات الأولية الناتجة عن التحليل الوصفي والتعمق بها لتفسيرها وتحليلها بغية الوصول إلى المزيد من ترابطات بين البيانات فتبدأ تتشكل لنا معالم أنماط السلوك ومن الجوانب المستفادة أيضاً هو أنه في حال ظهور مشكلات أثناء العمل فحكماً أنت أصبح لديك البيانات الكافية المتعلقة بهذه المشكلة فيصبح الحل أسهل وبالتالي هذا يغنيك عن تضطر لإعادة العمل

:التحليلات التنبؤية

وهو متمم لعمل التحليلين السابقين، ومن اسمه يبدو أن يقوم بوضع احتمالات وتنبؤات حول الأحداث التي ستأتي فيما بعد بناءً على تنبؤات سابقة إلى جانب المتغيرات الراهنة وبالتالي يمثل هذا التحليل الإجابة عن السؤال الثالث وهو “ماذا يمكن أن يحدث في المستقبل”؟

يساعد هذا النوع من التحليل على اتخاذ قرارات أكثر دقة وفاعلية للشركات

:التحليل الإلزامي

وهو الحد النهائي لقدرات تحليل البيانات، حيث أنه لا يكتفي بالتوقّع أو التنبؤ بل يقوم باقتراح خيارات للاستفادة من النتائج التحليلات السابقة، وتحديد الخطوات التي يجب تنفيذها في حال حدوث مشكلة محتملة أو تشكيل خطة لتطوير العمل، يتم ذلك عن طريق استخدام تقنيات متطورة كخوارزميات التعليم الآلي وخصوصاً عند التعامل مع كميات ضخمة من البيانات

إذاً هذا التحليل هو الإجابة عن السؤال “ماذا يجب أن نفعل بعد ذلك”؟ والذي يحدد النهج العام لخطة عمل الشركة  

عند استخدامه في تحليل البيانات؟ SQL ماهي ميزات

لغة سهلة وغير معقدة *

السرعة في معالجة الاستعلام *

القدرة على استدعاء البيانات الضخمة من قواعد البيانات مختلفة *

توفير وثائق متنوعة للمحللين *

Advertisements

في تحليل البيانات SQL  شرح استخدام

الجداول المؤقتة

SQL تعرف الجداول المؤقتة في

على أنها الجداول التي يتم انشاؤها لتنفيذ مهمة مؤقتة ويستمر وجودها لمدة زمنية محددة أو خلال جلسة ما عن طريق تخزين النتائج الوسيطة ومعالجتها باستخدام نفس تقنيات الانضمام والتحديد والتحديث

التجميع حسب الشرط

على سبيل المثال تستخدم هذه العبارة لإحصاء عدد الموظفين في كل قسم أو الحصول على رواتب القسم بالمجمل، إذاً هي تستخدم لاستخراج بيانات التلخيص بناءً على مجموعات مختلفة سواء على عمود أو أكثر

وظائف التجميع

مهمتها تنفيذ عملية حسابية على مجموعة من القيم لاستخراج قيمة واحدة

وظائف وعمليات السلسلة

SQL مهمة عوامل تشغيل السلسلة في

هي تنفيذ المطابقة على النموذج والتسلسل وجعل السلسلة تبتدئ بحروف كبيرة وغيرها من وظائف المطابقة الأخرى

عمليات التاريخ والوقت

SQL من الخدمات التي يقدمها

أنواع عديدة من مهام التاريخ والوقت مثل

SYSUTCDATETIME ()

CURRENT_TIMESTAMP

 GETDATE ()

 DAY ()

 MONTH ()

 YEAR ()

 DATEFROMPARTS ()

 DATETIME2FROMPARTS ()

 TIMEFROMPARTS ()

DATEDIFF ()

DATEADD ()

 ISDATE ()

وغيرها وهي تستخدم لتنفيذ إدخالات التاريخ والوقت

طرق العرض والفهرسة

تعتبر قاعدة البيانات المستودع الرئيسي للفهرس لذا فعملية فهرسة العرض تساعد على تسريع العمل وتحسين أداء الاستعلامات والتطبيقات التي تستخدمها

:Joins

تستخدم هذه العبارة لدمج جداول مختلفة في قواعد البيانات ويتم ذلك باستخدام مفتاح أساسي ومفتاح خارجي

SQL في JOINS فيما يلي شرح الأنواع المختلفة من

ضمن مثال على بيانات في جدولين يميني ويساري

: (INNER) JOIN

إرجاع السجلات التي تحتوي على قيم متطابقة في كلا الجدولين

: LEFT (OUTER) JOIN

إرجاع كافة السجلات من الجدول الأيسر والسجلات المتطابقة من الجدول الأيمن

: RIGHT (OUTER) JOIN

إرجاع كافة السجلات من الجدول الأيمن والسجلات المتطابقة من الجدول الأيسر

: FULL (OUTER) JOIN

إرجاع كافة السجلات عند وجود تطابق في الجدول الأيمن أو الأيسر

وظائف النوافذ

مخصصة للعمل ضمن مجموعة من الصفوف لاستخراج قيمة واحدة لكل صف من الاستعلام الأساسي لذا فهي تبسط الاستعلامات قدر الإمكان

الاستعلامات المتداخلة

وهو استعلام داخل استعلام آخر ويتم استخدام نتيجة استعلام الداخلي بواسطة الاستعلام الخارجي

:أدوات تحليل البيانات

لغة البرمجة النموذجية : SQL

لإجراء البرمجة المستخدمة للتواصل مع قواعد البيانات العلائقية، كما ولها دور رئيسي في استرجاع الملومات المطلوبة

: بايثون

لغة برمجة متعددة الاستخدامات، تلقى رواجاً كبيراً في مجال التكنولوجيا والبرمجة ولا يمكن لأي محلل بيانات الاستغناء عنها، تعتمد في مبدأ عملها على قابلية القراءة لذا لا تصنف ضمن لغات البرمجة المعقدة، تضم عدد كبير من المكتبات المتنوعة وفق متطلبات المهمة المراد تنفيذها في عمليات التحليل المختلفة

: R لغة

لا تختلف مهامها وميزاتها كثيراً عن بايثون إلا أنها متخصصة في إجراء عمليات التحليل الإحصائي للبيانات

مايكروسوفت إكسل: البرامج الأشهر على مستوى العالم في مجال الجداول، يتمتع بميزات عديدة ومختلفة تتنوع بين الجدولة وتنفيذ العمليات الحسابية ووظائف الرسوم البيانية النموذجية لتحليل البيانات

: Tableau

وهو مخصص لإنشاء التصورات ولوحات المعلومات التفاعلية دون الحاجة إلى خبرة عالية في الترميز إذاً يعتبر الأداة الأمثل لتحليل البيانات التجارية

ختاماً

وضعنا بين يديك عزيزي القارئ

SQL كل ما يتعلق بلغة

فإن كنت ترى أن هناك معلومات لم نقم بذكرها فيما يتعلق بلغة البرمجة هذه شاركنا بها في التعليقات لنتبادل المعلومات ولتعم الاستفادة للجميع وشكراً

Advertisements

Data visualization using ChatGpt and Tableau

Advertisements

With the development of data analysis tools and software, users of Tableau visualizations can save time and effort by taking advantage of the integration between ChatGpt and Tableau, thus automating processing with more flexibility.

How is that done? This is what we will explain in our article today, let’s get started

As we mentioned, the process will be done using the ChatGPT application. What is the concept of this application?

We will not go into complex technical details that explain the mechanism of action of this application, as this is not our topic today, and we may devote a detailed explanation to it in the coming days, but what we are interested in explaining now is what serves the topic we are talking about, which is integration with Tableau functions

ChatGPT is a conversational bot based on artificial intelligence with its amazing capabilities in conducting conversations and interacting with questions and inquiries in a linguistic manner similar to the nature of human reaction and you can use it in a variety of functions and inquiries including data visualization which is the focus of our topic for this day

First we need to install the OpenAI API as a first step to start using ChatGBT and then authenticate our credentials using JavaScript and entering the following code:

Once this process is complete, we can use ChatGpt to create visualizations in Tableau

Why is ChatGPT integration important to Tableau functionality?

In short, the basic necessity of this integration process is that it allows answering the most difficult questions and inquiries in an easy way and in natural language, and through which we can Tableau visualize these answers

Also, through this integration process, we can create interactive dashboards that help users find solutions to their inquiries in a timely manner, and thus their ability to identify patterns in their data and outliers at high speed makes reaching sound decisions easier.

Now let’s learn how to integrate ChatGPT with Tableau

This is done by carrying out the following stages

Step 1: Connect Tableau to your data source

This is done by selecting the Connect button in the upper left corner of the Tableau interface and then selecting the data source

Step 2: Install and configure TabPy

TabPy is a Python package that allows us to use Python scripts in Tableau

First enter the following command

After completing the installation of TabPy, we proceed to configure it to work with Tableau, and this is done by running TabPy with the following command in the terminal

Step 3: Install and configure the ChatGPT API

The ChatGPT API is a REST interface

At this stage, we install and prepare the ChatGPT API, and to be able to interact with the ChatGPT pattern, we install the ChatGPT API, and this is done by entering the following command in the Terminal window

Then, we set up the authentication, and this is done by obtaining the API key through a subscription request in OpenAI, and then you go to set it up in Python by running the following command:

Advertisements

Create integration between ChatGPT and Tableau (Python)

After successfully completing the previous steps, it remains to create the ChatGPT integration with Tableau

This is done by following these steps:

Step 1: Choose a Python function that calls the CHatGPT API

ChatGPT’s function here is to return the response from the queries entered into it

This is what the following example shows

Step 2: Use TabPy to register a Python function

This means registering a Python function with TabPy to be used in Tableau by running the following command in the Terminal window

This will create a TabPy configuration file, open it and add the following lines:

Save the file, and to start TabPy run the following command:

Step 3: Use the Python function in Tableau

To do this, we open a new workbook in Tableau and do the following:

1. We drag the “Text” object into the control panel

2. Click on the text and choose “Edit text” and in the dialog box type the following formula:

3. Then click OK and the text edit box will close

4. Drag the Parameter object onto the Control Panel

5. In the “Create Parameter” dialog box, set the data type to “String” and choose “all” to the available values, and set the current value to “empty string”, then click OK.

6. On the Parameter object, right-click and select Show Parameter Control.

7. Type a query in “Input Text” and press Enter

8. It will display the reply from ChatGPT in a “text” object and then call ChatGPT and Tableau together

Merger may seem a tiring process at first, but doing it repeatedly, even on a small scale, will develop your skills and develop capabilities to process data in a flexible and fast manner, and help you to troubleshoot problems and address them more effectively than before.

Create visualizations:

Using ChatGpt:

The first thing we need to do is provide ChatGpt with the data to be visualized, and after it receives the data that we have given it to it via a group or by passing a table, it will create the visualization according to the requests assigned to it

See in this code inserted in JavaScript how we create a visualization

In the above code we use OpenAI API functions to generate a bar chart of sales by location

We enter this request into ChatGpt via the immediate variable, to create the visualization we use the client.completions.create function and at the end we can display the resulting visualization in Tableau which was previously stored in the message variable

customize the resulting perceptions

We can customize the resulting visualizations according to our requirements in terms of changing the visualization type, size and color style, and this is done by providing ChatGpt with additional parameters

We can do this by using the following code in JavaScript

And keep in mind that experimenting with different parameters is a powerful tool for creating engaging and innovative visuals

What we did in the previous code is we created a quarterly earnings line chart using blue

Then we entered our request into ChatGpt through the immediate variable

Then we selected the appropriate visualization style, so we have a line chart in blue color and size according to demand

Show the visuals in Tableau

And as a reminder.. All of the above stages and procedures are to create a visualization using ChatGpt

But you promised us in this article that we will show the visualization in Tableau

Well don’t worry we’re not done yet..let’s go

The first thing we have to do is copy the resulting visualization from the message variable and paste it into Tableau and this is done by implementing the following steps

• Create a new worksheet in Tableau

• Select “Text” from the “Marks” section.

• Paste the visualization copied from the message variable into the text box and adjust the size of the text box to fit the visualization

• Congratulations.. The visualization has finally appeared in Tableau

And at the end of our interview today, allow me to pre-empt things and gladly answer some questions that some of the readers are likely to have.

Question 1: Are there free versions of ChatGPT?

Answer: Yes, there are free versions, but although their uses are limited, they often suffice

Question 2: Can we integrate ChatGPT with visualization tools other than Tableau?

Answer: Yes, and this is done by following the same steps that we followed above

Question 3: Does ChatGPT give accurate answers?

Answer: Not only accurate answers, but very accurate in general, when the information is entered correctly

In the end, I hope that you have found valuable information in this article as a data analyst looking for permanent and continuous development in his work. A successful person, my friend, as you know, is the person who accomplishes his work accurately and as quickly as possible.

If you find the benefit, please share with friends and support us, and quickly join wonderful partners by following the blog. We are honored to have you with us.. Welcome.

Advertisements

Tableauو ChatGpt تصور البيانات باستخدام

Advertisements

مع تطور أدوات وبرامج تحليل البيانات أصبح بمقدور مستخدمي التصورات البيانية

Tableau على برنامج

توفير الوقت والجهد عن طريق الاستفادة من

Tableau و ChatGpt التكامل بين

وبالتالي أتمتة المعالجة بمرونة أكثر

كيف يتم ذلك؟ هذا ما سنوضحه في مقالنا اليوم، هيا لنبدأ

ChatGPT كما ذكرنا ستتم العملية بالاستعانة بتطبيق

ما هو مفهوم هذا التطبيق؟

لن ندخل في تفاصيل تقنية معقدة تشرح آلية عمل هذا التطبيق فليس هذا موضوعنا اليوم وربما نخصص له شرحاً تفصيلياً في القادم من الأيام وإنما ما يهمنا شرحه الآن هو ما يخدم الموضوع الذي نتحدث فيه

Tableau وهو التكامل مع وظائف

هو روبوت محادثة يعتمد على الذكاء الاصطناعي ChatGPT

ويمتاز بقدراته المذهلة في إجراء المحادثات والتفاعل مع الأسئلة والاستفسارات بطريقة لغوية طبيعة تشبه رد فعل الإنسان ويمكنك الاستعانة به في مجموعة متنوعة من الوظائف والاستفسارات بما فيها تصور البيانات التي هي محور موضوعنا لهذا اليوم

OpenAI API نحتاج في البداية إلى تثبيت

ChatGBT كخطوة أولى للشروع في استخدام

ثم مصادقة بيانات الدخول الخاصة بنا

JavaScript ويتم ذلك باستخدام

: وإدخال الكود التالي

وعند إتمام هذه العملية أصبح بمقدورنا

Tableau لإنشاء تصورات في ChatGpt استخدام

؟Tableau مع وظائف ChatGPT ما أهمية تكامل

باختصار تمكن الضرورة الأساسية لعملية الدمج هذه بأنها تتيح الإجابة على أصعب الأسئلة والاستفسارات بطريقة سهلة وبلغة طبيعية

من تصور هذه الإجابات Tableau ومن خلالها يمكننا

كما ويمكننا من خلال عملية الدمج هذه إنشاء لوحات معلومات تفاعلية تساعد المستخدمين في إيجاد الحلول على استفساراتهم في زمن مناسب وبالتالي قدرتهم على تحديد أنماط بياناتهم والقيم المتطرفة بسرعة عالية تجعل الوصول إلى قرارات سليمة أمراً أكثر سهولة

Tableau مع ChatGPT لنتعرف الآن على كيفية الدمج

يتم ذلك بتنفيذ المراحل التالية

بمصدر بياناتك Tableau المرحلة الأولى: ربط

ويتم ذلك بتحديد الزر “اتصال” في الزاوية اليسرى العلوية

Tableau من واجهة

ثم تحديد مصدر البيانات

TabPy المرحلة الثانية: تثبيت وتجهيز

Python هي حزمة TabPy

Tableau النصية في Python تتيح لنا استخدام تعليمات

أولاً أدخل الأمر التالي

TabPy وبعد الانتهاء من تثبيت

Tableau نتجه إلى تهيئته للعمل مع

TabPy ويتم ذلك بتشغيل

terminal بواسطة الأمر التالي في

ChatGPT API المرحلة الثالثة: تثبيت وتجهيز

REST هي واجهة ChatGPT واجهة برمجة تطبيقات

نقوم في هذه المرحلة بتثبيت وتجهيز واجهة

ChatGPT برمجة تطبيقات

ChatGPT ولنتمكن من إحداث التفاعل مع نمط

ChatGPT API نقوم بتثبيت

ويتم ذلك عن طريق إدخال الأمر التالي

Terminal window في

ثم بعد ذلك نقوم إعداد المصادقة

API ويتم ذلك بالحصول على مفتاح

OpenAI من خلال طلب اشتراك في

Python لتنتقل بعدها إلى إعداده في

:بواسطة تشغيل الأمر التالي

Advertisements

( بايثون )Tableau و ChatGPT إنشاء التكامل بين

بعد إنجاز المراحل السابقة بنجاح

Tableau مع ChatGPT يبقى أمامنا إنشاء تكامل

:ويتم ذلك باتباع الخطوات التالية

:الخطوة الأولى

ChatGPT API اختيار دالة بايثون التي تستدعي

هنا إعادة الاستجابة ChatGPT وظيفة

من الاستعلامات المدخلة إليها  

وهذا ما يوضحه المثال التالي

TabPy الخطوة الثانية : استخدام

في تسجيل وظيفة بايثون

TabPy وهذا يعني تسجيل دالة بايثون مع

Tableau ليتم استعمالها في

   Terminal window ويتم ذلك بتشغيل الأمر التالي في

TabPy وهنا سيتشكل ملف تكوين لـ

: افتحه وأضف الأسطر التالية

TabPy قم بحفظ الملف، ولبدء

عليك تشغيل الأمر التالي

Tableau الخطوة الثالثة: استخدم دالة بايثون في

Tableau جديد في workbook  وللقيام بذلك نفتح

ونقوم بالإجراءات التالية

إلى لوحة التحكم “Text” نسحب الكائن *

“Edit text” انقر فوق النص واختر *

وفي صندوق الحوار اكتب الصيغة التالية

ثم انقر فوق “موافق” فيُغلَق صندوق تحرير النص *

إلى لوحة التحكم “Parameter” اسحب الكائن *

 “Create Parameter” في صندوق حوار *

 “all” واختر “String” اضبط نوع البيانات على  

على القيم المتاحة واضبط القيمة الحالية

ثم انقر الأمر موافق “empty string” على

انقر بالزر الأيمن للماوس “Parameter” على الكائن *

“Show Parameter Control” واختر

Enter واضغط “Input Text” اكتب استعلاماً في *

في كائن “نص” ChatGPT سيعرض الرد من *

معاً Tableauو ChatGPT ثم يتم استدعاء

قد يبدو الدمج عملية متعبة في البداية ولكن تنفيذها بشكل متكرر ولو على نطاق ضيق سينمي عندك المهارات ويطور القدرات على معالجة البيانات بشكل مرن وسريع ويساعدك على استكشاف المشكلات ومعالجتها بفاعليها أكبر من ذي قبل

: إنشـــــــــــاء التصورات

:ChatGpt باستخدام

ChatGpt أول ما نحتاج إليه هو تزويد

بالبيانات المراد تصورها، وبعد تلقيه البيانات التي لقناه إياها عن طريق مجموعة أو عن طريق تمرير جدول سيقوم بإنشاء التصور وفق الطلبات الموكلة إليه

JavaScript شاهد في هذا الكود المدخل في

كيف نقوم بإنشاء تصور

OpenAI API في الكود السابق نستعين بوظائف

لتوليد مخطط شريطي للمبيعات حسب الموقع

ChatGpt نُدخِل هذا الطلب في

عبر المتغير الفوري، ولإنشاء التصور

client.completions.create نستخدم وظيفة

Tableau وفي النهاية يمكننا عرض التصور الناتج في

والذي كان قد خزن مسبقاً في متغير الرسالة

تغيير خصائص التصورات الناتجة

يمكننا تخصيص التصورات الناتجة وفق متطلباتنا من حيث تغيير نوع التصور وحجمه ونمط الألوان

إضافية parameters بـ ChatGpt ويتم ذلك عن طريق تزويد

JavaScript ويمكننا تنفيذ ذلك عن طريق استخدام الكود التالي في

مختلفة parameters وتذكر دائماً أن تجريب

يعتبر أداة قوية لتحصل على بيانات مرئية جذابة ومبتكرة

ما فعلناه في الكود السابق هو أننا قمنا بإنشاء مخطط خطي للأرباح بمقدار ربع سنة باستخدام اللون الأزرق

من خلال المتغير الفوري ChatGpt ثم أدخلنا طلبنا في

ثم حددنا نمط التصور المناسب فنتج لدينا مخطط خطي بلون أزرق وبحجم وفق الطلب

Tableau إظهار المرئيات في

وللتذكير.. كل ما سبق من مراحل وإجراءات

ChatGpt هي إنشاء تصور باستخدام

أول ما علينا فعله هو نسخ التصور الناتج من متغير الرسالة

ويتم ذلك بتنفيذ المراحل التالية Tableau ولصقه في

Tableau أنشئ ورقة عمل جديدة في *

“Marks” من جزء “Text” اختر *

الصق التصور المنسوخ من متغير الرسالة في مربع النص واضبط حجم مربع النص ليناسب التصور *

Tableau تهانينا .. لقد ظهر التصور أخيراً في *

وفي نهاية مالقتنا اليوم اسمحوا لي أن استبق الأمور وأجيب بكل سرور عن بعض الأسئلة التي على الأرجح قد تتبادر إلى أذهان بعض القراء

؟ChatGPT السؤال الأول: هل يوجد نسخ مجانية من

الجواب: نعم يوجد إصدارات مجانية ولكنها ورغم أن استخداماتها محدودة ولكنها غالباً ما تفي بالغرض

ChatGPT السؤال الثاني: هل نستطيع دمج

؟Tableau مع أدوات تصور أخرى غير

الجواب: نعم ويتم ذلك باتباع نفس الخطوات التي اتبعناها آنفاً

أجوبة دقيقة؟ ChatGPT السؤال الثالث: هل يعطي

الجواب: ليست أجوبة دقة فحسب، بل بمنتهى الدقة بشكل عام وذلك عند إدخال المعلومات بشكل صحيح

وفي النهاية آمل أن تكون قد وجدت في هذا المقال معلومات قيمة كمحلل بيانات يبحث عن التطور الدائم والمستمر في عمله فالشخص الناجح يا صديقي كما تعلم هو الشخص الذي ينجز عمله بدقة وبأسرع وقت ممكن

فإن وجدت الفائدة أرجو أن تقوم بالمشاركة بين الأصدقاء وتقديم الدعم لنا وسارع بالالتحاق بشركاء رائعين عن طريق متابعة المدونة فنحن نتشرف بوجودك معنا.. أهلاً بك  

Advertisements

Best For Qualitative Data Analysis: ATLAS.ti

tenth tool

Advertisements

The ideal tool for text finding and sentiment analysis

Experience Level : Beginner to Intermediate

This tool is specifically designed to deal with qualitative data such as interviews, available survey questions and comments on social media. This tool also allows to perform complex functions such as sentiment analysis, especially for people who do not have experience in dealing with programming techniques.

ATLAS.ti program has a number of features, including:

• Sentiment Analysis

• wordlist

• Word cloud

• Synonyms

• Entity recognition

• Display Features

• Find texts

• Sorting by name, adjective, and others.

This tool enables its users to upload images and videos for multimedia analytics and works in full compliance with geo-data and maps.

However, its main drawback is that sentiment analysis is available in only four languages: German, English, Spanish and Portuguese, in addition to its monthly subscription starting at $35 for non-commercial use.

Some examples of ATLAS.ti usage:

1- This idea is based on observing the feelings of people who are subject to a social experience after watching videos expressing those feelings by writing or drawing that determines their impression and behavior and the extent of the impact of this viewing, so ATLAS.ti is the most appropriate tool to do this task to the fullest.

2- Organizing data: This tool can easily be relied on to find texts without resorting to programming, especially for people who do not prefer dealing with the Python language, as if you need to find some views of recordings from a series of personal interviews you have previously conducted.

We conclude from the above:

Data analysts usually prefer to use several tools to deal with data of different content and content. Each tool has a specific task within an integrated data analysis system, some of which need to deal with Excel, ATLAS.ti and SPSS as uses for data analysis related to social sciences, and some need to deal with Excel Polymer Search and Akkio, as is the case with digital marketers and what distinguishes dealing with all these tools is the availability of free trial versions in case the data analyst is not able to accurately determine the type of tool to use for a pattern of data.

Advertisements
Advertisements
Advertisements

Cheaper Solution: Power BI

ninth tool

Advertisements

Ideal for creating interactive graphs, dashboards, and data processing.

Experience Level: Beginner to Intermediate

An alternative to Tableau but has the advantage of using the BI package with the widest options for data visualization and charting

Also, it is not necessary to use code, but it gives the option to use the relatively powerful DAX language that programmers who use code.

In addition, it has flexibility in data processing and cleaning, easy compatibility with other Microsoft products, and compatibility with working with R & Python to build models.

A Power BI subscription starts at $9.99 per month, so it’s less expensive than other programs.

Thus, we conclude that the two tools Tableau and Power BI are suitable for business intelligence, but what distinguishes Power BI is that it is better for data processing and less costly, as mentioned earlier.

Advertisements
Advertisements
Advertisements

Best For Business Intelligence & Reporting: Tableau

Eighth Tool

Advertisements

The ideal tool for creating dashboards, interactive charts, and master data cleaning

Experience Level : Beginner to Intermediate.

Tableau is the perfect choice for designing elegant, high-tech infographics and is characterized by its ability to create information control panels without the need to use codes. It allows data analysts to send that data to people who are inexperienced in dealing with technology. It also allows them, through interactive control panels, to easily follow that information. complete.

The disadvantages of this program are that, despite its ability to analyze data, it does not have the efficiency to process random data that requires a thorough cleaning, which is often Python and R are the most appropriate options for this task, in addition, it often targets large companies, as its prices start from 70 dollars per month.

To illustrate the use of Tableau features in work, for example, every data analyst or data scientist in general sends results and reports to executives, and those reports must be attractive, interactive, customizable, and have the flexibility of access to others, and with the BI feature, you can create charts and visualizations with its ability to easily Join multiple tables, detail and analyze data with complete flexibility by dragging and dropping.

Tableau saves a lot of time and effort in creating interactive control panels, thus avoiding dealing with complex programming and wasting time as in Matplotlib / Seaborn / Plotly to get accurate results quickly.

Advertisements
Advertisements
Advertisements

Best For Science & Academia: SPSS

Seventh tool

Advertisements

Optimum tool for linear and logistic regression, cluster analysis, t-tests, MANOVA, ANOVA

Experience Level: Intermediate

This tool is used by professionals in the social sciences and education, as well as in government, retail and market studies, and its main function is to point and click.

The advantage of SPSS is that it allows a variety of data types to be contained by a variety of different regression types and tests, so this tool requires its users to be familiar with highly detailed hypothesis-testing statistics such as ANOVAs and MANOVAs.

The main disadvantage of SPSS is its high cost, starting at $99 per month.

Practical examples of using SPSS:

data samples:

Let’s say that a researcher in psychology and sociology is conducting scientific research that requires studying samples of certain segments of people in a society. You should have two groups, an experimental group and a control group. The t-test allows knowing that there is a statistical difference between the two groups based on the p-value that you specify.

Multivariate analysis:

This type of analysis sheds light on the difference between groups through several variables at the same time, as in our previous example. Studying a particular segment gives more accurate results for the study, taking into account the age and ethnic differences, etc.

We conclude from the study of this tool that its users prefer it in their reliance on statistical indications taken from data analysis in their science and research that they specialize in. It is an intermediate element between beginner tools such as: Polymer Search and Excel and more advanced programming languages ​​such as Python and R

Advertisements
Advertisements
Advertisements

Best For Advanced Statistical Analysis: R

Sixth tool

Advertisements

The ideal tool in advanced academic statistical analysis, big data and machine learning

Experience Level: Advanced

R program is characterized by its efficiency in conducting very advanced statistical analysis (academic level stuff), especially exploratory data analysis (EDA), and this is what makes it superior to Python, although they have almost the same functional characteristics, especially in the processing of large data

R tool is designed to perform advanced-level statistical analysis with high accuracy. It is known that tools that are specific to specific functions can perform those tasks more accurately than those tools that perform general functions.

Compared to Python, for example, doing a common analysis for R is simple and easy. As for Python, this task needs to find the right library and know how it works, then write codes and waste time and effort doing actions that you don’t need to do in R.

In the end, we conclude that the R and Python tools share almost the same functional characteristics with the advantage of Python in building production applications, but it does not have the efficiency in doing advanced academic computations compared to R .

Advertisements
Advertisements
Advertisements

Python : Best For Machine Learning & Automation – Fifth tool

Advertisements

Optimized tool: for dealing with big data, machine learning, automation and application development.

Experience Level: Advanced

Python is the most widely used programming language among data scientists and analysts because it is open source, contains multiple and diverse libraries, is characterized by its speed of performance, and is written in C. This means that it is possible to store and process bytes and bits that require a lot of time faster and easier.

As we mentioned earlier, the Python language is open source and contains 200,000 packages that include packages used for data analysis such as Plotly, Seaborn and Matplotlib. You can also call libraries in any field of data analysis.

Key Features of Python in Data Analysis, Machine Learning, and Automation:

• Great ease in dealing with small data and in performing complex calculations.

• Super speed in the processing of huge data.

• Save a lot of time in automating information.

Despite all these advantages that Python has, it is not without some drawbacks, most notably its ineffectiveness for mobile applications on the one hand, and its learning period to serve the purpose for which it is used, which is considered long compared to other tools on the other hand.

Python application examples:

Automation : You can do the analysis of several groups of data using several analysis tools such as Excel, but this requires a great deal of time and effort. The analysis then will be manually for each group separately, but the analysis of the same groups using Python will be more flexible and fast, and with 15 lines of code that will accomplish the task perfectly. Face .

Cleaning data : If you lose a sponsored link from a TV show, for example, you can restore those links by discovering those links in the first stage and then writing code to restore links as a second stage.

Exploratory data analysis :

You can understand the visualization and distribution of data by building an interactive model of your data in simple code in a short time using the Python module Pandas Profiling.

Thus, we conclude that these characteristics of the Python language made it the most widely used and desired language by data analysts and the best in dealing with data science and its branches of science and technology.

Advertisements
Advertisements
Advertisements

Best For Querying Big Data: SQL

Fourth tool

Advertisements

The ultimate tool for checking and processing big data

Experience Level: Intermediate

SQL is a programming language for querying and manipulating data

It performs almost the same tasks as Excel, but it is superior to it in its ability to deal with large data, and thus shortens a great deal of data processing time compared to Excel, in addition to its ability to store data in small files.

However, the only aspect in which Excel excels over SQL is the ease of learning and handling of the main tasks.

The main function of SQL tool is to edit big data

For example, you have a very large number of posts on Instagram and you want to make edits or sort those posts with easy procedures and simple instructions.

It has an effective role in joining data sets together. You can rely on SQL to combine several spreadsheet files containing a number of fields in one file with the utmost smoothness and flexibility, avoiding complications, difficulties and wasting time that you face to perform this task in Excel.

Advertisements
Advertisements
Advertisements

Third Tool: Building Prediction Models: Akkio

Advertisements

The ideal tool for predictive analytics, sales and marketing

The principle of this tool is based on artificial intelligence. After you enter your data on Akkio, select the variable you want to predict, and Akkio will build a neural network around this variable, using 80% as training data and 20% for validation.

The most important thing about Akkio is that it is not limited to prediction but also classifies the results accurately and with a few clicks in simple steps you can publish the model in a web application.

However, its disadvantages are that it is limited to dealing with table data and does not support the discovery of image and audio files, and its price starts at $50 per month.

To illustrate how to invest this tool to serve your business and projects, let’s say for example that you run an online store and email promotions, you use Akkio to create forecast models that you sell to customers so it can be said that this tool is good for users who do not have technical experience to get started with predictive analytics.

Advertisements
Advertisements
Advertisements

The Second Tool: Polymer Research

The Second Tool:

Advertisements

This tool is considered one of the easiest data analysis tools but the best for analyzing and displaying sales and marketing data and practical in business intelligence techniques

Experience Level: Beginner

You can perform a set of tasks in the analysis by entering your data on the site of the tool, which in turn will convert that data into an interactive web application, and these tasks include:

1- interactive pivot tables:

You can get questions about the data in a smooth and fast way and sort the entered data and output by clicking on click on the instructions for this process.

2- Automatic explanation:

Several options are presented to you about the data to ensure that you get the best results, such as suggesting summaries and showing anomalies, such as providing the optimal options for an effective digital marketing strategy according to certain data that determine the size of the currency, the target group, and others.

3- Interactive visualizations:

This tool allows its users to find several ideas and features about data and create interactive dashboards by presenting many types of charts, whether strip, bubble, scattered and heat maps, and the fact that these visualizations are interactive, which makes dealing with them easier and more accurate, especially in terms of sorting and filtering data.

Among the advantages of this performance is the discovery of matrices and their automatic division, as well as the presence of features and analysis techniques that cannot be performed by other programs such as Excel.

Despite all the advantages of this tool, it is not without some drawbacks, the most prominent of which is its inability to deal with large data and its loss to give more accurate results when dealing with more complex analysis, as it does not provide several types of charts and graphs.

This tool provides digital marketing users with several advantages as mentioned above, for example, this tool can act on your behalf in running Facebook ads or any PPC campaign and finding the most effective groups.

After you enter the data of your search for the target group of the audience, it sorts the search results and reviews them for you from best to worst and provides information on the secondary values ​​resulting from that search process.

Business Intelligence: Polymer turns your spreadsheet into a dashboard where you can create infographics that you share with executives or clients via a URL that’s easy and flexible to access.

Therefore, this tool is simply considered optimal for non-technical people and for beginners because of the features and techniques that it offers with high efficiency in accomplishing the required tasks.

Advertisements

Advertisements
Advertisements

First Tool: Excel Tool

Advertisements

Let us start with the first

  • Excel Tool:

Excel is ideal for processing graphs and charts, and for analyzing and storing data; you can replace it as well if it is not available in your workplace with google spreadsheets because of the great similarity between them. Excel allows you to create charts and graphs very smoothly, providing several types of charts, including pie charts, box charts, bar charts, scatter charts, and other forms of charts, so either you’re a beginner or intermediate could use this program and take advantage of its capabilities.

You can also customize the colors according to what your work requires, in addition to various options such as controlling the size to display the results on the web with appropriate accuracy.

Excel provides a set of capabilities and techniques that allow you to control and change the data as you want, which makes Excel the ideal program for data analysis through several utilities, filters and mathematical operations within the program.

The circle of benefit from the program expands by learning the original programming language of the program, which is VBA, and that is recommended for those who spend a long time working on the program.

However, the main problem of Excel is that it is unable to process and analyze large and more complex data, and it does not favor its use in statistical analysis.

  • Here are samples that illustrate some of the features of working on Excel:

Data manipulation:

 Excel contains several options for dealing with specific parts of the data, such as deleting specific positions of characters in each cell, or dividing a column into several columns, and so on.

Calculations:

Let’s say you have e-commerce data about sales of certain products and you always in need for calculations. So, Excel gives you several options to perform calculations on that data.

Bivariate Analysis:

Excel could be helpful in that case as it offers all the types of charts you need to analyze univariate or bivariate structured data.

Pivot Tables:

This tool enables you to create quick and easy pivot tables to get answers to common questions.

As a conclusion, Excel is an important tool with techniques and options that serve data analysts in implementing all that is necessary for their projects.

Advertisements
Advertisements
Advertisements

Introduction For Data Analysis Tools

Advertisements

Data analysis tools of all kinds are designed to serve the purpose of their use, but the difficulty of choosing the most appropriate tool lies in the similar capabilities between some tools, so we will discuss the selection of the best option for the appropriate tool for the type of analysis you are doing, and we will discuss the most commonly used by beginners and professionals in data science.

Factors that help you reach the selection of the appropriate tool for data analysis:

• Determining the budget and the size of the work cadre in your company.

• Knowing the volume of data that we will analyze.

• Knowing the type of data to be analyzed and whether it needs classification or not.

• Knowing if the analysis require certain types of perceptions?

• Determining the function of the entity we are dealing with.

Content list:

We will mention the best and most appropriate option for each of the analysis techniques:

• For sciences and academia: SPSS

• For qualitative data analysis: ATLAS.ti

• To query big data: SQL

• To create graphs and edit data: Excel

• For non-technical users: Polymer Search

• To build prediction models: Akkio

• For automation and machine learning: Python

• For advanced statistical analysis: R

• Reporting and Intelligence Techniques: Tableau

• A cheaper alternative to intelligence techniques: Power BI

We will discuss later each of these options separately.

Advertisements
Advertisements
Advertisements