


If you’ve ever stared at rows of messy data in a CSV file and felt overwhelmed, you’re not alone. Like many newcomers to data analysis, I once struggled with cleaning, transforming, and analyzing datasets—until I discovered the true power of Pandas, Python’s go-to data manipulation library. In this article, I’ll walk you through the data workflow I wish I had known when I first started. Whether you’re a beginner or someone who’s used Pandas but still feels stuck, this guide will make your data tasks smoother and more intuitive.
1. Start with the Right Mindset: Think in DataFrames
When I first learned Pandas, I treated it like a spreadsheet with some coding on top. Big mistake. I would manipulate lists or dictionaries and use Pandas only occasionally. It wasn’t until I fully embraced the DataFrame as my primary data structure that things started making sense.
The moment everything clicked was when I started thinking in DataFrames—as in, blocks of data that you manipulate with chainable methods. Imagine each operation as a transformation on a flowing river of data, rather than discrete manual edits. This mental shift makes complex operations easier to reason through and structure logically.
Pro Tip: Always load your data into a DataFrame, not a list, dict, or array, unless you absolutely have to.

2. Cleaning is Not Optional (But It’s Easier Than You Think)
Data rarely comes clean. It usually arrives with missing values, duplicates, inconsistent types, or poorly named columns. If you skip this step, you’ll run into problems down the line when performing analysis.
The workflow I now follow (and recommend) is:
- Check data types to understand what you’re dealing with
- Handle missing values to prevent errors
- Remove duplicates to avoid skewed results
- Normalize column names for readability and easier access
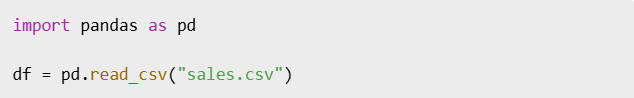
Pandas makes this easy and consistent, especially once you get familiar with the basic syntax.
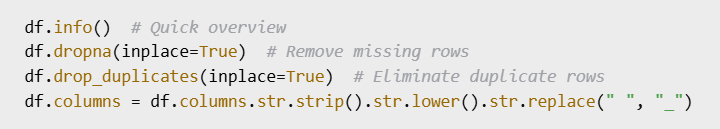
These simple commands can clean up even the messiest CSV files.
3. Use Chaining for Readable, Efficient Code3. Use Chaining for Readable, Efficient Code
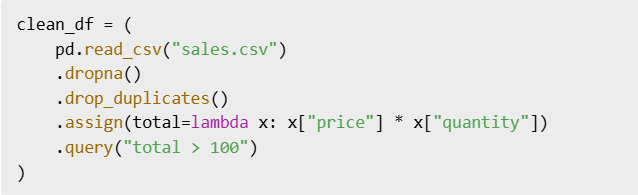
Instead of assigning intermediate results to new variables and cluttering your notebook or script, Pandas allows for method chaining. This style improves both readability and maintainability of your code.
When you chain methods, each step is like a filter or transformer in a pipeline. You can clearly see what’s happening to the data at each point. It reduces the cognitive load and removes the need for multiple temporary variables.

By chaining, your logic stays close together and easy to trace.
4. Master the Power Trio: groupby(), agg(), and pivot_table()
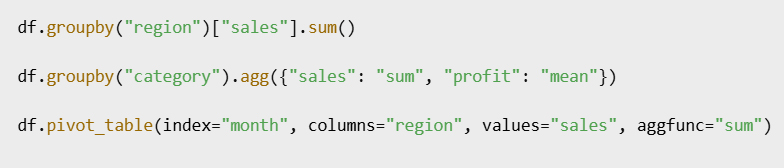
Once your data is clean, analysis becomes a breeze if you master these three powerful tools: groupby(), agg(), and pivot_table(). They are the backbone of summary statistics, trend spotting, and dimensional analysis.
- GroupBy lets you split your data into groups and apply computations on each group.
- Agg lets you define multiple aggregation functions like sum, mean, count, etc.
- Pivot tables reshape your data for cross-comparisons across categories.
These are key steps to go from raw data to valuable insight.
You’ll use these in nearly every project, so it’s worth getting comfortable with them early.
5. Visualize Early, Not Late
Pandas integrates smoothly with Matplotlib and Seaborn, two of the most popular Python plotting libraries. Rather than waiting until the end of your analysis, it’s often smarter to visualize as you go.
Early plotting helps catch outliers, understand distributions, and spot anomalies or trends. You don’t need fancy dashboards—even a simple histogram or line chart can provide key insights that numbers alone can’t.
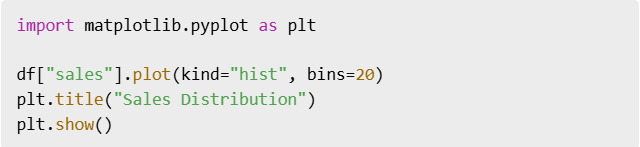
Making visualization part of your standard workflow will greatly improve your understanding of the data.
6. Export Your Final Output Like a Pro
After cleaning, analyzing, and visualizing your data, you need to share or store the results. Pandas makes it effortless to export your DataFrame in various formats.
Exporting your data isn’t just about saving your work—it’s about creating reusable, shareable assets for collaborators or clients. Whether it’s a clean CSV or a styled Excel file, always include this final step.
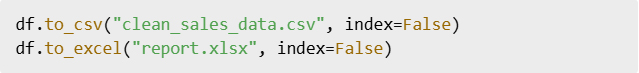
Don’t let your insights live only in your notebook—get them out there.
7. Automate Repetitive Tasks
If you notice you’re repeating the same steps across projects or datasets, it’s time to automate. This can be as simple as creating a reusable function or as advanced as building an entire pipeline script.
Functions help encapsulate logic and make your code modular. It also makes onboarding easier when sharing your work with teammates or revisiting it months later.
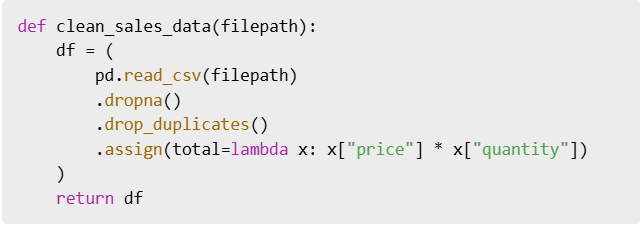
Start small, and automate more as you go.
Conclusion: Pandas Is a Superpower, Once You Master the Flow
At first, Pandas felt clunky to me—too many functions, too many options. But once I embraced the data workflow mindset—clean, chain, group, visualize, export—it all made sense.
If you’re new to Pandas, don’t try to memorize every method. Instead, focus on the workflow. Build your foundation around practical tasks, and Pandas will become your favorite tool in no time.
Bonus Cheat Sheet: My Go-To Workflow
read_csv()df.info(),df.describe()dropna(),drop_duplicates()assign(),query()groupby(),agg(),pivot_table()plot()to_csv()orto_excel()
طريقة عملي مع البيانات إلى الأبد Pandas كيف غيّرت

إذا سبق لك أن حدقت في صفوف
CSV من البيانات غير المرتبة في ملف
وشعرت بالإرهاق فأنت لست وحدك، وكالعديد من المبتدئين في تحليل البيانات واجهتُ صعوبةً في تنظيف مجموعات البيانات وتحويلها وتحليلها
Pandas حتى اكتشفتُ القوة الحقيقية لـ
مكتبة بايثون المُفضلة لمعالجة البيانات، وفي هذه المقالة سأشرح لك سير عمل البيانات الذي كنت أتمنى لو عرفته عندما بدأتُ
Pandas سواءً كنتَ مبتدئاً أو شخصاً استخدم
ولكنه لا يزال يشعر بالتعثر سيجعل هذا الدليل مهامك المتعلقة بالبيانات أكثر سلاسةً وبديهية
1. DataFrames ابدأ بعقلية صحيحة: فكّر في
لأول مرة Pandas عندما تعلمتُ
تعاملتُ معه كجدول بيانات مُضاف إليه بعض الأكواد البرمجية، وهذا كان خطأً فادحاً، إذ كنتُ أتعامل مع القوائم أو القواميس
من حين لآخر فقط Pandas وأستخدم
DataFrame ولم أبدأ في فهم الأمور إلا بعد أن اعتمدتُ
بالكامل كهيكل بياناتي الأساسي، كانت اللحظة التي أدركت فيها كل شيء هي اللحظة التي بدأت فيها التفكير في أطر البيانات – أي كتل البيانات التي تُعالج بطرق متسلسلة، تخيل كل عملية كتحويل على سيل متدفق من البيانات بدلاً من عمليات التحرير اليدوية المنفصلة، هذا التحول الفكري يُسهّل فهم العمليات المعقدة وهيكلتها منطقياً
DataFream نصيحة احترافية: حمّل بياناتك دائماً في
وليس قائمة أو قاموس أو مصفوفة إلا إذا كنتَ مضطراً لذلك
2. التنظيف ليس اختيارياً (ولكنه أسهل مما تظن)
نادراً ما تكون البيانات سليمة، فعادةً ما تصل بقيم ناقصة أو بيانات مكررة أو أنواع غير متسقة أو أعمدة بأسماء غير صحيحة، فإذا تخطيتَ هذه الخطوة فستواجه مشاكل لاحقاً عند إجراء التحليل
:سير العمل الذي أتبعه الآن (وأوصي به) هو
التحقق من أنواع البيانات لفهم ما تتعامل معه *
معالجة القيم المفقودة لتجنب الأخطاء *
إزالة التكرارات لتجنب النتائج غير الدقيقة *
توحيد أسماء الأعمدة لسهولة القراءة وسهولة الوصول *
هذا الأمر ويجعله متسقاً Pandas يُسهّل
خاصةً بعد التعود على أساسيات بناء الجملة

يمكن لهذه الأوامر البسيطة
الأكثر فوضوية CSV تنظيف حتى ملفات
3. استخدم التسلسل للحصول على كود برمجي سهل القراءة وفعال
بدلاً من تعيين نتائج وسيطة لمتغيرات جديدة وإرباك دفتر ملاحظاتك أو نصك البرمجي
بتسلسل الدوال Pandas يسمح
إذ يُحسّن هذا الأسلوب من سهولة قراءة الكود وصيانته
عند تسلسل الدوال تكون كل خطوة بمثابة مُرشِّح أو مُحوِّل في خط أنابيب، فيمكنك رؤية ما يحدث للبيانات بوضوح في كل نقطة، فيُقلل هذا من العبء المعرفي ويُلغي الحاجة إلى متغيرات مؤقتة متعددة
من خلال التسلسل يبقى منطقك مترابطاً وسهل التتبع
groupby() و agg() و pivot_table() :٤. إتقان الأدوات الثلاثة القوية
:بمجرد أن تصبح بياناتك واضحة سيصبح التحليل سهلاً للغاية إذا أتقنت هذه الأدوات الثلاث القوية
groupby() و agg() و pivot_table()
تُعدّ هذه الأدوات أساساً لإحصاءات التلخيص ورصد الاتجاهات وتحليل الأبعاد
تقسيم بياناتك إلى مجموعات GroupBy تتيح لك *
وتطبيق الحسابات على كل مجموعة
تعريف دوال تجميع متعددة Agg تتيح لك *
مثل المجموع والمتوسط والعدد.. إلخ
تشكيل بياناتك Pivot تُعيد جداول *
لإجراء مقارنات متقاطعة عبر الفئات
هذه خطوات أساسية للانتقال من البيانات الخام إلى رؤى قيّمة

ستستخدم هذه الأدوات في كل مشروع تقريباً لذا يُنصح بالتدرب عليها مُبكراً
٥. التصور مُبكراً لا مُتأخراً
Seabornو Matplotlib بسلاسة مع Pandas يتكامل
وهما من أشهر مكتبات رسم بايثون، فبدلاً من الانتظار حتى نهاية التحليل غالباً ما يكون من الأذكى التصور أثناء العمل، ويساعد التخطيط المبكر على رصد القيم الشاذة وفهم التوزيعات ورصد الشذوذ أو الاتجاهات، فلستَ بحاجة إلى لوحات معلومات معقدة – حتى مُدرج تكراري أو مخطط خطي بسيط يُمكنه توفير رؤى رئيسية لا تستطيع الأرقام وحدها توفيرها

إن جعل التصور جزءاً من سير عملك القياسي سيُحسّن فهمك للبيانات بشكل كبير
6. تصدير مُخرجاتك النهائية باحتراف
بعد تنظيف بياناتك وتحليلها وتصورها ستحتاج إلى مشاركة النتائج أو تخزينها
تصدير إطار البيانات الخاص بك بتنسيقات مُختلفة Pandas يُسهّل
لا يقتصر تصدير بياناتك على حفظ عملك فحسب بل يشمل إنشاء أصول قابلة لإعادة الاستخدام والمشاركة للمتعاونين أو العملاء
Excel نظيفاً أو ملف CSV فسواءً كان ملف
مُنسقاً احرص دائماً على تضمين هذه الخطوة الأخيرة

لا تدع رؤاك تُحفظ في دفتر ملاحظاتك فقط انشرها
٧. أتمتة المهام المتكررة
إذا لاحظتَ أنك تُكرر نفس الخطوات في المشاريع أو مجموعات البيانات فقد حان وقت الأتمتة، فقد يكون هذا بسيطاً كإنشاء دالة قابلة لإعادة الاستخدام أو متقدماً كإنشاء نص برمجي كامل لخط أنابيب
تساعد الدوال على تغليف المنطق وجعل شيفرتك معيارية، كما أنها تُسهّل عملية الإدماج عند مشاركة عملك مع زملائك في الفريق أو إعادة النظر فيه بعد أشهر

ابدأ بخطوات صغيرة وأتمت المزيد مع مرور الوقت
الخلاصة: باندا قوة خارقة بمجرد إتقانها
في البداية شعرتُ أن باندا غير عملي فوظائفه وخياراته كثيرة جداً، لكن بمجرد أن اتبعتُ عقلية سير عمل البيانات : التنظيف والتسلسل والتجميع والتصور ثم التصدير أصبح كل شيء منطقياً
إذا كنتَ جديداً على باندا فلا تحاول حفظ جميع الطرق، وبدلاً من ذلك ركّز على سير العمل وابنِ أساسك حول المهام العملية وسيصبح باندا أداتك المفضلة في وقت قصير
: سير العمل المفضل لدي
read_csv()df.info(),df.describe()dropna(),drop_duplicates()assign(),query()groupby(),agg(),pivot_table()plot()to_csv()orto_excel()
