


Introduction
Analyzing sales data from a coffee shop provides valuable insights that can inform decision-making processes, enhance customer experiences, and improve profitability.
This article outlines a comprehensive data analysis project for a coffee shop, detailing the steps taken to gather, process, and analyze sales data.
Objectives
The primary objectives of this data analysis project include:
- Understanding sales trends over time.
- Identifying the most popular products.
- Analyzing sales by time of day and day of the week.
- Evaluating the impact of promotions.
- Understanding customer preferences and behavior.
Data Collection
Data Sources
Data for this project can be collected from various sources, including:
- Point-of-Sale (POS) Systems: Transaction data, including product, quantity, price, time, and date.
- Customer Surveys: Feedback on products, service quality, and preferences.
- Loyalty Programs: Data on repeat customers and their purchasing habits.
Sample Data
For simplicity, consider the following sample data structure from the POS system:
| Transaction_ID | Date | Time | Product | Quantity | Price | Promotion |
| 1 | 2024-07-01 | 08:05 | Latte | 2 | 5.00 | None |
| 2 | 2024-07-01 | 08:15 | Espresso | 1 | 3.00 | None |
| 3 | 2024-07-01 | 08:45 | Cappuccino | 1 | 4.50 | 10% Off |
| … | … | … | … | … | … | … |
Data Processing
Data Cleaning
Data cleaning involves removing duplicates, handling missing values, and correcting errors. For instance:
- Missing Values: Filling or removing missing entries.
- Duplicates: Removing duplicate transactions.
- Incorrect Entries: Correcting any discrepancies in product names or prices.
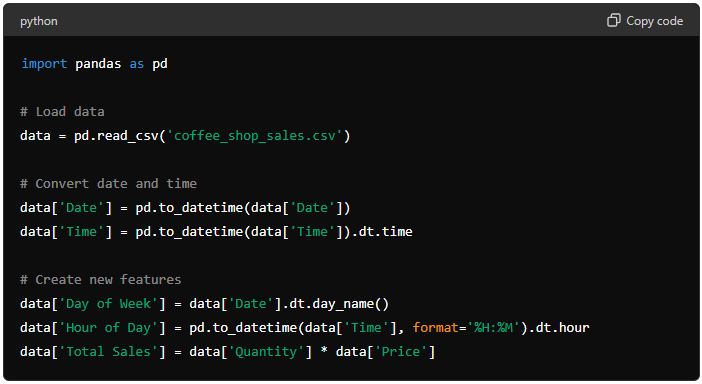
Data Transformation
Transform the data into a format suitable for analysis. This may include:
- Datetime Conversion: Convert date and time strings to datetime objects.
- Feature Engineering: Create new features like Day of Week, Hour of Day, and Total Sales.
Example in Python using Pandas:

Data Analysis
Sales Trends Over Time
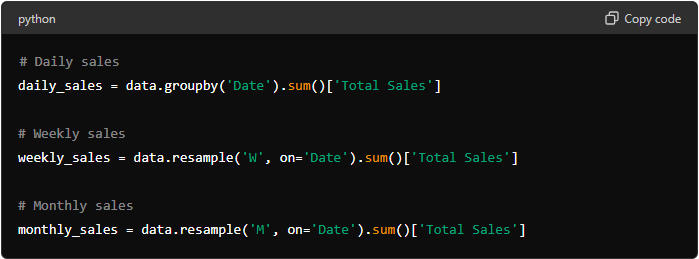
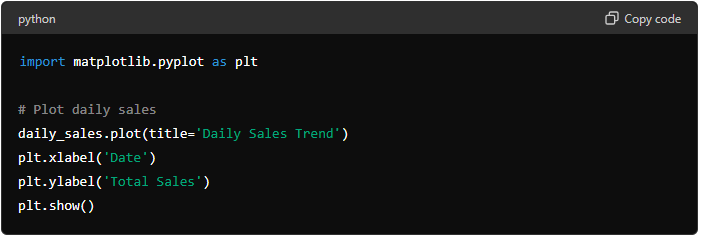
Analyzing sales over different time periods helps identify trends and seasonal patterns.
- Daily Sales: Sum of sales for each day.
- Weekly and Monthly Trends: Aggregating daily sales into weekly or monthly totals to observe longer-term trends.
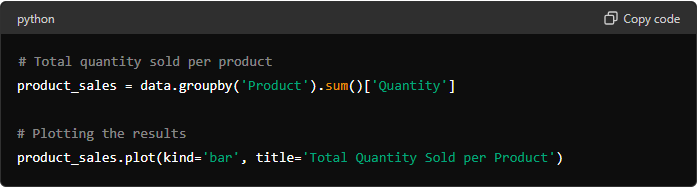
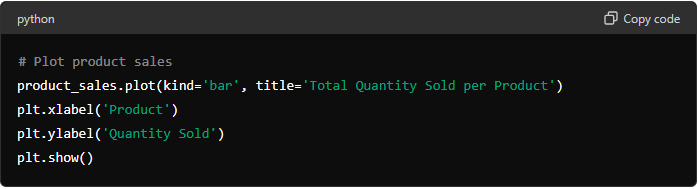
Popular Products
Identifying the best-selling products can guide inventory and marketing strategies.

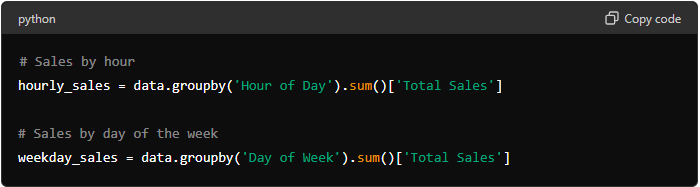
Sales by Time of Day and Day of Week
Understanding peak hours and busy days helps in staff scheduling and promotional planning.
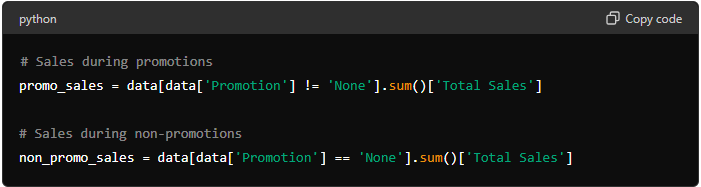
Impact of Promotions
Evaluate the effectiveness of promotions by comparing sales during promotional periods with regular periods.

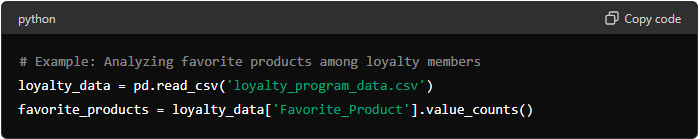
Customer Preferences and Behavior
Analyzing data from loyalty programs and surveys can provide insights into customer preferences.
Visualization
Visualizing the analysis results makes it easier to communicate insights.
- Line Charts: For sales trends over time.
- Bar Charts: For product popularity and sales by day/hour.
- Pie Charts: For market share of different products.
- Heatmaps: For sales distribution across different times and days.
Example Visualizations
Sales Trends

Product Popularity

Conclusion
This coffee shop sales analysis project demonstrates how to collect, process, and analyze sales data to gain valuable insights. By understanding sales trends, popular products, and customer behavior, coffee shop owners can make informed decisions to enhance their operations and profitability. Implementing data-driven strategies can lead to better inventory management, targeted marketing campaigns, and improved customer satisfaction.
مشروع تحليل البيانات – تحليل مبيعات المقاهي

مقدمة
يوفر تحليل بيانات المبيعات من المقهى رؤى قيمة يمكن أن تفيد عمليات صنع القرار وتعزيز تجارب العملاء وتحسين الربح
توضح هذه المقالة مشروعًا شاملاً لتحليل البيانات لأحد المقاهي مع توضيح الخطوات المتخذة لجمع بيانات المبيعات ومعالجتها وتحليلها
الأهداف
:تشمل الأهداف الأساسية لمشروع تحليل البيانات ما يلي
1. فهم اتجاهات المبيعات مع مرور الوقت
2. التعرف على المنتجات الأكثر رواجاً
3. تحليل المبيعات حسب الوقت من اليوم واليوم من الأسبوع
4. تقييم أثر الترقيات
5. فهم تفضيلات العملاء وسلوكهم
:جمع البيانات
:مصادر البيانات
:يمكن جمع البيانات لهذا المشروع من مصادر مختلفة بما في ذلك
: (POS) أنظمة نقاط البيع *
بيانات المعاملات بما في ذلك المنتج والكمية والسعر والوقت والتاريخ
استطلاعات العملاء : ردود الفعل على المنتجات وجودة الخدمة والتفضيلات *
برنامج العملاء الدائمين : بيانات عن العملاء المتكررين وعاداتهم الشرائية *
: بيانات العينة
للتبسيط خذ بعين الاعتبار بنية البيانات النموذجية التالية من نظام نقطة البيع
| Transaction_ID | Date | Time | Product | Quantity | Price | Promotion |
| 1 | 2024-07-01 | 08:05 | Latte | 2 | 5.00 | None |
| 2 | 2024-07-01 | 08:15 | Espresso | 1 | 3.00 | None |
| 3 | 2024-07-01 | 08:45 | Cappuccino | 1 | 4.50 | 10% Off |
| … | … | … | … | … | … | … |
:معالجة البيانات
تنظيف البيانات
: يتضمن تنظيف البيانات إزالة التكرارات ومعالجة القيم المفقودة وتصحيح الأخطاء، على سبيل المثال
القيم المفقودة: ملء أو إزالة الإدخالات المفقودة *
التكرارات: إزالة المعاملات المكررة *
إدخالات غير صحيحة: تصحيح أي اختلافات في أسماء المنتجات أو الأسعار *
:تحويل البيانات
:تحويل البيانات إلى تنسيق مناسب للتحليل، قد يشمل ذلك
تحويل التاريخ والوقت: تحويل سلاسل التاريخ والوقت إلى كائنات التاريخ والوقت *
هندسة الميزات: إنشاء ميزات جديدة مثل يوم من الأسبوع وساعة من اليوم وإجمالي المبيعات *
: Pandas مثال في بايثون باستخدام
:تحليل البيانات
:اتجاهات المبيعات مع مرور الوقت
يساعد تحليل المبيعات على مدى فترات زمنية مختلفة في تحديد الاتجاهات والأنماط الموسمية
المبيعات اليومية: مجموع المبيعات لكل يوم
الاتجاهات الأسبوعية والشهرية: تجميع المبيعات اليومية إلى مجاميع أسبوعية أو شهرية لمراقبة الاتجاهات طويلة الأمد

المنتجات الشعبية
يمكن أن يؤدي تحديد المنتجات الأكثر مبيعًا إلى توجيه استراتيجيات المخزون والتسويق
المبيعات حسب الوقت من اليوم واليوم من الأسبوع

يساعد فهم ساعات الذروة والأيام المزدحمة في جدولة الموظفين والتخطيط الترويجي
:تأثير الترقيات
تقييم فعالية العروض الترويجية من خلال مقارنة المبيعات خلال الفترات الترويجية بالفترات العادية
:تفضيلات العملاء وسلوكهم
يمكن أن يوفر تحليل البيانات من برامج الولاء والاستطلاعات نظرة ثاقبة لتفضيلات العملاء

:التصور
يؤدي تصور نتائج التحليل إلى تسهيل توصيل الرؤى
الرسوم البيانية الخطية: لاتجاهات المبيعات مع مرور الوقت *
الرسوم البيانية الشريطية: لمعرفة شعبية المنتج ومبيعاته حسب اليوم/الساعة *
الرسوم البيانية الدائرية: لحصة السوق من المنتجات المختلفة *
الخرائط الحرارية: لتوزيع المبيعات عبر أوقات وأيام مختلفة *
:تصورات المثال
:اتجاهات المبيعات
:شعبية المنتج
:خاتمة
يوضح مشروع تحليل مبيعات المقاهي كيفية جمع بيانات المبيعات ومعالجتها وتحليلها للحصول على رؤى قيمة، من خلال فهم اتجاهات المبيعات والمنتجات الشعبية وسلوك العملاء يمكن لأصحاب المقاهي اتخاذ قرارات مستنيرة لتعزيز عملياتهم وربحيتهم، ويمكن أن يؤدي تنفيذ الاستراتيجيات المبنية على البيانات إلى إدارة أفضل للمخزون وحملات تسويقية مستهدفة وتحسين رضا العملاء
