


We start with the following steps:
* Dataset and context
The data set in our project represents hotel reservation information in the city
This reservation information includes the time of reservation, the duration of stay, the number of people who wish to reserve, classified according to (adults – children – babies) and the number of garages available for parking
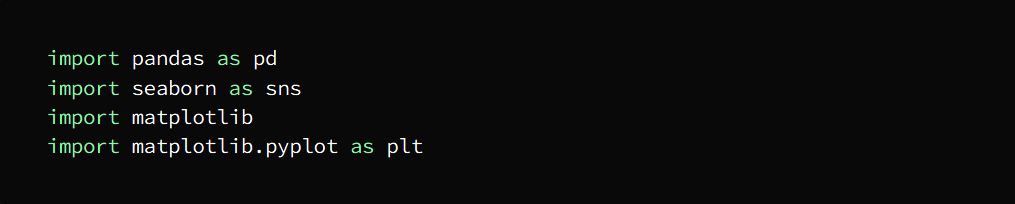
* The stage of importing and reading data packages
At this point we have to import packages and libraries for data analysis and visualization
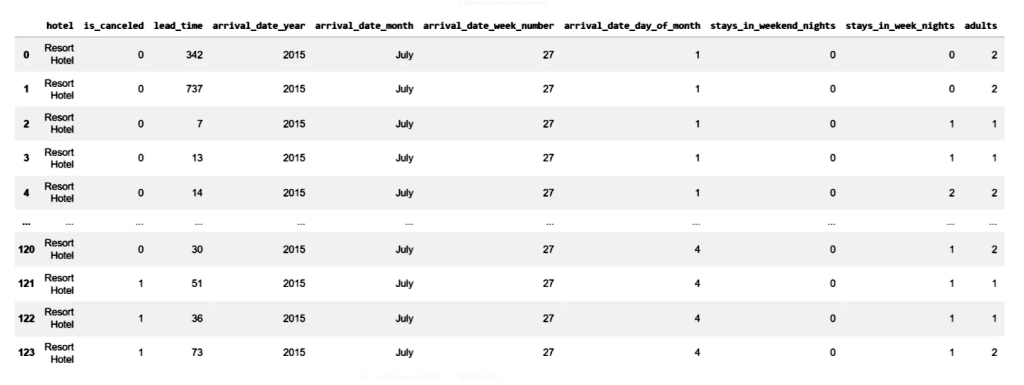
We can now read the data set
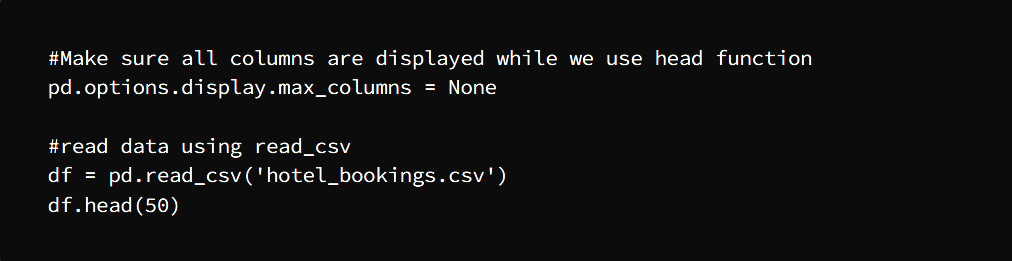
To show us the data as follows
*The data Preparation stage includes the following steps:
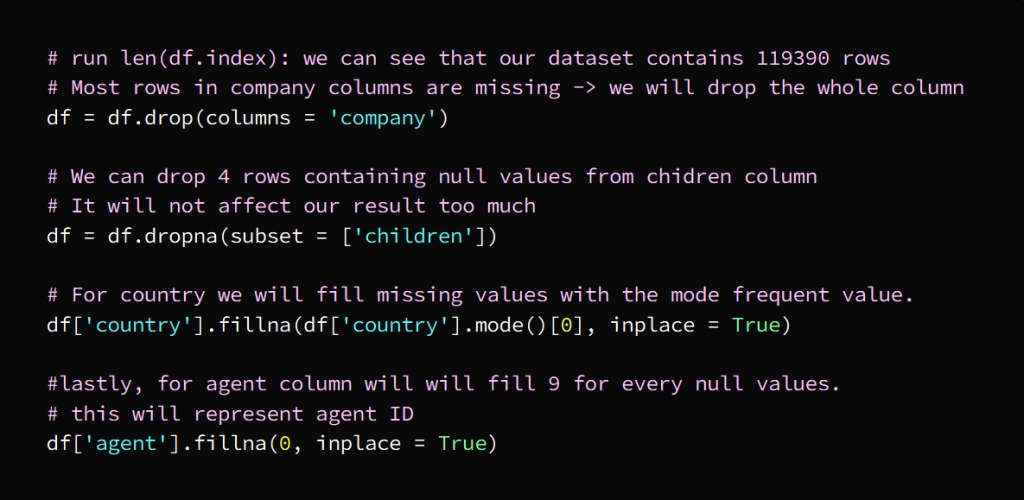
1. Handling Missing Values:


It appears to us that there are four columns whose values are empty, and in order to deal with them, we must understand the context of the data, and this is done by doing what is shown in the following figure:

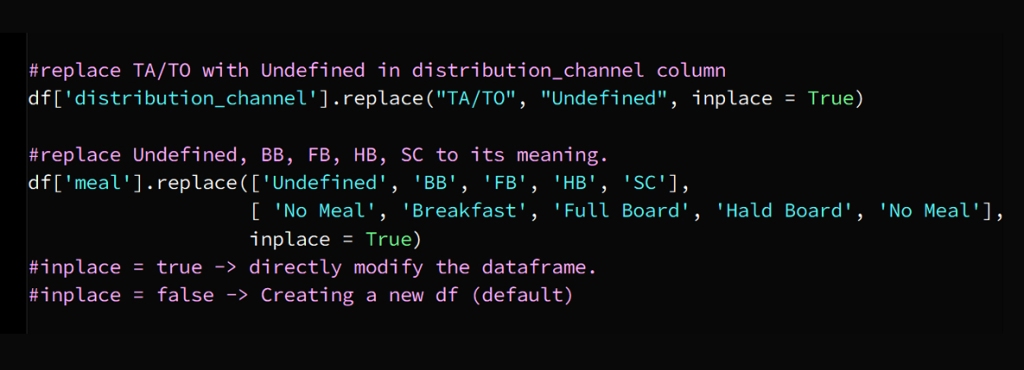
2. Convert column values:
We have to replace the random values by further analysis

3. Change Data Styles:
Now we need to modify some columns that are still in the string types

4. Handling duplicates:
We have to remove the duplicate rows and to find out the number of duplicate rows we will run the following code

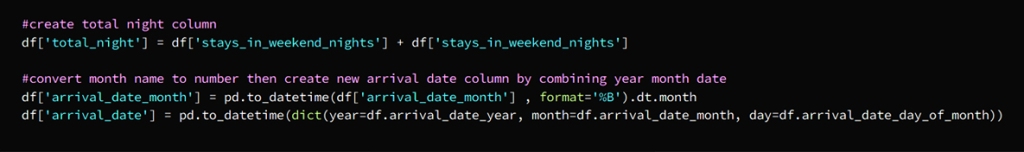
5. Create new columns by combining other columns:

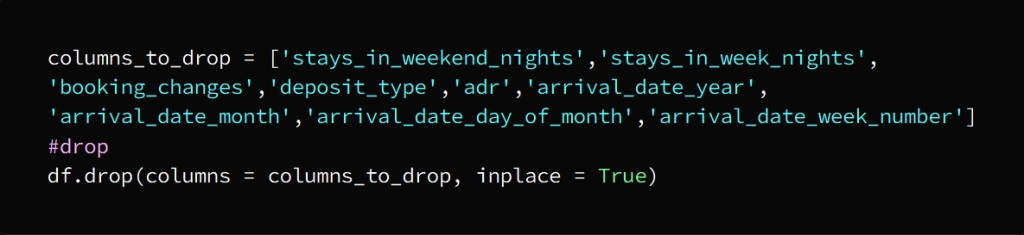
6. Drop unnecessary columns
We do this because we used it to create new columns

* Descriptive analysis and correlations:

We can implement this function to return the description of the data in the DataFrame
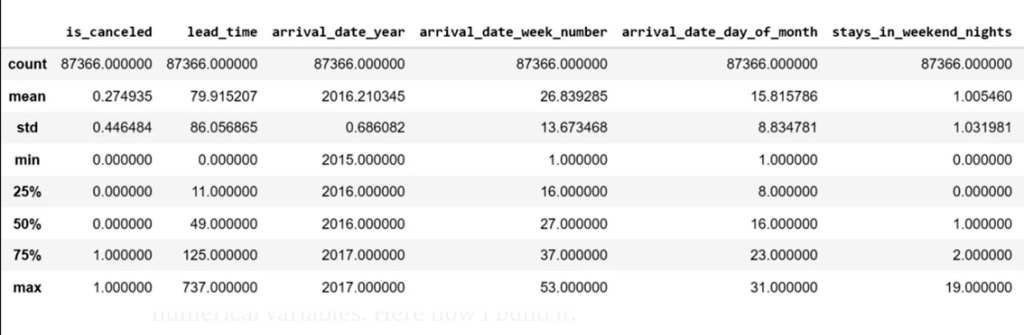
We will use this data to perform the statistical analysis
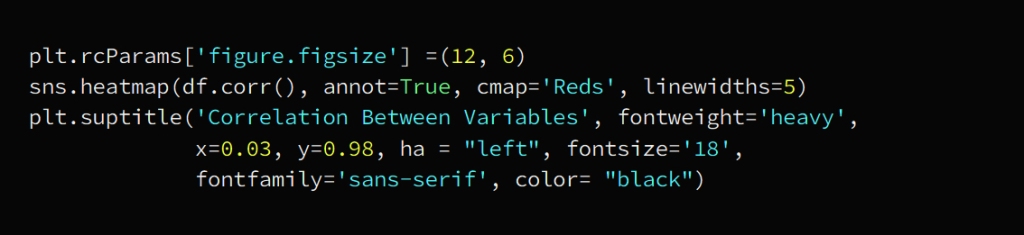
Correlation heatmap
We will now construct the relationship between the image of the strength of the relationships between the numerical variables

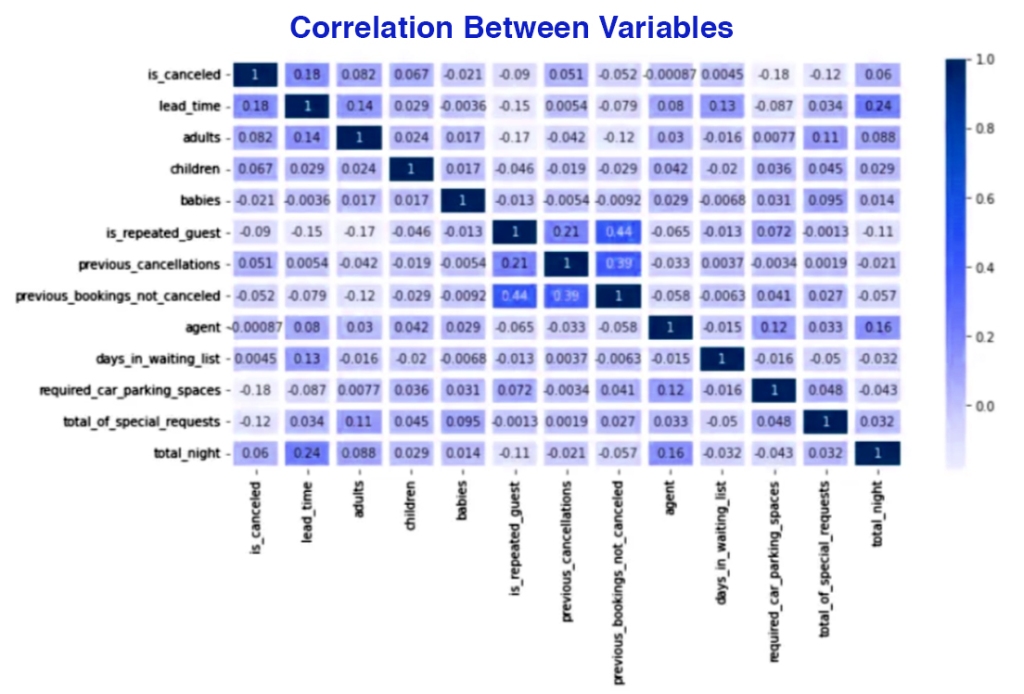
We’ll touch on using this map for EDA later
* Exploratory data analysis:
As for the EDA procedure, and in order to stay on the right path, it is preferable that we follow the following steps:
After the data preparation process, we export the file to csv and then import it into Tableau to perform visualization later

By looking at the previous map, we have several inquiries about the relationships between features
We will use the previous map and visualizations to formulate the following inquiries:
From the data set, we selected three main elements: Booking, hotel, and customer
Booking:
1. What is the big picture for booking rooms throughout the year and month?
2. What are the best booking channels?
3. Will the reservation requester include meals with the reservation menu?
hotel:
4. Which hotels are the most popular and how many bookings do they have during the year?
5. Compare those hotels in the customer group.
6. Compare those hotels on customer type.
customers:
7. What are the types of customer requests when staying in different room types?
8. Knowing the highest frequency of guests and the highest length of stay.
9. What is the impact of the presence of children on the parents’ decision to order meals and the length of stay?
10. For children and babies, what is their preferred type of room?
*Visualization and conclusion stage:
It is the visualization stage using Tableau
1. What is the big picture for booking rooms throughout the year and month?
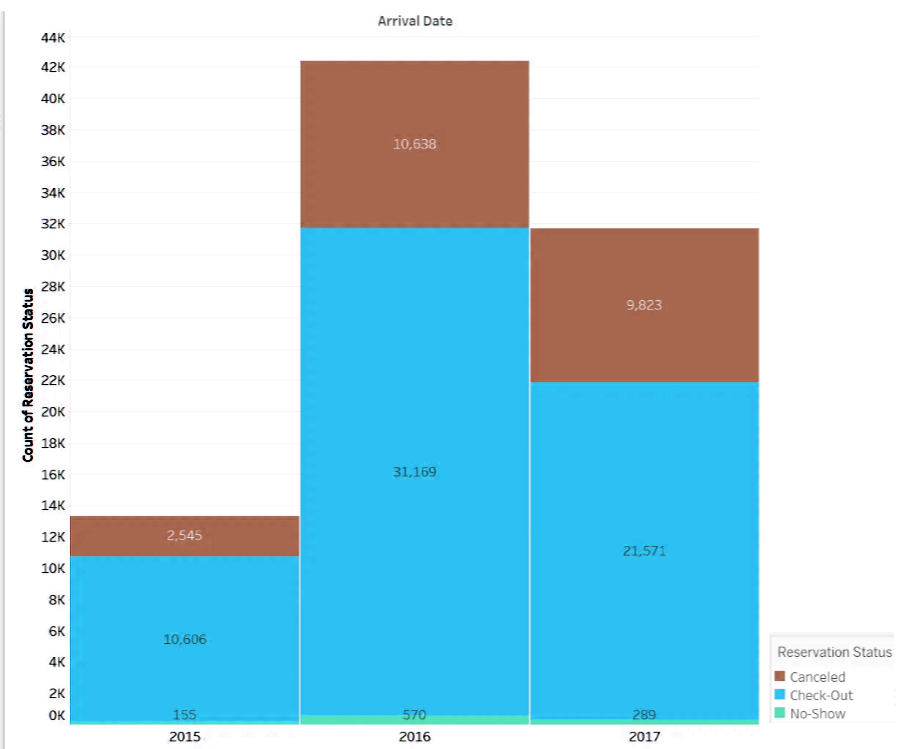
We’ll look at a three-year period in our next scenario
Check-out is observed in a large number of rooms, in return, a large percentage of the rooms are cancelled
The number of rooms that were booked, but the customers did not show up, was very large

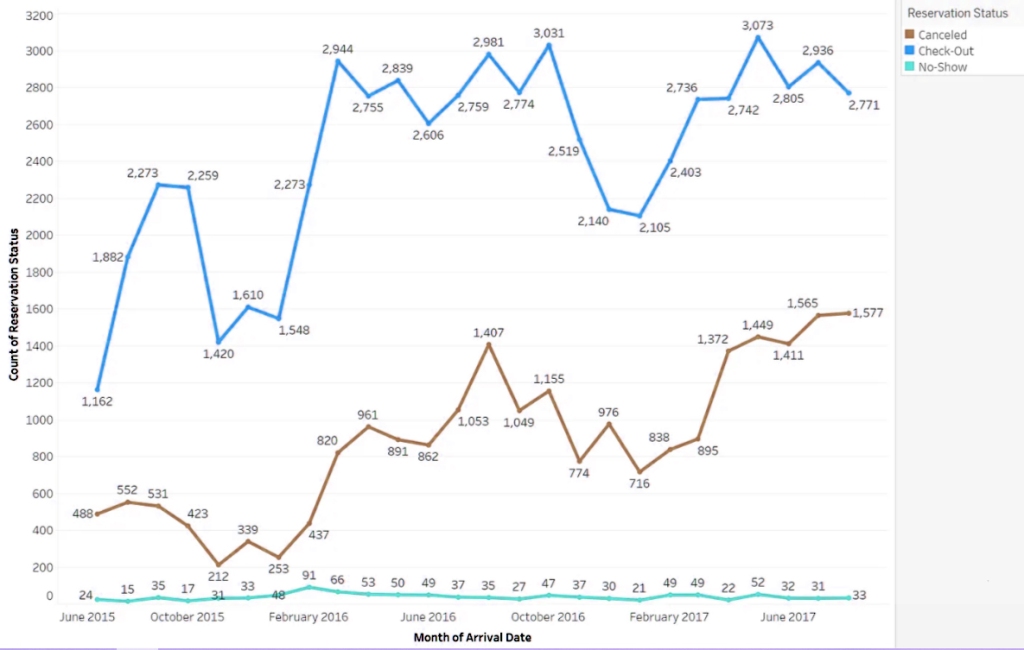
Room reservations are classified by months:
We will notice that bookings in 2016 were at their peak, especially between the months of April and July

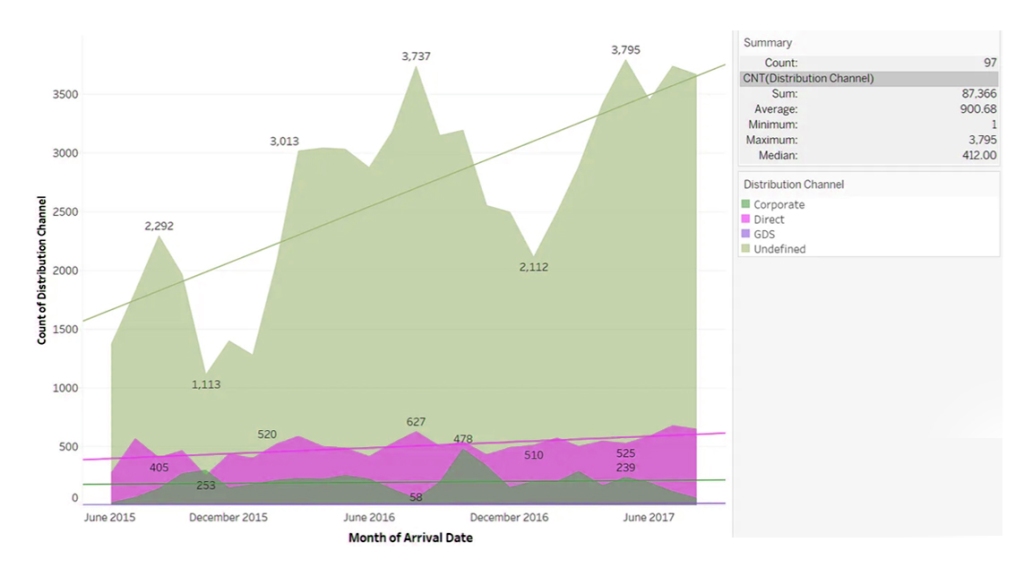
2. What are the best booking channels?
It shows us that direct channel is prevalent over hotel booking channels
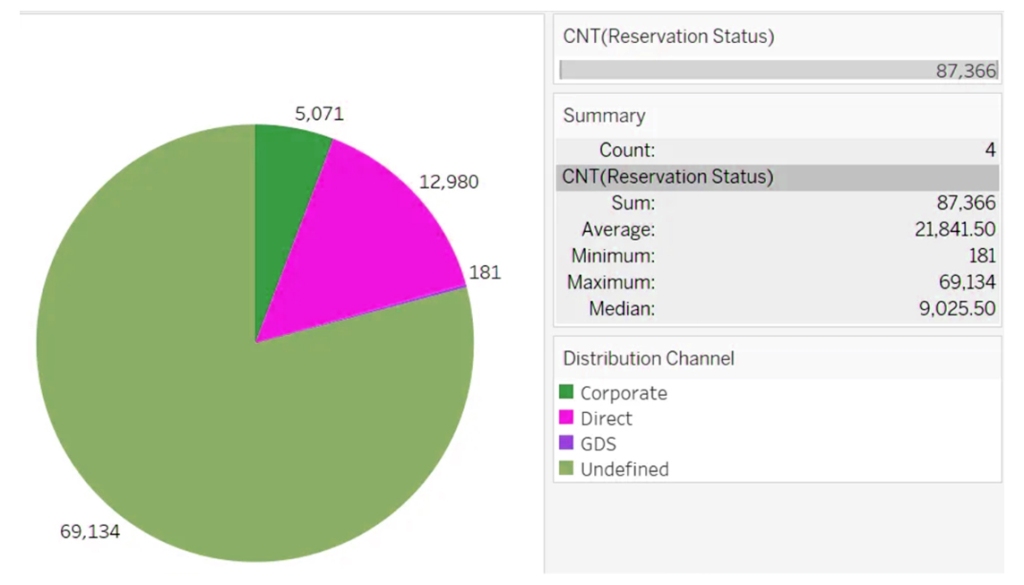
While it shows us the reservation channels over time, it did not appear effective in hotel reservations, as is the case in the GDS channel

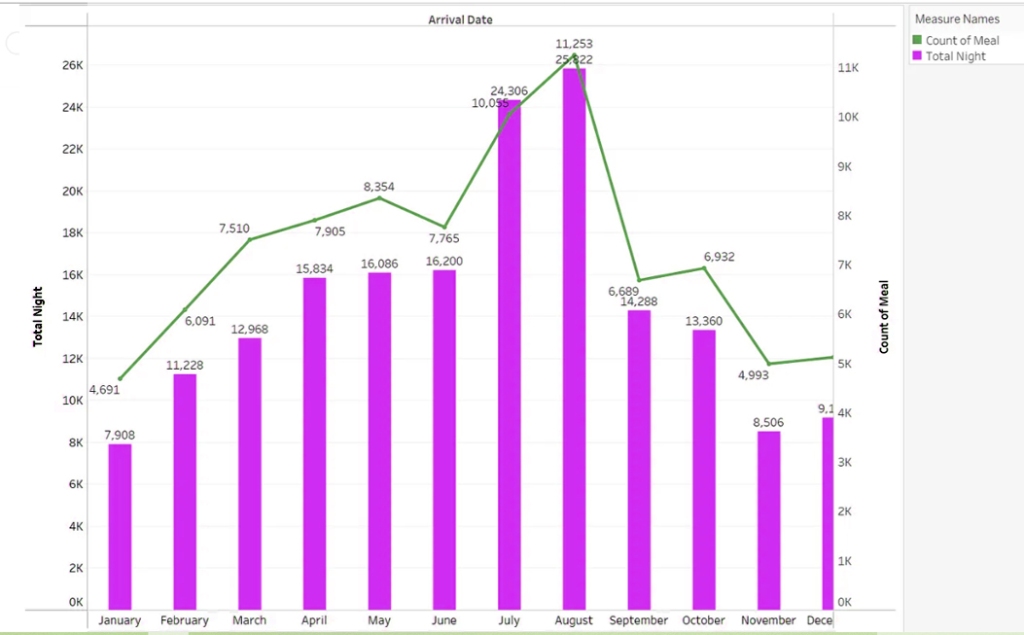
3. Will the reservation requester include meals with the reservation menu?
It is expected that the number of meals will increase with the increase in the number of reservation days, so we note that the months of July and August witness a large number of meals and booked rooms, then the numbers take a rapid decline after that
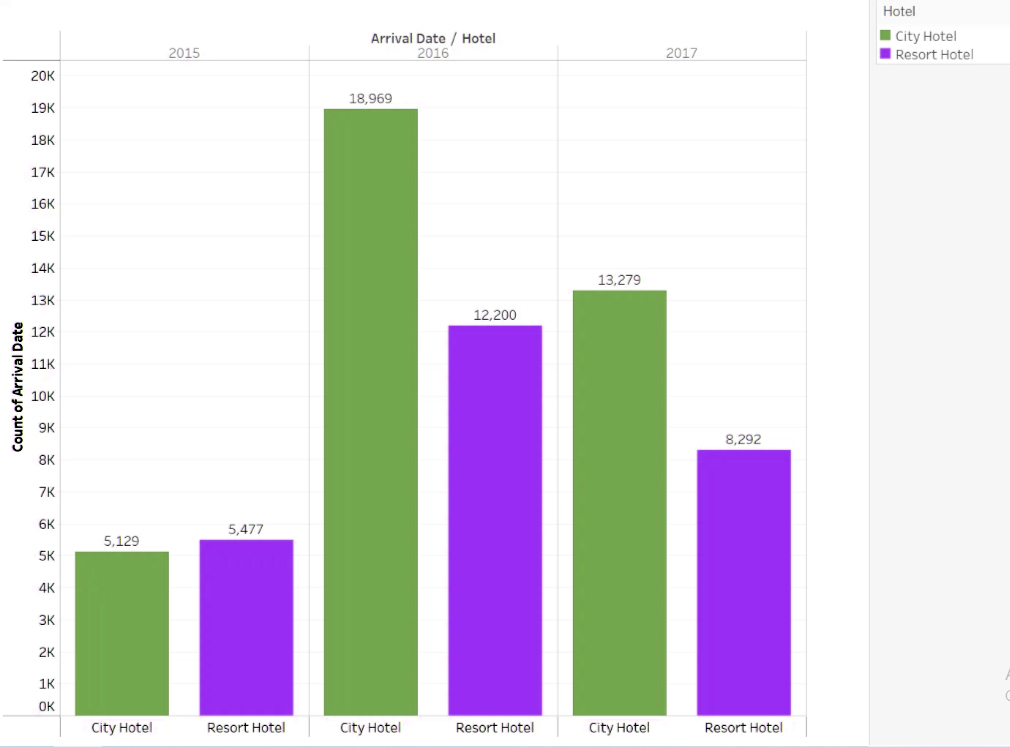
4. Which hotels are the most popular and how many bookings do they have during the year?
We are processing reservations for two hotels, City Hotel and Resort Hotel
Both hotels started booking around 2015
In comparison, we find that the City Hotel had approximately 19,000 reservations in 2016.
On the other hand, we find that the Resort Hotel had 12,200 reservations in the same year
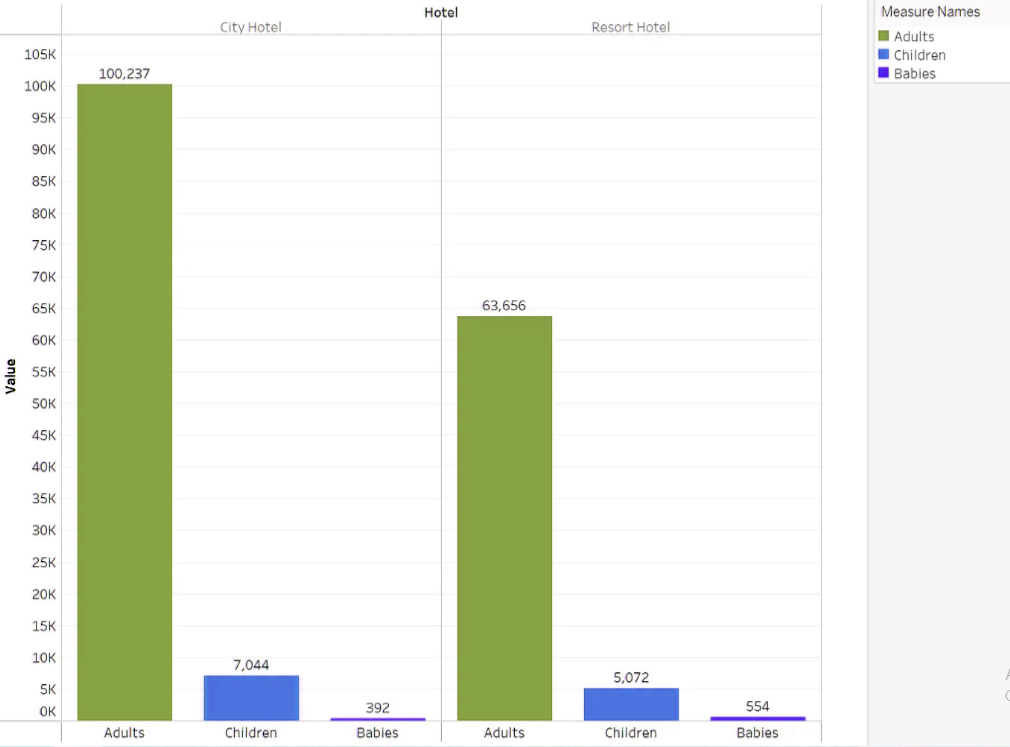
5. Compare those hotels in the customer group.
The proportion of reservations among adults is ten times higher than the children’s group and thirty times higher than the infant group
This rate is also fixed at the Resort Hotel

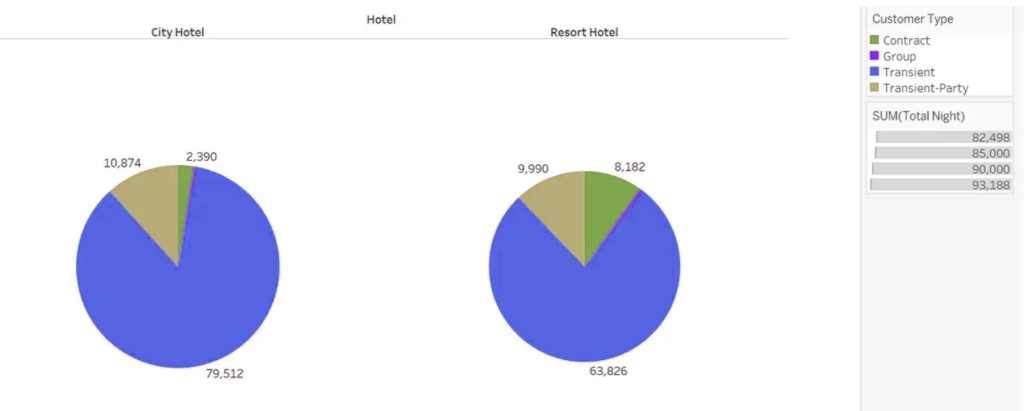
6. Compare those hotels on customer type.
The main client type is Transient, followed by the Transient-Party client type, and then the contract client type
In the result, we see that the Resort hotel has a higher percentage of the contract customer type, with a total of 8182
City Hotel scored only 2,390
Omitting the Group customer type

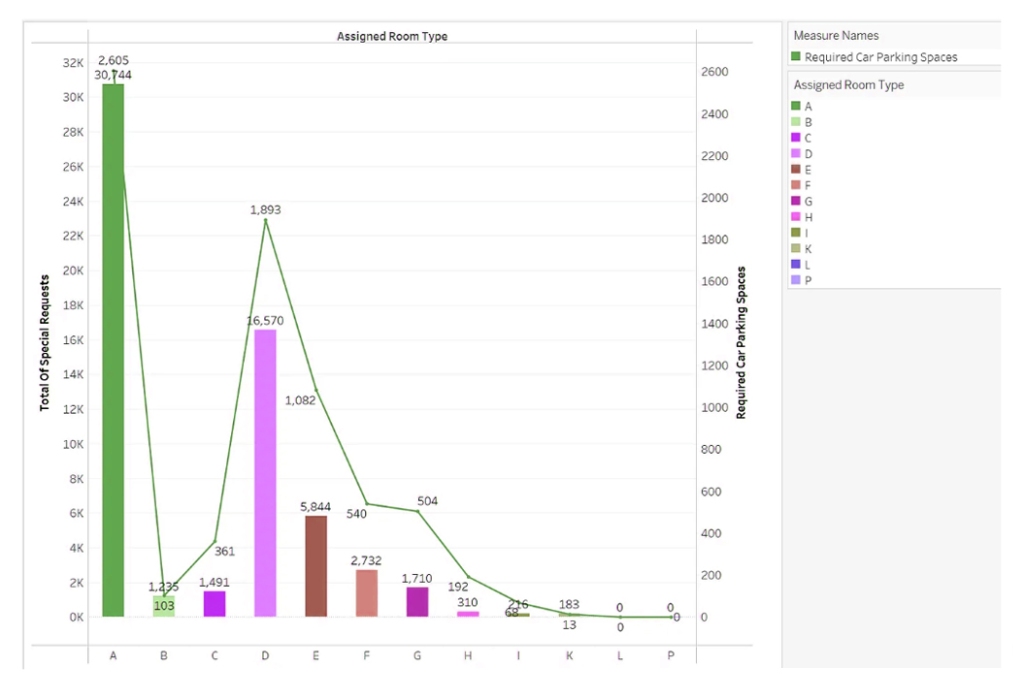
7. What are the types of customer requests when staying in different room types?
The percentage of requests for parking spaces is directly proportional to the percentage of special requests submitted by customers, so it increases with its increase
We notice an increase in the number of guests in rooms D and A
Considering that these two rooms are the most common, this means that there is a high demand for requests
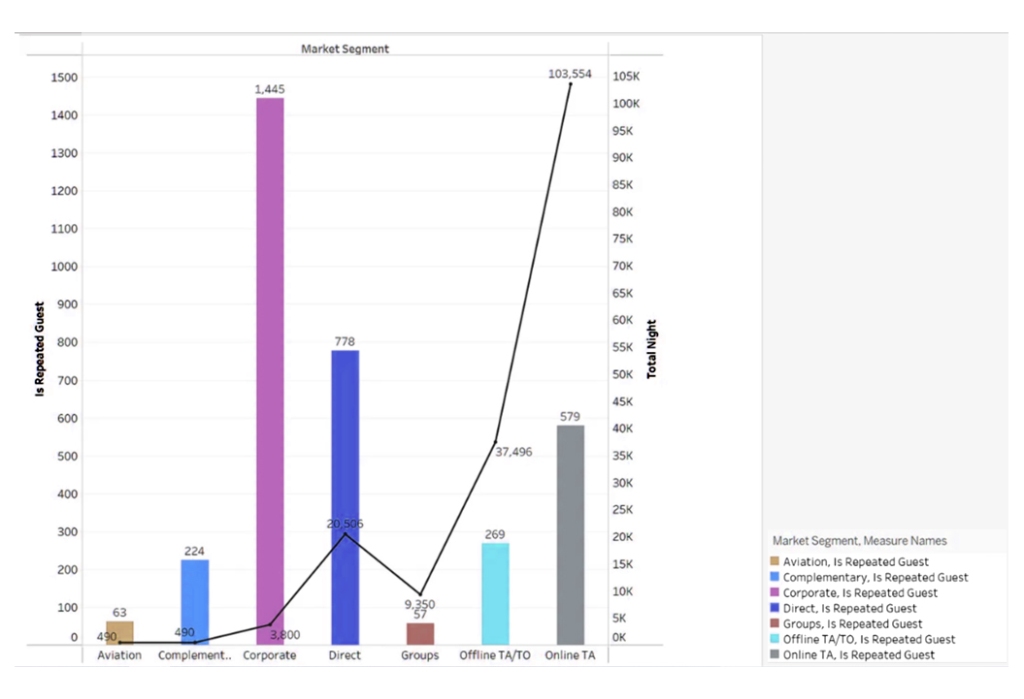
8. Knowing the highest frequency of guests and the highest length of stay.
The following chart shows data on the number of repeat guests and total stays aggregated by market movement
The number of repeat visitors within the corporate sector reached 1,445 visitors, and in return 579 visitors made reservations at the hotel again via the Internet, with a total length of stay of 103,554 nights.
The corporate segment has the highest number of repeat guests at 1,445, but their total number of nights is very low. Meanwhile, 579 online guests booked the hotel again, with a total stay of 103,554 nights.
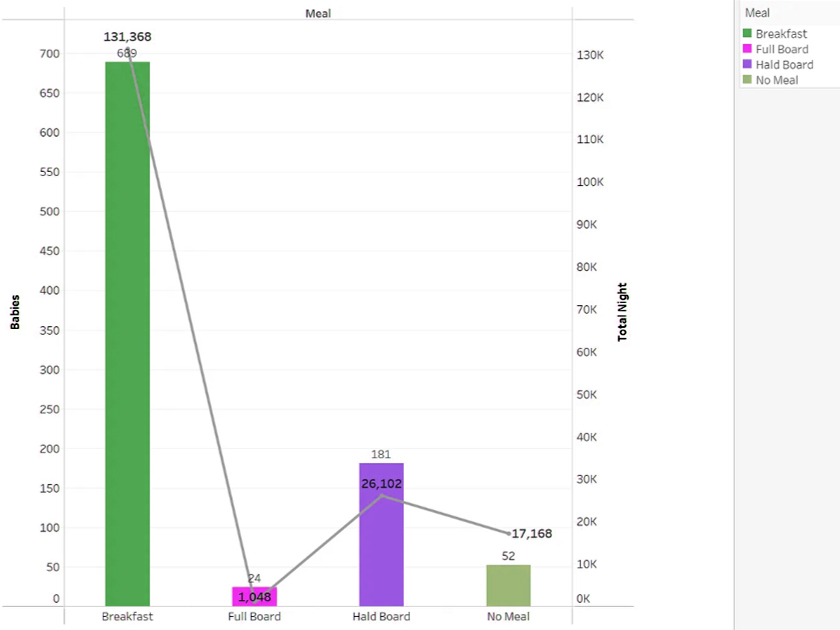
9. What is the impact of the presence of children on the parents’ decision to order meals and the length of stay?
It is clear that the presence of children has a direct impact on the parents’ decision to choose to order meals and the duration of stay. Families with children tend to request additional meals but less stay, as we can see in the figure
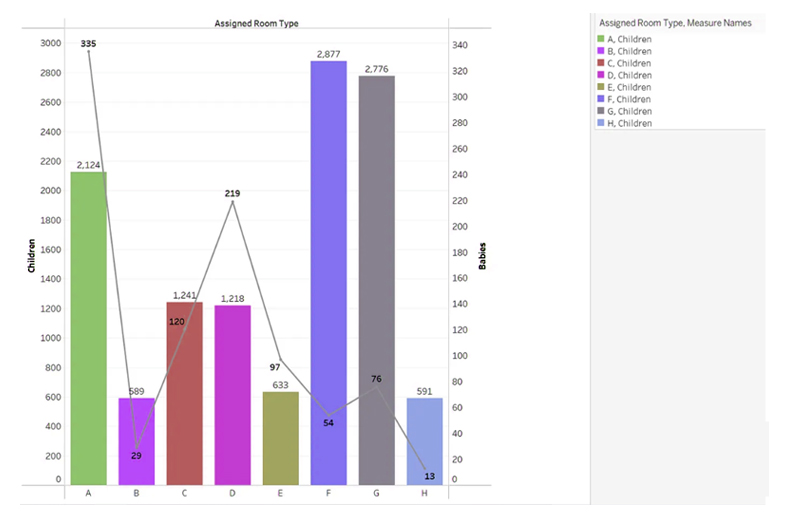
10. For children and babies, what is their preferred type of room?
Considering that
G, F, A are common rooms for children
G, D, A are common rooms for babies
We conclude that rooms G and A are most suitable for visitors with children and babies
Excluding rooms H, E, and B from the preferred rooms for the same clients

Thus, we have completed our project and learned about the most important points that must be taken into account when undertaking any project of this kind
مشروع حجز الفنادق – تحليل البيانات الاستكشافية

نبدأ بالخطوات التالية:
مجوعة البيانات وسياقها *
تمثل مجموعة البيانات في مشروعنا معلومات الحجز بالفنادق المتواجدة في المدينة
معلومات الحجز هذه تشمل وقت الحجز ومدة الإقامة وعدد الأشخاص الراغبين بالحجز مصنفين حسب (البالغين – الأطفال – الرضع ) وعدد الكراجات المتاحة لوقوف السيارات
: مرحلة استيراد حزم البيانات وقراءتها *
علينا في هذه المرحلة أن نقوم باستيراد الحزم والمكتبات لتحليل البيانات وتصورها

يمكننا الآن قراءة مجموعة البيانات

لتظهر لنا البيانات على الشكل التالي

: مرحلة تجهيز البيانات وتتضمن الخطوات التالية*
1. معالجة القيم المفقودة:


يظهر لنا أن هناك أربعة أعمدة قيمها فارغة، وللتعامل معها ينبغي علينا فهم سياق البيانات ويتم ذلك بإجراء ما هو موضح في الرسم التالي
2. تحويل قيم الأعمدة:
علينا استبدال القيم العشوائية بواسطة مزيد من التحليل
3. تغيير أنماط البيانات:
نحتاج الآن إلى تعديل بعض الأعمدة التي لا تزال في أنواع السلاسل

4. معالجة التكرارات:
علينا إزالة الصفوف المكررة ولمعرفة عدد الصفوف المكررة سنقوم بتشغيل الكود التالي

5. إنشاء أعمدة جديدة عن طريق الجمع بين الأعمدة الأخرى:
6. إسقاط الأعمدة غير الضرورية
نقوم بهذا الإجراء لأننا استعملناها لإنشاء أعمدة جديدة
* التحليل الوصفي والارتباطات:

يمكننا تنفيذ هذه الوظيفة من إرجاع
DataFrame وصف البيانات في

سنستخدم هذه البيانات لإجراء التحليل الإحصائي
Correlation heatmap
سنبني الآن العلاقة بين صورة قوة العلاقات بين المتغيرات العددية

EDA سنتطرق لاحقاً لاستخدام هذه الخريطة لـ
: تحليل البيانات الاستكشافية *
ولكي نبقى في الطريق الصحيح يُفضَّل أن نقوم باتباع الخطوات التالية
بعد عملية تحضير البيانات نقوم
Tableau ثم الاستيراد إلى csv بتصدير الملف إلى
لإجراء التصور فيما بعد

من خلال النظر في الخارطة السابقة يتكون لدينا عدة استفسارات عن العلاقات بين السمات
:سنستعين بالخارطة السابقة وبالتصورات لتكوين الاستفسارات التالية:
من مجموعة البيانات قمنا باختيار ثلاثة عناصر أساسية هي: الحجز، الفندق، العميل
الحجز
1. ما هي الصورة الكبيرة لحجز الغرف طيلة العام والشهر؟
2. ما هي قنوات الحجز الأفضل؟
3. هل سيُدرِج طالب الحجز وجبات الطعام مع قائمة الحجز؟
الفندق
4. أي الفنادق تعتبر الأكثر شعبية وكم عدد الحجوزات لديها خلال العام؟
5. مقارنة تلك الفنادق في مجموعة العملاء.
6. مقارنة تلك الفنادق على نوع العملاء.
العملاء
7. ما هي نوعية طلبات العملاء عند إقامتهم في أنواع الغرف المختلفة؟
8. معرفة أعلى معدل تكرار للنزلاء وأعلى مدة إقامة.
9. ما مدى تأثير وجود الأطفال على قرار الأهل بطلب وجبات الطعام ومدة الإقامة؟
10. بالنسبة لوجود الأطفال والرضع ما هي نوعية الغرف المفضلة لديهم؟
: مرحلة التصور والاستنتاج *
Tableau وهي مرحلة التصور باستخدام
1. ما هي الصورة الكبيرة لحجز الغرف طيلة العام والشهر؟
سنتناول فترة ثلاث سنوات في تصورنا التالي
لوحظ تسجيل مغادرة في عدد كبير من الغرف، بالمقابل يتم إلغاء نسبة كبيرة من الغرف
عدد الغرف التي تم حجزها ولكن العملاء لم يحضروا إليها كان كبيراً جداً
:حجوزات الغرف مصنفة حسب الأشهر
سنلاحظ أن الحجوزات عام 2016 كانت في أوجها وخصوصاً بين شهري نيسان وتموز
2. ما هي قنوات الحجز الأفضل؟
يظهر لنا أن القناة المباشرة هي السائدة على قنوات حجز الفنادق

في حين يظهر لنا قنوات الحجز بمرور الوقت لم تظهر فعالية في عمليات الجحز الفندقي كما هو الحال في قناة GDS
3. هل سيُدرِج طالب الحجز وجبات الطعام مع قائمة الحجز؟
من المتوقع أن عدد وجبات الطعام ستزداد مع زيادة عدد أيام الحجز، فنلاحظ أن شهري تموز وآب يشهدان عدداً كبيراً في الوجبات والغرف المحجوزة ثم تأخذ الأرقام بالانحدار بشكل سريع بعد ذلك

4. أي الفنادق تعتبر الأكثر شعبية وكم عدد الحجوزات لديها خلال العام؟
نقوم بدراسة حجوزات لاثنين من الفنادق هما City Hotel و Resort Hotel
كلا الفندقين بدأ حجوزاتهما في 2015 تقريباً
وبالمقارنة نجد أن فندق City Hotel بلغ عدد حجوزاته 19000 حجز تقريباً في العام 2016
بالمقابل نجد أن فندق Resort Hotel بلغ عدد حجوزاته 12200 حجز في نفس العام

5. مقارنة تلك الفنادق في مجوعة العملاء.
نسبة الحجوزات بين البالغين هي أعلى بعشر مرات من مجوعة الأطفال وأعلى بثلاثون مرة من مجموعة الرُّضَّع
هذه النسبة ثابتة أيضاً في Resort Hotel
6. مقارنة تلك الفنادق على نوع العملاء.
Transient نوع العميل الرئيسي هو
Transient-Party يليه نوع عميل
contract ثم نوع عميل
Resort نرى في النتيجة أن فندق
بمجموع 8182 contract يسجل نسبة أعلى من نوع عميل
مجموع 2390 فقط City بينما سجل فندق
7. ما هي نوعية طلبات العملاء عند إقامتهم في أنواع الغرف المختلفة؟
تتناسب نسبة طلبات أماكن وقوف السيارات طرداً مع نسبة الطلب الخاص المقدم من قبل العملاء فتزداد بازدياده
D , A نلاحظ ارتفاع عدد نزلاء الغرفتين
وباعتبار أن هاتين الغرفتين هما الأكثر شيوعاً هذا يعني يؤدي إلى ارتفاع الطلب على الطلبات

8. معرفة أعلى معدل تكرار للنزلاء وأعلى مدة إقامة.
يوضح لنا المخطط التالي بيانات حول عدد الضيوف المتكررين وإجمالي الإقامة المجمعة حسب حركة السوق
بلغ عدد الزوار المتكررين ضمن قطاع الشركات 1445 زائر، وبالمقابل قام 579 زائراً بالحجز في الفندق مرة أخرى عن طريق الإنترنت وبلغ إجمالي مدة الإقامة 103554 ليلة
يحتوي قطاع الشركات على أكبر عدد من الضيوف المتكررين وهو 1445 ضيفًا ، ولكن إجمالي عدد لياليهم منخفض جدًا. وفي الوقت نفسه ، حجز 579 ضيفًا على الإنترنت في الفندق مرة أخرى ، وبلغ إجمالي مدة الإقامة 103554 ليلة.

9. ما مدى تأثير وجود الأطفال على قرار الأهل بطلب وجبات الطعام ومدة الإقامة؟
يتضح أن وجود الأطفال له تأثير مباشر على قرار الأهل في اختيار طلب وجبات الطعام ومدة الإقامة، فالأسرة التي لديها أطفال تميل لطلب وجبات إضافية ولكن إقامة أقل كما نلاحظ في الشكل

10. بالنسبة لوجود الأطفال والرضع ما هي نوعية الغرف المفضلة لديهم؟
على اعتبار أن
هي غرف شائعة للأطفال G, F, A
هي غرف شائعة للرضع G, D, A
G , A نستنتج أن الغرف
هي الأنسب للزوار الذي لديهم أطفال ورضع
من الغرف المفضلة للنفس العملاء H , E , B مع استبعاد الغرف
وبهذا نكون قد أتممنا مشروعنا وتعرفنا على أبرز النقاط الواجب مراعاتها عند القيام بأي مشروع من هذا النوع
