


Data cleaning
Data sets often contain errors or inconsistencies, especially when collected from multiple sources. In these cases, it is necessary to organize that data, correct errors, remove redundant entries, work to organize and format data, and exclude outliers. These procedures are called data cleaning.
The purpose of data cleaning
This process aims to detect any defect in the data and deal with it from the beginning, thus avoiding wasting time spent on arriving at incorrect results
In other words, early detection and fixing of errors leads to correct results
This fully applies to data analysis. Going with clean and formatted data enables analysts to save time and get the best results.
Here is an example showing the stages of data cleaning:
In this example we used Jupyter Notebook to run Python code inside Visual Studio Code
The code is in the GitHub repository at the link
https://github.com/mahesh989/Basic-Data-Cleaning
The first stage: reading the data:
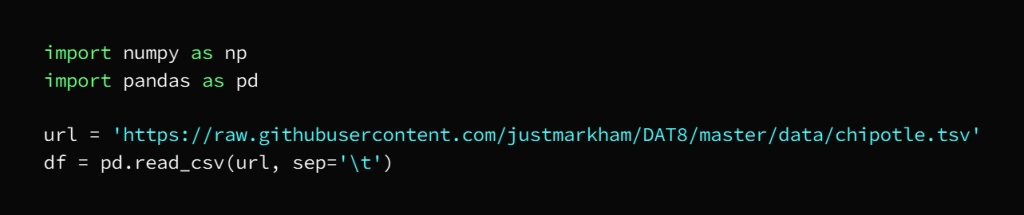
This is done in our example using pandas by reading the data that we import from the source in the link:
https://github.com/justmarkham/DAT8/blob/master/data/chipotle.tsv
So that the libraries to be used are called

The second stage:
a. Observing Data
This stage aims to identify the data structure in terms of type and distribution in order to detect errors and imbalances in the data
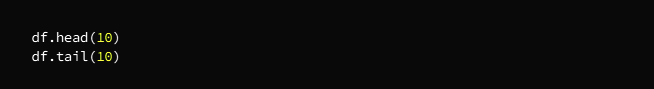
This process will print the first and last 10 entries of the dataset and thus determine the applicable dataset type so that you choose the first or last entry according to the desired purpose and then output using df.head(10)
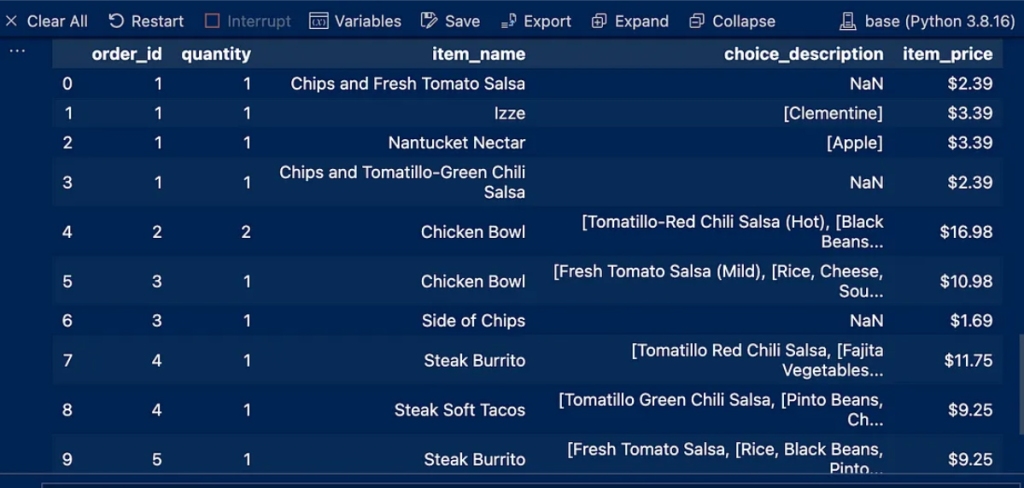
We notice some NaN entries in the Choice_description column
and a dollar sign in the item_price column
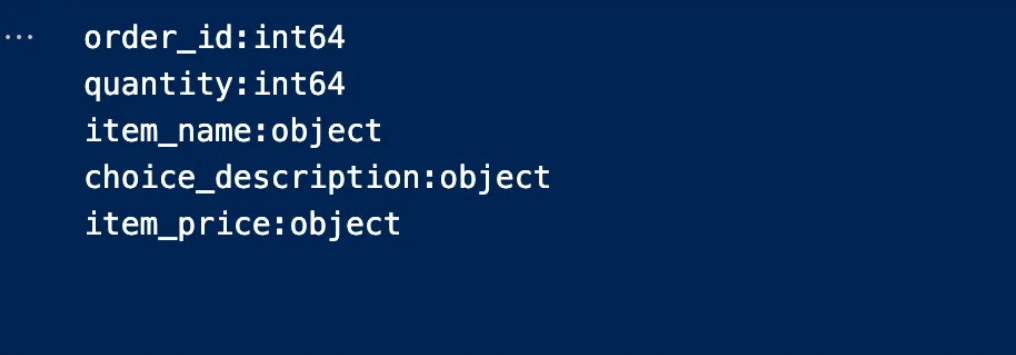
B. Data types of columns
You must now determine what type of data is in each column
In the following code, we define the column names and data types in an organized and coordinated manner

The output is:

The third stage: data cleaning
a. Change the data type
If the work requires converting data types, this is done while monitoring the data
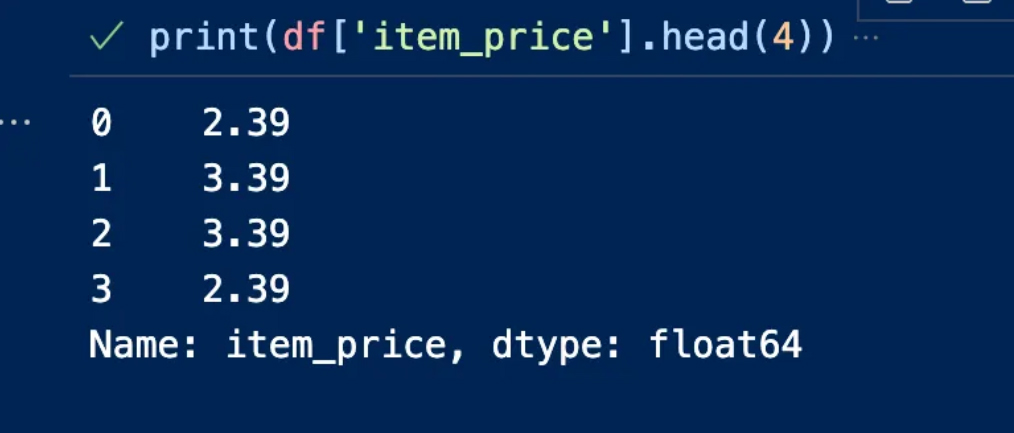
In our example item_price includes a dollar sign, we can remove it and replace it with float64 because it contains a decimal number

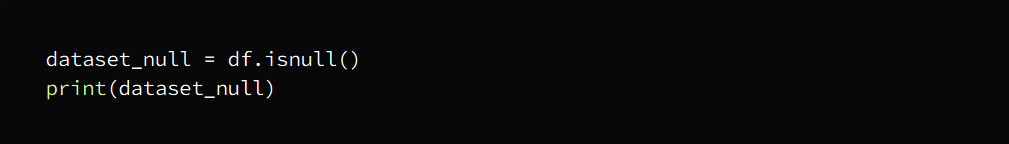
B. Missing or empty values
The stage of searching for missing values in the data set comes:

The output is:
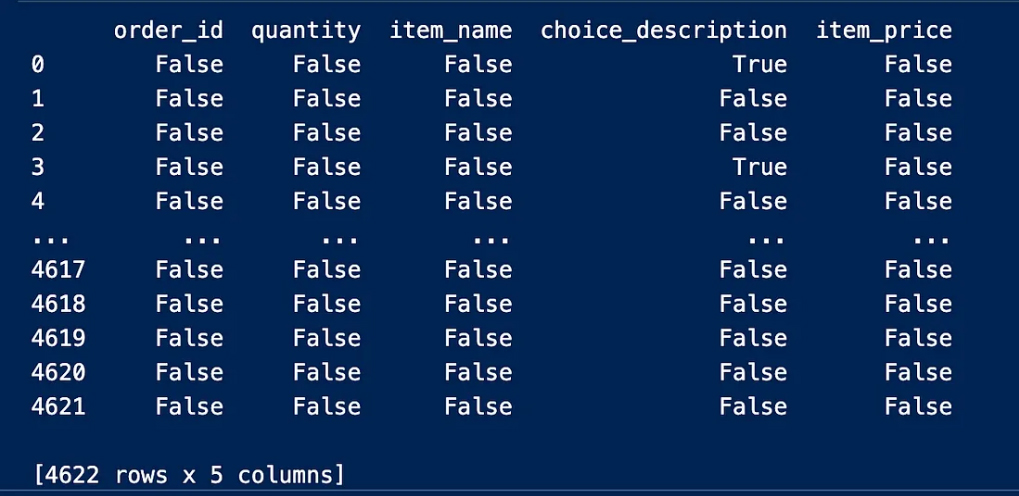
We notice from the output result above that the null value is represented by True, while False does not represent null values
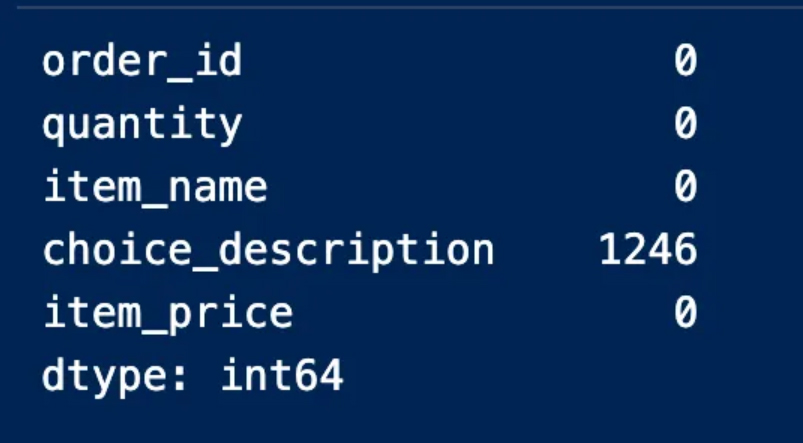
We’ll have to find the number of null entries in the table using the sum because we won’t be able to see all the real values in the table


This procedure indicates to us the columns that contain null values and the number of them is empty. We can also note that the “option_description” column is the column that contains empty entries and 1246 of them are empty
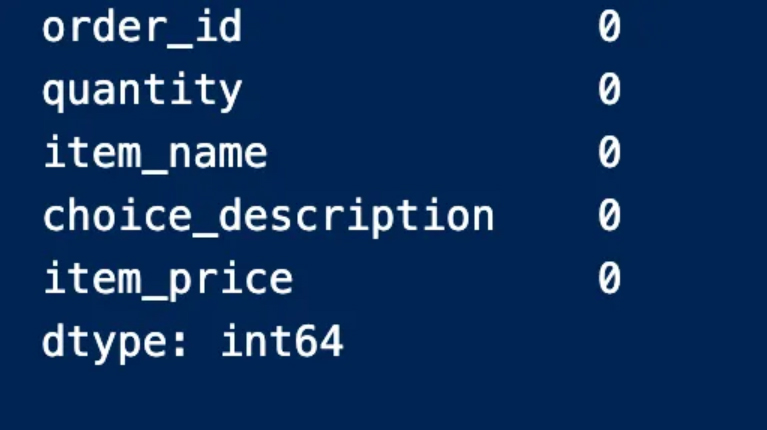
We can also determine the presence of null values for each column and find the number as in the following image

We then proceed to find the missing values for each column
In our example, we notice that only one column contains null values
It should be noted here that it is necessary to calculate the percentage of the values in each column because, especially in the case of large data, it is possible that there will be empty values within several columns.

The output is:
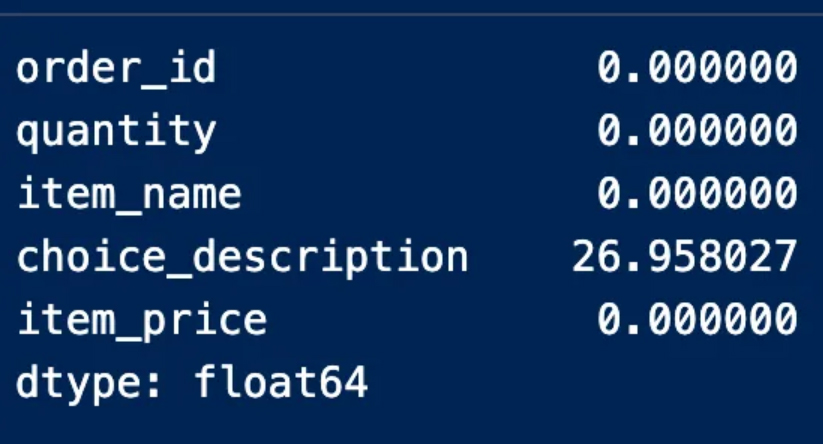
We find here that the description column contains missing values by 27%, and this percentage does not necessitate deleting the entire column because it did not exceed 70%, which is the percentage of missing values that if found in a column, it is preferable to get rid of it
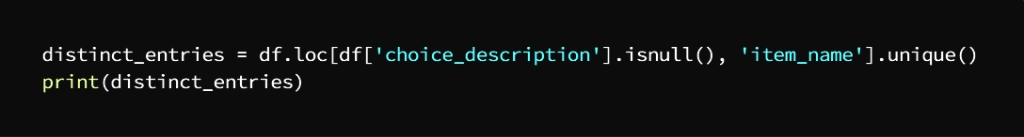
Another approach to dealing with missing values when cleaning data is to depend on the type of data and the defect to be addressed
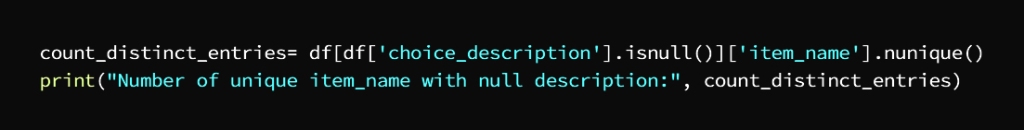
To further clarify we have the column “choice_description” and to understand what the problem is we check the unique entries in this column to get more solutions

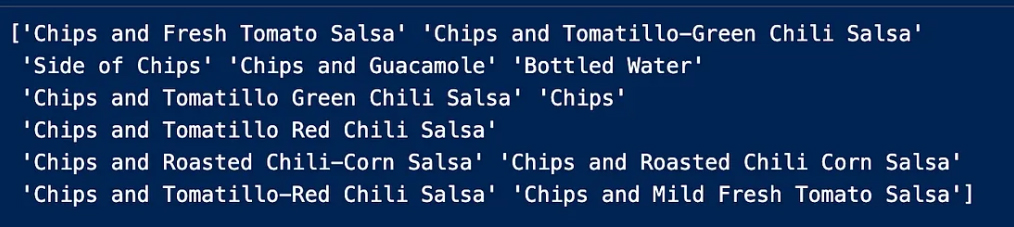
Now we make sure how many choice_description contains choice_description


Considering that the missing values are for the customer’s choice, they can be replaced on the assumption that these customers did not give details of their requests, so we replace the missing values with “Regular”.
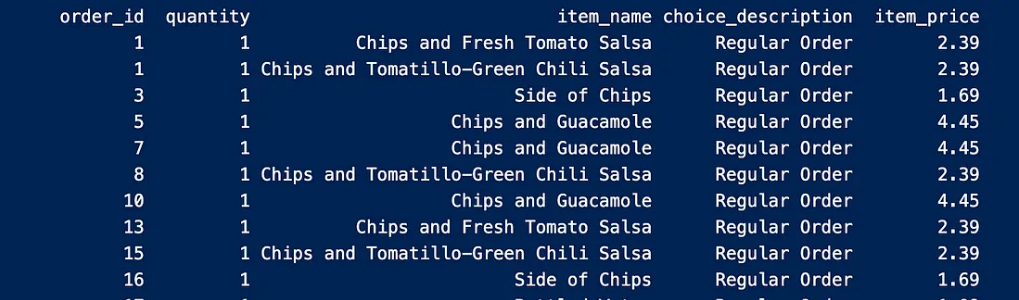
And replace the null values with “Regular Order”
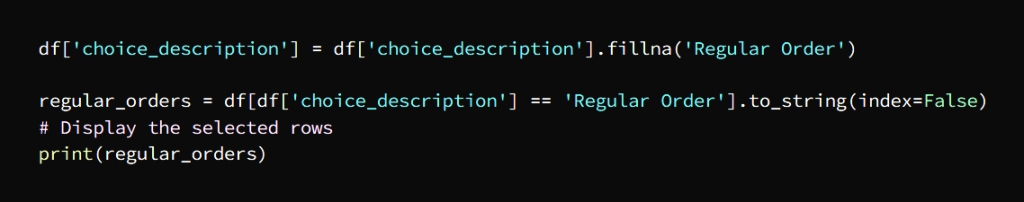
The output is:
Now let’s make sure that there are null values

By replacing null values with their descriptions, we got rid of all the missing values and began to improve our data
B. Remove redundancy
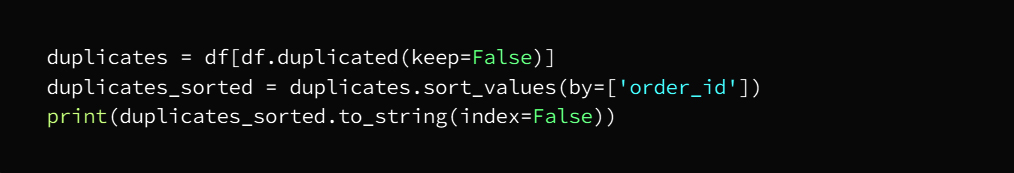
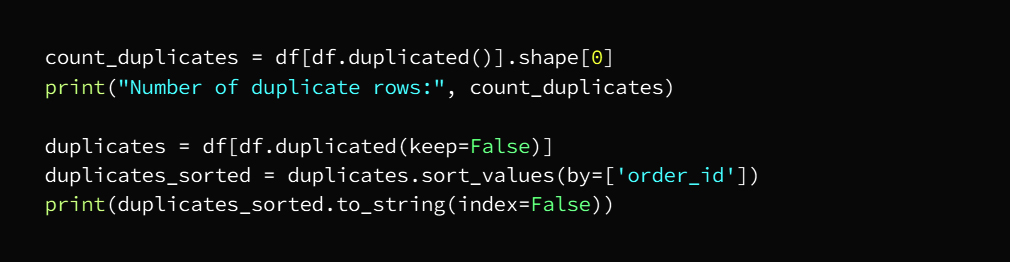
Now we will check the number of duplicate entries and then get rid of them and this deletion is not done if at least one of the entries is different from row to row as duplicate entries mean that all rows are exactly the same as the other row
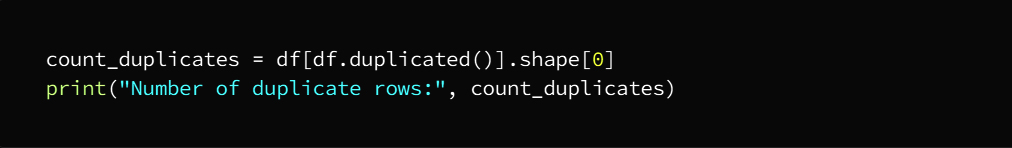

We can check by running the code

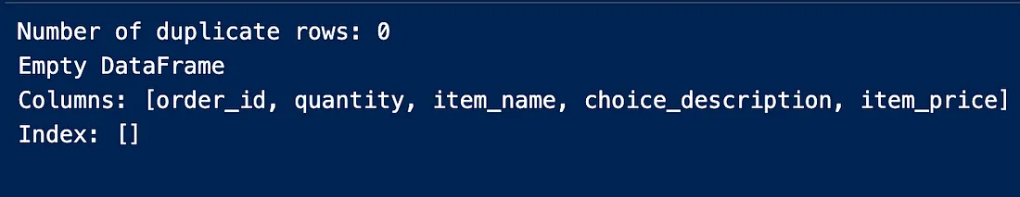
The output is:
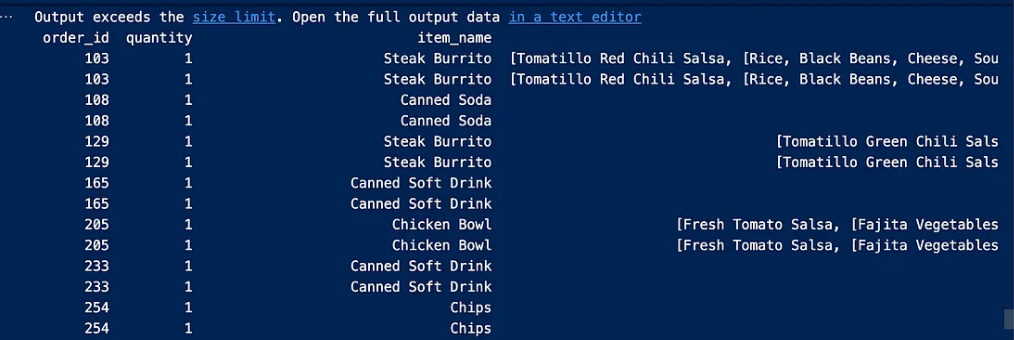
We will now delete duplicate entries

As a precautionary step we will make sure that there are no duplicate entries again


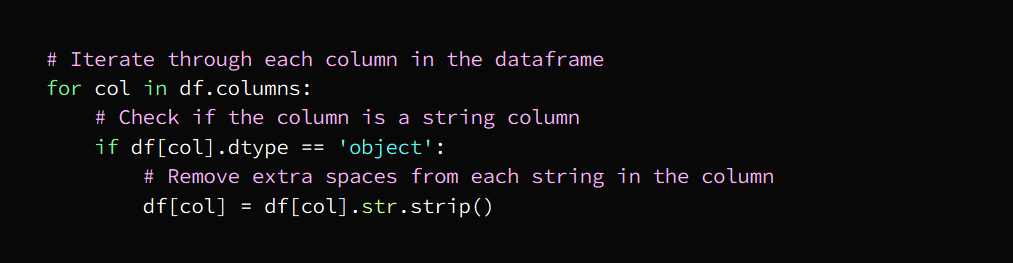
c. Delete extra spaces
That is, getting rid of spaces, extra spaces that are useless between letters and words
This task can be carried out by them:
- String processing functions
- regular expressions
- Data cleaning tools

Fourth stage: data export
This step involves exporting the clean data keeping in mind that in our example we are working on a narrow and simplified scale

This code writes the cleaned data to a new CSV file named cleaned_data.csv
In the same path as our Python script with the ability to modify the file name and path as required
The argument index = False indicates that pandas does not include row index numbers in the exported data.
Fifth stage: data visualization using Tableau
We have reached the end of the data filtering journey with the clean data which we will export to visualization and now ready for easy analysis
ما هو مفهوم تنظيف البيانات؟

تنظيف البيانات
غالباً ما تحتوي مجموعات البيانات على أخطاء أو تناقضات وخصوصاً عند تجميعها من مصادر متعددة ففي هذه الحالات من الضروري تنظيم تلك البيانات وتصحيح الأخطاء وإزالة الإدخالات المتكررة والعمل على تنظيم وتنسيق البيانات واستبعاد القيم المتطرفة، هذه الإجراءات تسمى تنظيف البيانات
الهدف من تنظيف البيانات
تهدف هذه العملية إلى اكتشاف أي خلل في البيانات والتعامل معه منذ البداية مما يجنِّب هدر الوقت المستهلك في الوصل إلى نتائج غير صحيحة
وبمعنى آخر، اكتشاف الأخطاء وإصلاحها في وقت مبكر يوصلنا إلى نتائج صحيحة بشكل مؤكد
وهذا ينطبق تماماً على تحليل البيانات فالمضي ببيانات نظيفة ومنسقة يمكِّن المحللين من توفير الوقت والحصول على أفضل النتائج
وهذا مثال يوضح مراحل تنظيف البيانات
Jupyter Notebook في هذا المثال استخدمنا
Visual Studio Code لتشغيل كود بايثون داخل
على الرابط GitHub الكود موجود في مستودع
https://github.com/mahesh989/Basic-Data-Cleaning
المرحلة الأولى: قراءة البيانات
يتم ذلك في مثالنا باستخدام باندا بأن نقرأ البيانات التي نستوردها من المصدر الموجود في الرابط
https://github.com/justmarkham/DAT8/blob/master/data/chipotle.tsv
بحيث يتم استدعاء المكتبات المراد الاستعانة بها
:المرحلة الثانية
أ. مراقبة البيانات
تهدف هذه المرحلة إلى التعرف على بنية البيانات من حيث النوع والتوزيع بغية اكتشاف الأخطاء والخلل في البيانات

بهذه العملية سيتم طباعة الإدخالات العشرة الأولى والأخيرة من مجموعة البيانات وبالتالي تحديد نوع مجموعة البيانات المعمول بها بحيث تختار الإدخال الأول أو الأخير وفق الغرض المطلوب
df.head(10) ثم الناتج باستخدام

NaN نلاحظ بعض إدخالات
Choice_description في عمود
item_price وعلامة الدولار في عمود
ب. أنواع بيانات الأعمدة
لابد الآن من تحديد نوع البيانات الموجودة في كل عمود
في الكود التالي يتحدد لدينا أسماء الأعمدة وأنواع البيانات بأسلوب منظم ومنسق

: النتيجة
المرحلة الثالثة: تنظيف البيانات
أ. تغيير نوع البيانات
إذا تطلب العمل تحويل أنواع البيانات فيتم ذلك أثناء مراقبة البيانات
علامة الدولار item_price وفي مثالنا يتضمن
float64 نستطيع إزالته واستبداله بـ
لاحتوائه على رقم عشري


ب. القيم المفقودة أو الفارغة
تأتي مرحلة البحث عن القيم المفقودة في مجموعة البيانات
النتيجة

نلاحظ من نتيجة الإخراج أعلاه
True أن القيمة الخالية متمثلة بـ
False بينما لا يمثل
قيماً خالية سنضطر إلى البحث عن عدد الإدخالات الخالية في الجدول باستخدام المجموع لأننا لن نستطيع رؤية كل القيم الحقيقية الموجودة في الجدول

يدلنا هذا الإجراء على الأعمدة التي تتضمن قيم خالية وعددها فارغ ويمكن أن نلاحظ أيضاً
“option_description” أن العمود
هو العمود الذي يحوي إدخالات فارغة و1246 منها خالية
كما ويمكننا تحديد وجود القيم الخالية لكل عمود مع إيجاد الرقم كما في الصورة التالية

ثم نتوجه إلى العثور على القيم المفقودة لكل عمود
وفي مثالنا نلاحظ أن عمود واحد فقط يتضمن قيم فارغة
يجدر التنويه هنا إلى أنه من الضروري حساب النسبة المئوية للقيم الموجودة في كل عمود لأنه وخصوصاً في حالة وجود بيانات ضخمة فمن المحتمل وجود قيم فارغة ضمن عدة أعمدة

النتيجة

description نجد هنا أن عمود
يحوي قيم مفقودة بنسبة 27% وهذه النسبة لا تستوجب حذف العمود بأكمله لأنها لم تتجاوز 70% وهي نسبة القيم المفقودة التي إن وجدت في عمود فيفضل التخلص منه ومن الطرق الأخرى المتبعة في التعامل مع القيم المفقودة عند تنظيف البيانات الاعتماد على نوع البيانات والخلل المطلوب معالجته
“choice_description”ولمزيد من التوضيح لدينا العمود
ولفهم ماهية المشكلة نتحقق من الإدخالات الفريدة في هذا العمود لنحصل على مزيد من الحلول

choice_description نتأكد الآن من عدد
choice_description الذي يتضمن

على اعتبار أن القيم المفقودة مخصصة لاختيار العميل فيمكن استبدالها على فرض أن هؤلاء العملاء لم يعطوا تفصيلاً عن طلباتهم
” Regular” فنستبدل القيم المفقودة بـ
” Regular Order” ونستبدل القيم الخالية بـ

النتيجة

ولنتأكد الآن من وجود قيم خالية


وعن طريق استبدال القيم الخالية بالأوصاف الخاصة بها تخلصنا من جميع القيم المفقودة وهكذا بدأنا بتحسين بياناتنا
ب. إزالة التكرار
سنتحقق الآن من عدد الإدخالات المكررة لنقوم بعد ذلك بالتخلص منها وعملية الحذف هذه لا تتم إذا كان أحد الإدخالات على الأقل مختلفاً من صف إلى آخر حيث أن الإدخالات المتكررة تعني أن جميع الصفوف متطابقة تماماً مع الصف الآخر


يمكننا التحقق من خلال تشغيل الكود
النتيجة

سنقوم الآن بحذف الإدخالات المتكررة

كخطوة احترازية سنتأكد من عدم وجود إدخالات مكررة مرة أخرى
ج. حذف المسافات الزائدة
أي التخلص من المسافات الفراغات الإضافية التي لا فائدة منها بين الأحرف والكلمات
ويمكن أن تنفذ هذه المهمة منها
وظائف معالجة السلاسل
التعبيرات العادية
الأدوات المخصصة لتنظيف البيانات
المرحلة الرابعة: تصدير البيانات
هذه الخطوة تتضمن تصدير البيانات النظيفة مع الأخذ بعين الاعتبار أننا في مثالنا نعمل على نطاق ضيق ومبسط

يعمل هذا الكود على كتابية البيانات المنظفة
cleaned_data.csv جديد اسمه CSV إلى ملف
في نفس المسار مثل نص بايثون الخاص بنا مع إمكانية تعديل اسم الملف والمسار حسب المطلوب
index = False تدل الوسيطة
أن “باندا” لا تقوم بتضمين أرقام فهرس الصفوف في البيانات المصدرة
المرحلة الخامسة: تصور البيانات باستخدام تابلو
وصلنا إلى نهاية رحلة تصفية البيانات بحصولنا على البيانات النظيفة والتي سنصدرها إلى التصور فهي الآن جاهزة لإجراء عملية التحليل بسهولة

One thought on “What is the concept of data cleaning?”