With the rapid scientific progress, learning frameworks have become more expanded and diverse, given that continuous learning is an essential cornerstone for the learner to develop himself and increase his skills that he needs for the growth of his work.
Therefore, professional development is one of the pillars of advancement for any work or profession, whether at the level of the individual or the institution, all the way to companies at all levels.
The aforementioned can be applied to data science and all the sciences and specializations that derive from it. The data scientist’s development of his skills and experiences, and thus his keeping pace with continuous developments and updates, raises his value and scientific level.
Experience and skill in data science and its analysis can be gained from several sources, including training courses, but on the other hand, the sources of these training courses must be reliable in terms of correct information and high efficiency, so we will present a list of free virtual training courses provided by the best data science companies with special registration links with it
* KPMG Data Analytics Internship
This company is considered a member of the family of major accounting companies that provide valuable scientific content, focusing in its educational program on simplifying the concept of dealing with big data and how to optimally deal with effective data analyzes,
It is a global management consulting company with offices in many countries of the world and its headquarters is located in Boston, and it is known as one of the highest-level consulting companies in the world. It is famous for creating many management analysis methods, including the growth and participation matrix, the effects of the experience curve, and others.
The TATA Group includes many companies that provide energy, engineering and information systems services, in addition to training programs related to data science, especially with regard to solving problems and dealing with them to reach the best results.
This course will enable you to learn about the day-to-day work of the Data Science team at British Airways. You will learn how they extract data from customer reviews and create predictive models.
Similar to the previous company, during this course, you will be allowed to enter the daily work world of the American company Cognizant, allowing you to virtually complete the tasks of the artificial intelligence team and gain experience and skill
This training program allows you to learn about the ability of data to penetrate individuals and organizations. This program is provided by Quantium, a leading company in data science and technology, by creating decision support tools, generating insights, and developing data sets
From what we have seen, these courses are an opportunity to get acquainted with the mechanism of dealing with important companies with data science and various analysis techniques, so that they allow you to work with them virtually to increase your experience and expand your skills.
Advertisements
مجموعة دورات تدريبية مجانية افتراضية بعلوم البيانات مقدمة من أفضل الشركات
Advertisements
مع التقدم العلمي المتسارع أصبحت أطر التعلم أكثر توسعاً وتنوعاً، ونظراً لاعتبار التعلم المستمر هو ركن أساسي بالنسبة للمتعلم ليطور من نفسه ويزيد مهاراته التي يحتاجها لنمو عمله
لذا فالتطوير المهني هو من دعائم التقدم لأي عمل أو مهنة سواء على مستوى الفرد أو المؤسسة وصولاً إلى الشركات بكافة مستوياتها
ويمكن إسقاط ما سلف ذكره على علوم البيانات وكل ما يتفرع عنها من علوم واختصاصات، فتطوير عالِم البيانات لمهاراته وخبراته وبالتالي مواكبته للتطورات والتحديثات المستمرة يرفع من قيمته ومستواه العلمي
يمكن اكتساب الخبرة والمهارة في علم البيانات وتحليلاتها من عدة مصادر منها الدورات التدريبية، لكن بالمقابل يجب أن تكون مصادر هذه الدورات التدريبية موثوقة من حيث المعلومة الصحيحة والكفاءة العالية، لذا سنقدم قائمة بدورات تدريبية افتراضية مجانية مقدمة من أفضل الشركات المختصة بعلم البيانات مع روابط التسجيل الخاصة بها
* KPMG Data Analytics Internship
تعتبر هذه الشركة فرد من عائلة شركات محاسبة كبرى تقدم محتوى علمي قيّم، تركز في برنامجها التعليمي على تبسيط مفهوم التعامل مع البيانات الضخمة وكيفية التعامل الأمثل مع التحليلات الفعالة للبيانات
هي شركة استشارات إدارية عالمية لها مكاتب في العديد من دول العالم ويقع مقرها الرئيسي في بوسطن، وتعرف على أنها واحدة من أرفع الشركات الاستشارية مستوى في العالم. تشتهر بابتكار العديد من أساليب التحليل الإداري ومنها مصفوفة النمو والمشاركة، وتأثيرات منحني الخبرة وغيرها.
التي تقدم خدمات الطاقة والهندسة وأنظمة المعلومات إضافة إلى البرامج التدريبية المتعلقة بعلوم البيانات وخاصة فيما يتعلق بحل المشكلات والتعامل معها للوصول إلى أفضل النتائج
تتميز هذه الدورة بأنها ستمكنك من التعرف على العمل اليومي الذي يقوم به فريق علوم البيانات في الخطوط الجوية البريطانية ستتعرف على كيفية استخراجهم لبيانات مراجعات العملاء وإنشاء النماذج التنبؤية
من خلال ما رأينا تعتبر هذه الدورات بمثابة فرصة للتعرف على آلية تعامل الشركات المهمة مع علم البيانات وتقنيات التحليل المتنوعة بحيث تتيح لك العمل معها بشكل افتراضي لتزيد خبراتك وتتوسع مهاراتك
We have already noted in previous articles that a job in data science is the dream of many in recent times, and this matter requires effort to obtain great experience and knowledge due to the high level of competition to obtain this job.
And the most important pillars of the required expertise is not only knowing the tools and dealing with them, but it is necessary for the data scientist to have a comprehensive idea of the main concepts and techniques and use them later according to the requirements of the work to be accomplished.
In this article, we will provide a comprehensive guide for beginners who are about to learn data science
Let’s first learn about the concept of data science
Data science in a simplified way is the integration of a group of sciences such as mathematics, statistics and programming that work together to obtain useful insights when dealing with data.
Many related sciences branch out from data science, and the following sciences are the most common, including:
Machine learning, data analysis, business intelligence, statistics, mathematics and other sciences whose prevalence is no longer a secret
Data science is utilized according to previous features and technologies in several areas, including:
Language translation and text analytics, image sorting, remote sensing and health services management
The three most common tasks in data science
Data Analyst: Analyze data to generate better insights for business decisions
Data Scientist: Extracting useful information from big data
Data architecture: dealing with data pipelines
What are the best ways to learn data work?
Learning data science is distinguished by the fact that the deeper you study it, the more knowledge horizons will increase in front of you, and you will feel that you still have a lot to learn. Through this plan, diversify learning sources, such as using online training courses, viewing certificates, and choosing the appropriate ones. There are other means that we will discuss later.
* Know the basic concepts
Knowing the necessary tools and software used by a data scientist as well as the main techniques is one of the most important necessities to learn
Learning a programming language is the most important pillar necessary to start the journey of learning as the Python language (or any language of your choice), you must learn it to the point of proficiency, and reading articles related to the basics of programming and learning how to write code helps you to enable and consolidate the information you receive
* learning through the implementation of projects
This method is the best for learning, as it will introduce you to the work environment in data science. As you implement projects, you will have clear visions, and you will have your own style in deducing options and exploring appropriate solutions.
The implementation of projects requires conducting many searches and carrying out relevant studies. It is advised to start with simple projects that suit your level as a beginner, and with continuous repetition and good follow-up, you will find yourself starting to learn broader concepts to move on to implementing more complex projects, thus increasing your experience and skills.
What are the most important points that a beginner data scientist should learn?
You must choose a field in which you specialize in data science, and accordingly we mention several concepts that you must learn and master
1. Comprehensive knowledge
You must realize the real world around you by following the news that benefits you in your field of learning and keeping abreast of all updates and technologies. By employing the events around you in your studies in a field of data science, you can get the maximum benefit from the course of events around you.
2. Mathematics and Statistics
mathematics
* Linear Algebra: It is a branch that is useful in machine learning because it relies on the formation of matrices, which is a basic pillar of machine learning, so that the matrix represents the data set
Probability: This branch of mathematics is useful in predicting the unknown outcomes of a particular event
* Calculus: They are useful in collecting small differences to determine the derivatives and integrals of functions, and this appears in deep learning and machine learning
Statistics
Descriptive statistics: includes (average, median, cut statistics, and weighted statistics). This is considered the beginning of the stages of analyzing quantitative data formed in the form of charts and graphs.
Inferential statistics: includes determining working measures A and B tests and creating hypothesis tests, probability value, and alpha values for analyzing the collected data
3. Dealing with databases
When talking about data engineering, we should mention the intersection between a data scientist and a data engineer, where pipelines are created for all data from several sources and stored in a single data warehouse.
As a beginner it is recommended to learn SQL and then move to One RDBMS such as
MySQL and One NoSQL
Advertisements
4. Python and its libraries
It is the most widely used programming language for later use in data analytics due to its simplicity in terms of building code and organizing sentences, and it has many libraries such as NumPy, Pandas, Matplotlib, and Scikit-Learn.
This allows the data scientist to use data more effectively
There are courses for beginners in Python on Udemy or Coursera that can be used to learn the principles of Python
5. Data cleaning
It is a time-consuming task for beginners, but it must be implemented in order to obtain good data analysis resulting from clean data.
For a detailed explanation of data cleaning, you can read a comprehensive article through this link Click here
6. Exploratory data analysis
This type of analysis is meant to detect anomalies in the data and test hypotheses with the help of statistics and graphs
As a beginner, you can use Python to perform EDA according to the following steps
Data collection: It involves gathering, measuring, and analyzing accurate data from multiple sources in order to find a solution to a specific problem
Data cleaning: Troubleshoot incorrect data
Univariate analysis: It is an analysis process based on a single change without addressing complex relationships and aims to describe the data and identify existing patterns
Bivariate Analysis: This process compares two variables to determine how the features affect each other to perform the analysis and determine the causes
7. Visualization
One of the most important pillars of all data analysis projects, visualization is a technique that makes seeing data clear and effective in the end, and reaching effective results in visualization depends on having the right set of visualizations for different types of data
Types of perceptions:
HISTOGRAM
bar chart
BUBBLE CHART
RADAR CHART
WATERFALL CHART
PIE CHART
LINE CHART
AREA CHART
TREE MAP
SCATTERPLOT
BOX PLOT
The most important visualization tools:
Tableau: This is the most popular tool for data visualization due to its reliance on scientific research, which improves analysis results with the required speed
BI Bower: An interactive program developed by Microsoft that is often used in business intelligence
Google Chart: It is widely used by the analyst community due to its provision of graphical visualizations
JupiterR: This web-based application features the convenience of creating and sharing documents with visualizations
So we conclude from the above that visualization is the process of showing data in a visual way without having to plan all the information
I hope that I have been successful in identifying the most important points that help a beginner in data science to stand on his feet and prove himself as a data scientist seeking to develop himself and refine his skills
It is certain that many of you, dear readers, have knowledge of other important points that I did not mention. Share them with us in the comments, Thank you.
Advertisements
إضاءة شاملة على ما يجب أن يتعلمه المبتدئ في علم البيانات
Advertisements
سبق وأن نوهنا في مقالات سابقة أن الوظيفة في علم البيانات هي حلم الكثيرين في الآونة الأخيرة، وأصبح هذا الأمر يتطلب مجهوداً في الحصول على خبرة ومعرفة كبيرين بسبب ارتفاع مستوى المنافسة للحصول على هذه الوظيفة
وأهم ركائز الخبرة المطلوبة ليس فقط معرفة الأدوات والتعامل معها بل من الضروري أن يمتلك عالِم البيانات فكرة شاملة عن المفاهيم والتقنيات الرئيسية واستخدامها فيما بعد وفق متطلبات العمل المراد إنجازه
في هذا المقال سنتقدم دليلاً إرشادياً شاملاً للمبتدئين المقبلين على تعلم علم البيانات
لنتعرف في البداية على مفهوم علم البيانات
علم البيانات بشكل مبسط هو تكامل مجموعة علوم كالرياضيات والإحصاء والبرمجة تؤدي عملها مع بعضها للحصول على رؤى مفيدة عند التعامل مع البيانات
:يتفرع عن علم البيانات العديد من العلوم ذات الصلة وتعد العلوم الآتية هي الأكثر شيوعاً نذكر منها
التعلم الآلي وتحليل البيانات وذكاء الأعمال والإحصائيات والرياضيات وغيرها من العلوم التي لم يعد انتشارها يخفى على أحد
:يُستفاد من علم البيانات وفق الميزات والتقنيات السابقة في عدة مجالات نذكر منها
ترجمة اللغة وتحليلات النص، فرز الصور، الاستشعار عن بعد وإدارة الخدمات الصحية
المهام الثلاث الأكثر شيوعاً في علم البيانات
محلل البيانات: تحليل البيانات لتكوين رؤى أفضل لقرارات العمل
عالِم البيانات: استخراج المعلومات المفيدة من البيانات الضخمة
مهندس بيانات: التعامل مع خطوط أنابيب البيانات
ما هي الطرق الأمثل لتعلم عمل البيانات؟
يتميز تعلم علم البيانات بأنه كلما تعمقت في دراسته أكثر كلما ازدادت الأفق المعرفية أمامك أكثر وستشعر بأن ما زال أمامك الكثير لتتعلمه، وبإمكانك كمتعلم مبتدئ أن تضع لنفسك خطة تدريبية تعينك على التعلم بمرونة وسهولة لتتجنب الوقوع في فخ الملل ثم اليأس كما يحصل مع الكثيرين ويمكنك من خلال هذه الخطة تنويع مصادر التعلم كالاستعانة بالدورات التدريبية عبر الإنترنت والاطلاع على الشهادات واختيار المناسب منها وهناك وسائل أخرى سنتطرق إليها لاحقاً
التعرف على المفاهيم الأساسية *
التعرف على الأدوات والبرامج اللازمة التي يستخدمها عالِم البيانات إضافة إلى التقنيات الرئيسية هي من أهم الضرورات التي يجب تعلمها
فتعلم لغة برمجة هو أهم الركائز الضرورية لبدء رحلة التعلم كلغة بايثون (أو أي لغة تختارها)، يجب عليك تعلمها إلى درجة الإتقان كما وأن قراءة المقالات المتعلقة بأساسيات البرمجة وتعلم كيفية كتابة الكودات البرمجية يساعدك على تمكين وترسيخ المعلومات التي تتلقاها
طريقة التعلم عن طريق تنفيذ المشاريع *
تعتبر هذه الطريقة هي الأفضل للتعلم فهي ستدخلك في بيئة العمل في علم البيانات فقيامك بتنفيذ المشاريع ستتشكل لديك الرؤى الواضحة وسيتكون عندك أسلوباً خاصاً بك في استنتاج الخيارات واستكشاف الحلول المناسبة
يتطلب تنفيذ المشاريع إجراء العديد من عمليات البحث وتنفيذ الدراسات ذات الصلة وينصح بالبدء بمشاريع بسيطة تناسب مستواك كمبتدئ، ومع التكرار المستمر والمتابعة الجيدة ستجد نفسك بدأت تتعلم مفاهيم أوسع لتنتقل إلى تنفيذ مشاريع أكثر تعقيداً فتزداد خبرتك ومهاراتك
ما هي أبرز النقاط التي يجب على عالِم البيانات المبتدئ أن يتعلمها؟
يجب عليك اختيار مجال تختص فيه في علم البيانات وبناءً عليه نذكر لك عدة مفاهيم يجب أن تتعلمها وتتقنها
1. المعرفة الشاملة
عليك أدراك العالم الواقعي من حولك عن طريق متابعة الأخبار التي تفيدك في مجال تعلمك ومواكبة كافة التحديثات والتقنيات، فمن خلال توظيف الأحداث من حولك في دراستك في مجال من مجالات علم البيانات يمكنك تحصيل الاستفادة القصوى من مجريات الأحداث من حولك
2. الرياضيات والإحصاء
الرياضيات
الجبر الخطي: هو فرع يفيد في التعلم الآلي لاعتماده على تشكيل المصفوفات التي هي ركيزة أساسية في التعلم الآلي، بحيث تمثل المصفوفة مجموعة البيانات
* الاحتمالات: يفيد هذا الفرع من الرياضيات في التنبؤ بالنتائج الجهولة لحدث معين
التفاضل والتكامل: يفيدان في جمع الفروق الصغيرة لتحديد مشتقات وتكاملات الوظائف وهذا يظهر في التعلم العميق والتعلم الآلي
الإحصاء
الإحصاء الوصفي: يشمل (المتوسط والوسيط والإحصاءات المقطوعة والإحصاءات الموزونة) وتعتبر هذه بداية مراحل تحليل البيانات الكمية المتشكلة على هيئة مخططات ورسوم بيانية
الإحصاء الاستدلالي: تشمل تحديد مقاييس العمل اختبارات أ وَ ب وإنشاء اختبارات الفرضيات والقيمة الاحتمالية وقيم ألفا لتحليل البيانات المجمعة
3. التعامل مع قواعد البيانات
عند التطرق إلى الحديث عن هندسة البيانات فيجدر بنا التنويه إلى التقاطع بين عالم البيانات ومهندس البيانات، بحيث يتم إنشاء خطوط أنابيب لجميع البيانات من عدة مصادر وتخزينها في مستودع بيانات واحد
SQL وكمبتدئ ينصح بتعلم
One RDBMS ومن ثم الانتقال إلى نظام
One NoSQL و MySQL مثل
Advertisements
4. لغة بايثون والتعرف على مكتباتها
وهي اللغة الأكثر استخداماً في البرمجة للاستخدام اللاحق في تحليلات البيانات نظراً لبساطتها من حيث بناء الكودات وتنظيم الجُمل
وهي تمتلك العديد من المكتبات
NumPy و Pandas و Matplotlib و Scikit-Learn مثل
ما يتيح لعالِم البيانات باستخدام البيانات بفاعلية أكبر
يوجد دورات تدريبية للمبتدئين في بايثون
Coursera أو Udemy على
يمكن الاستفادة منها في تعلم مبادئ بايثون
5. تنظيف البيانات
وهي مَهمة تستهلك بالنسبة للمبتدئين كثيراً من الوقت لكن لابد من تنفيذها وذلك من أجل الحصول على تحليل بيانات جيد ناتج عن بيانات نظيفة
وللتوضيح بشكل تفصيلي عن تنظيف البيانات يمكنك قراءة مقال شامل من خلال هذا الرابط
6. تحليل البيانات الاستكشافية
يقصد بهذا النوع من التحليل اكتشاف حالات الشذوذ في البيانات واختبار الفرضيات بمساعدة الإحصاءات والرسوم البيانية
كمبتدئ يمكنك استخدام بايثون
وفق الخطوات التالية EDA لإجراء
جمع البيانات: تتضمن جمع البيانات الدقيقة من مصادر متعددة وقياسها وتحليلها بغية إيجاد حل لمشكلة معينة
تنظيف البيانات: استكشاف البيانات غير الصحيحة وإصلاحها
التحليل أحادي المتغير: وهي عملية تحليل تعتمد على تغير واحد دون التطرق إلى العلاقات المعقدة والهدف منها وصف البيانات وتحديد الأنماط الموجودة
التحليل الثنائي المتغير: تجري هذه العملية مقارنة بين متغيرين لتحديد كيفية تأثير الميزات على بعضها البعض لإجراء التحليل وتحديد الأسباب
7. التصور
أحد أهم الدعائم الأساسية لكافة مشاريع تحليل البيانات، فالتصور هو تقنية تجعل من رؤية البيانات بشكل واضح وفعال في النهاية، والوصول إلى نتائج فعالة في التصور يعتمد على امتلاك المجموعة الصحيحة من التصورات لأنواع البيانات المختلفة
:أنواع التصورات
HISTOGRAM
BAR CHART
BUBBLE CHART
RADAR CHART
WATERFALL CHART
PIE CHART
LINE CHART
AREA CHART
TREE MAP
SCATTERPLOT
BOX PLOT
:أهم أدوات التصور
:Tableau
تعد هذه الأداة الأكثر شيوعاً في تصور البيانات لاعتمادها على البحث العلمي مما يحسن نتائج التحليل بالسرعة المطلوبة
:Bower BI
برنامج تفاعلي مطوَّر من قِبَل شركة مايكروسوفت يستخدم غالباً في ذكاء الأعمال
:Google Chart
يستخدم بكثرة عند مجتمع المحللين نظراً لما يوفره من إنتاج التصورات الرسومية
:JupiterR
يعتمد هذا التطبيق على الويب ويتميز بأنه يتيح إنشاء المستندات التي تتضمن التصورات ومشاركتها بكل أريحية
إذاً نستنتج مما سبق أن التصور هو عملية إظهار البيانات بشكل مصوَّر مرئي دون الحاجة إلى تخطيط جميع المعلومات
أرجو أن أكون قد وُفِّقت في تحديد أكثر النقاط أهمية والتي تعين المبتدئ في علم البيانات على الوقوف على قدميه وإثبات نفسه كعالِم بيانات يسعى إلى تطوير ذاته وصقل مهاراته
من المؤكد أن كثيراً منكم أعزاءي القراء لديهم المعرفة بنقاط هامة أخرى لم أقم بذكرها شاركونا بها في التعليقات ولكم الشكر
Data sets often contain errors or inconsistencies, especially when collected from multiple sources. In these cases, it is necessary to organize that data, correct errors, remove redundant entries, work to organize and format data, and exclude outliers. These procedures are called data cleaning.
The purpose of data cleaning
This process aims to detect any defect in the data and deal with it from the beginning, thus avoiding wasting time spent on arriving at incorrect results
In other words, early detection and fixing of errors leads to correct results
This fully applies to data analysis. Going with clean and formatted data enables analysts to save time and get the best results.
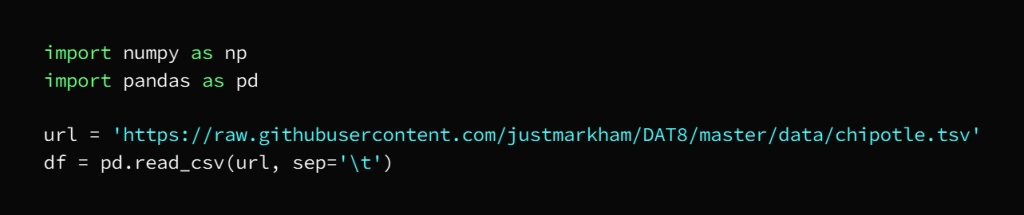
Here is an example showing the stages of data cleaning:
In this example we used Jupyter Notebook to run Python code inside Visual Studio Code
This stage aims to identify the data structure in terms of type and distribution in order to detect errors and imbalances in the data
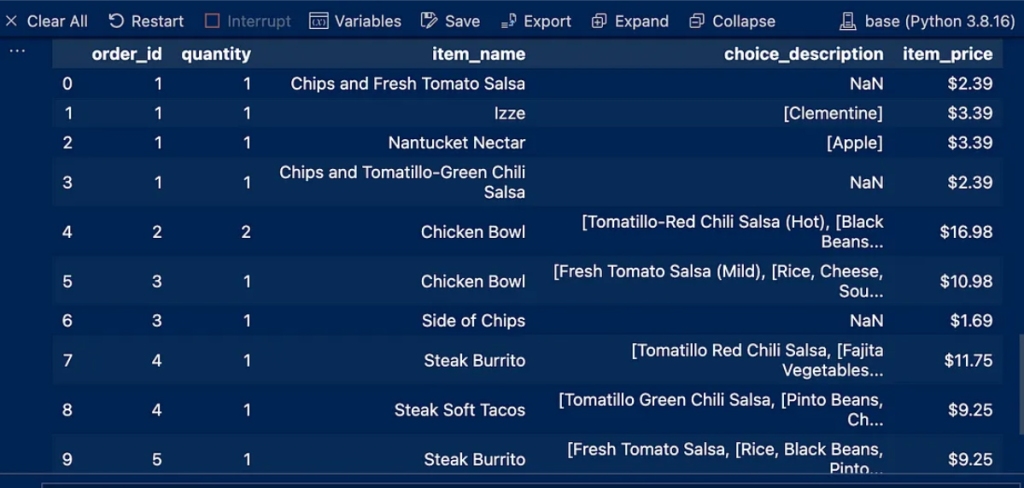
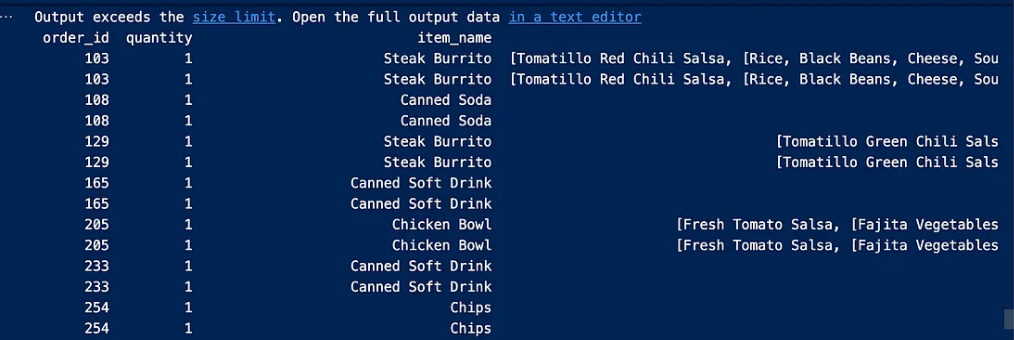
This process will print the first and last 10 entries of the dataset and thus determine the applicable dataset type so that you choose the first or last entry according to the desired purpose and then output using df.head(10)
We notice some NaN entries in the Choice_description column
and a dollar sign in the item_price column
B. Data types of columns
You must now determine what type of data is in each column
In the following code, we define the column names and data types in an organized and coordinated manner
The output is:
Advertisements
The third stage: data cleaning
a. Change the data type
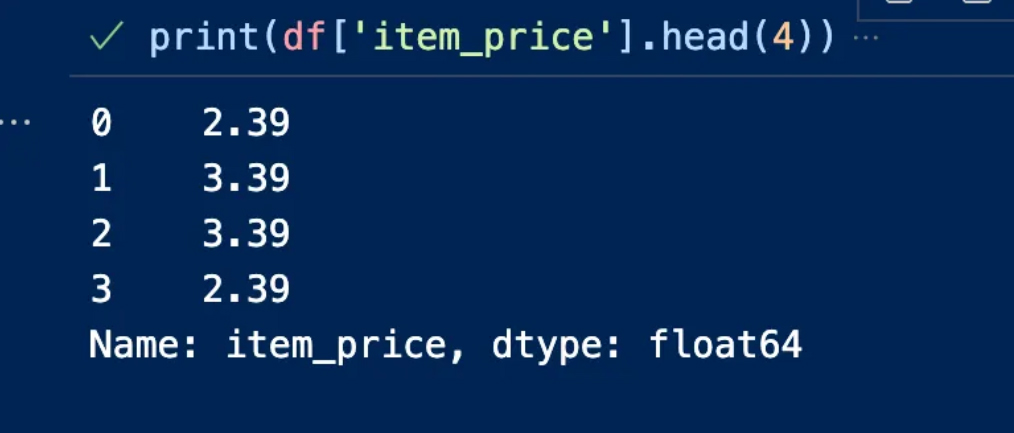
If the work requires converting data types, this is done while monitoring the data
In our example item_price includes a dollar sign, we can remove it and replace it with float64 because it contains a decimal number
B. Missing or empty values
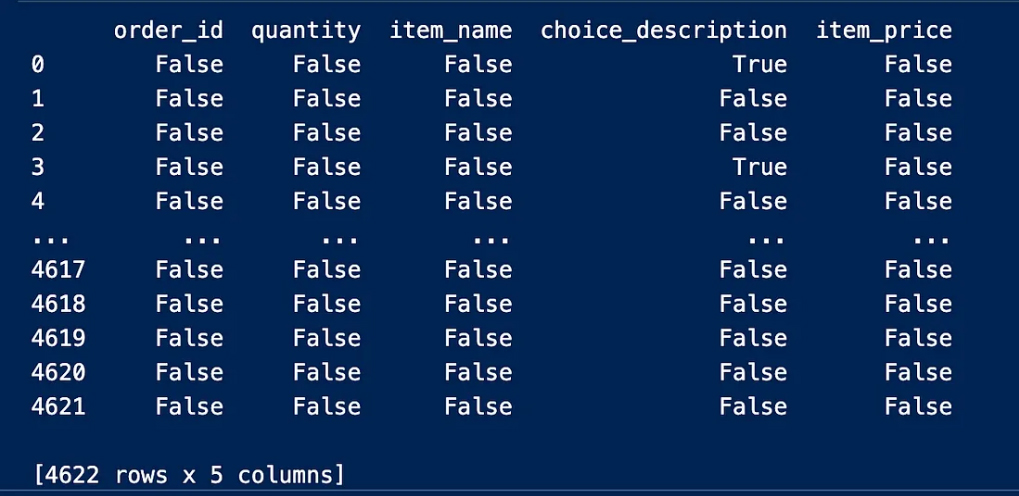
The stage of searching for missing values in the data set comes:
The output is:
We notice from the output result above that the null value is represented by True, while False does not represent null values We’ll have to find the number of null entries in the table using the sum because we won’t be able to see all the real values in the table
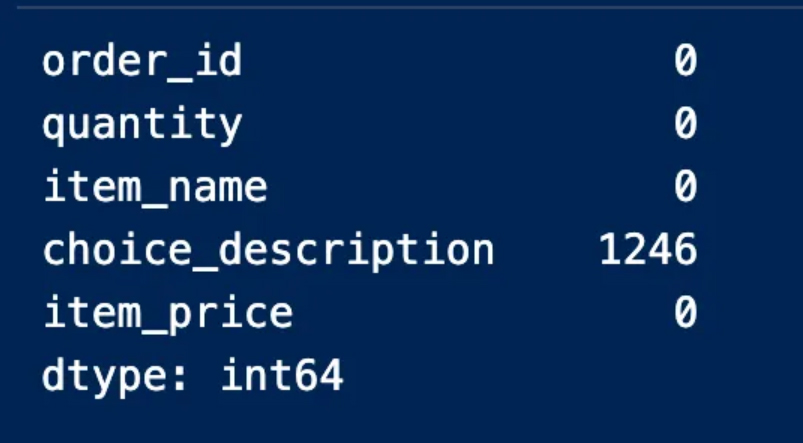
This procedure indicates to us the columns that contain null values and the number of them is empty. We can also note that the “option_description” column is the column that contains empty entries and 1246 of them are empty
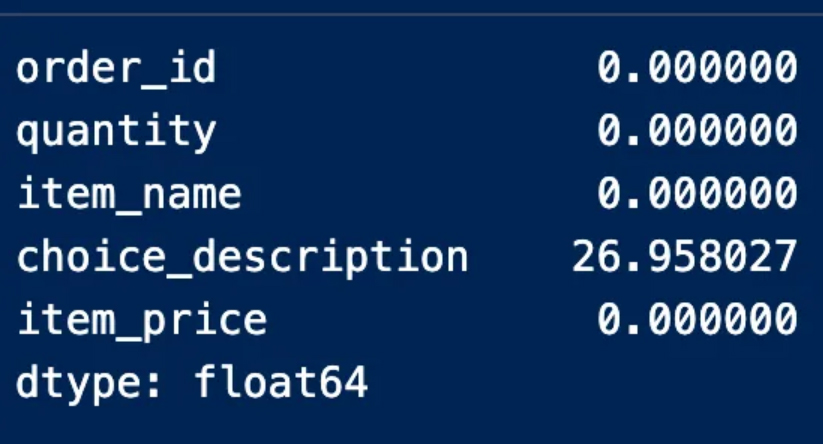
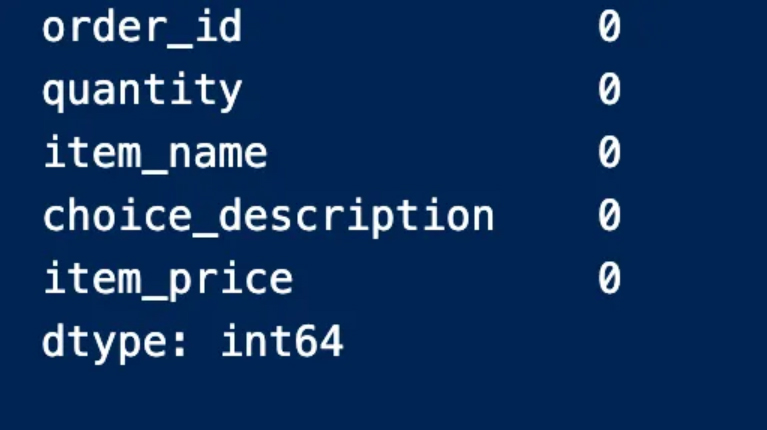
We can also determine the presence of null values for each column and find the number as in the following image
We then proceed to find the missing values for each column
In our example, we notice that only one column contains null values
It should be noted here that it is necessary to calculate the percentage of the values in each column because, especially in the case of large data, it is possible that there will be empty values within several columns.
The output is:
We find here that the description column contains missing values by 27%, and this percentage does not necessitate deleting the entire column because it did not exceed 70%, which is the percentage of missing values that if found in a column, it is preferable to get rid of it
Another approach to dealing with missing values when cleaning data is to depend on the type of data and the defect to be addressed
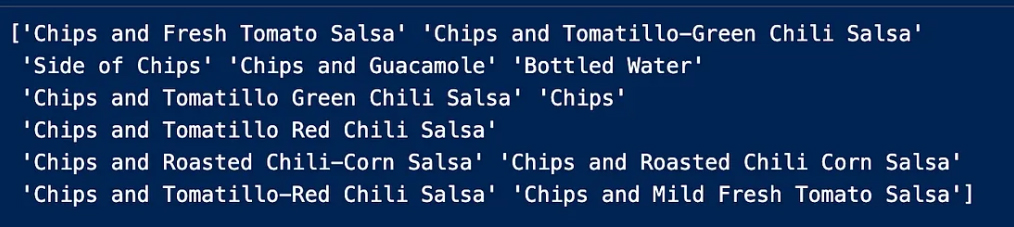
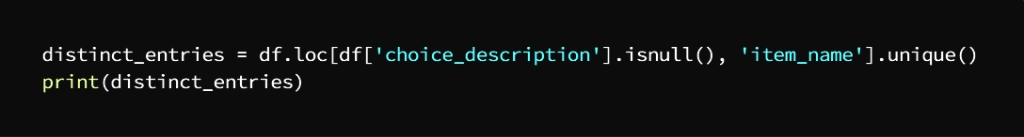
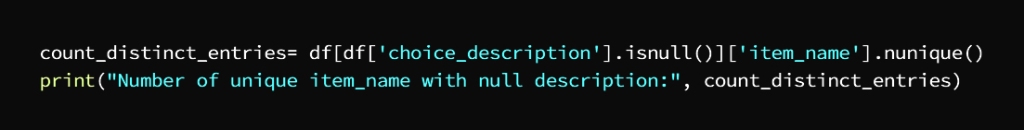
To further clarify we have the column “choice_description” and to understand what the problem is we check the unique entries in this column to get more solutions
Now we make sure how many choice_description contains choice_description
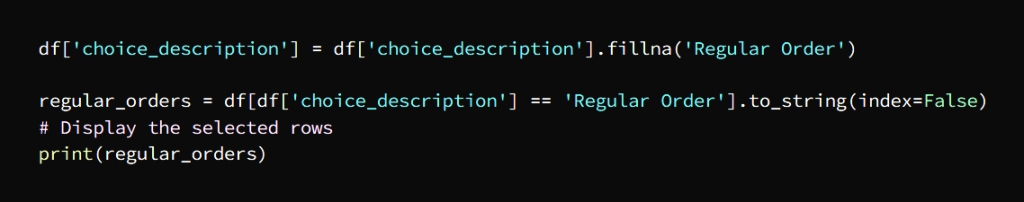
Considering that the missing values are for the customer’s choice, they can be replaced on the assumption that these customers did not give details of their requests, so we replace the missing values with “Regular”.
And replace the null values with “Regular Order”
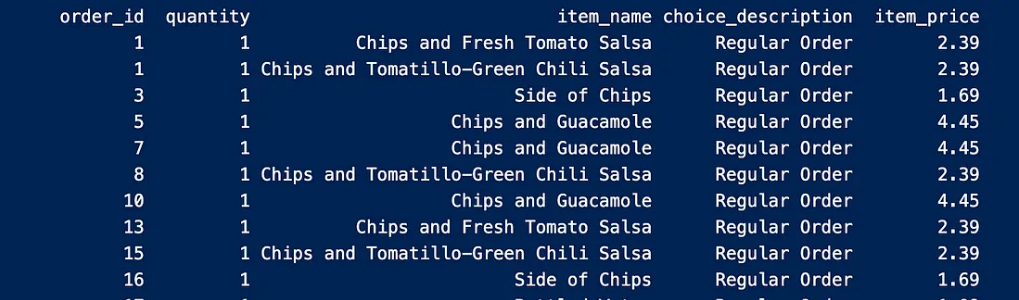
The output is:
Now let’s make sure that there are null values
By replacing null values with their descriptions, we got rid of all the missing values and began to improve our data
B. Remove redundancy
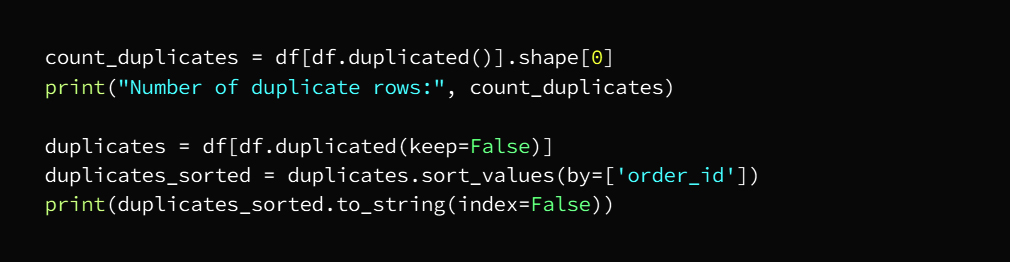
Now we will check the number of duplicate entries and then get rid of them and this deletion is not done if at least one of the entries is different from row to row as duplicate entries mean that all rows are exactly the same as the other row
We can check by running the code
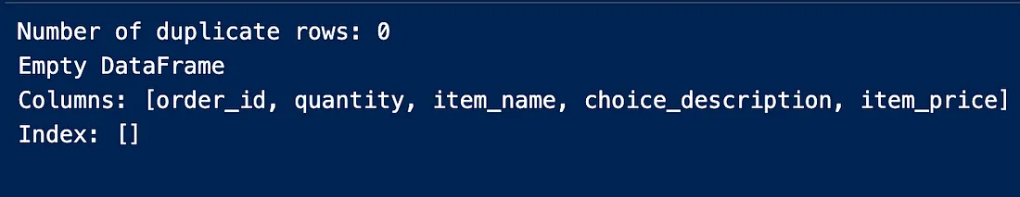
The output is:
We will now delete duplicate entries
As a precautionary step we will make sure that there are no duplicate entries again
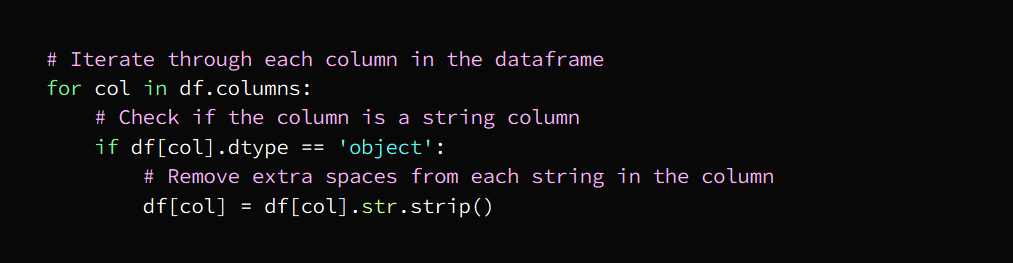
c. Delete extra spaces
That is, getting rid of spaces, extra spaces that are useless between letters and words
This task can be carried out by them:
String processing functions
regular expressions
Data cleaning tools
Fourth stage: data export
This step involves exporting the clean data keeping in mind that in our example we are working on a narrow and simplified scale
This code writes the cleaned data to a new CSV file named cleaned_data.csv
In the same path as our Python script with the ability to modify the file name and path as required
The argument index = False indicates that pandas does not include row index numbers in the exported data.
Fifth stage: data visualization using Tableau
We have reached the end of the data filtering journey with the clean data which we will export to visualization and now ready for easy analysis
Advertisements
ما هو مفهوم تنظيف البيانات؟
Advertisements
تنظيف البيانات
غالباً ما تحتوي مجموعات البيانات على أخطاء أو تناقضات وخصوصاً عند تجميعها من مصادر متعددة ففي هذه الحالات من الضروري تنظيم تلك البيانات وتصحيح الأخطاء وإزالة الإدخالات المتكررة والعمل على تنظيم وتنسيق البيانات واستبعاد القيم المتطرفة، هذه الإجراءات تسمى تنظيف البيانات
الهدف من تنظيف البيانات
تهدف هذه العملية إلى اكتشاف أي خلل في البيانات والتعامل معه منذ البداية مما يجنِّب هدر الوقت المستهلك في الوصل إلى نتائج غير صحيحة
وبمعنى آخر، اكتشاف الأخطاء وإصلاحها في وقت مبكر يوصلنا إلى نتائج صحيحة بشكل مؤكد
وهذا ينطبق تماماً على تحليل البيانات فالمضي ببيانات نظيفة ومنسقة يمكِّن المحللين من توفير الوقت والحصول على أفضل النتائج
تهدف هذه المرحلة إلى التعرف على بنية البيانات من حيث النوع والتوزيع بغية اكتشاف الأخطاء والخلل في البيانات
بهذه العملية سيتم طباعة الإدخالات العشرة الأولى والأخيرة من مجموعة البيانات وبالتالي تحديد نوع مجموعة البيانات المعمول بها بحيث تختار الإدخال الأول أو الأخير وفق الغرض المطلوب
df.head(10) ثم الناتج باستخدام
NaN نلاحظ بعض إدخالات
Choice_description في عمود
item_price وعلامة الدولار في عمود
ب. أنواع بيانات الأعمدة
لابد الآن من تحديد نوع البيانات الموجودة في كل عمود
في الكود التالي يتحدد لدينا أسماء الأعمدة وأنواع البيانات بأسلوب منظم ومنسق
: النتيجة
Advertisements
المرحلة الثالثة: تنظيف البيانات
أ. تغيير نوع البيانات
إذا تطلب العمل تحويل أنواع البيانات فيتم ذلك أثناء مراقبة البيانات
علامة الدولار item_price وفي مثالنا يتضمن
float64 نستطيع إزالته واستبداله بـ
لاحتوائه على رقم عشري
ب. القيم المفقودة أو الفارغة
تأتي مرحلة البحث عن القيم المفقودة في مجموعة البيانات
النتيجة
نلاحظ من نتيجة الإخراج أعلاه
True أن القيمة الخالية متمثلة بـ
False بينما لا يمثل
قيماً خالية سنضطر إلى البحث عن عدد الإدخالات الخالية في الجدول باستخدام المجموع لأننا لن نستطيع رؤية كل القيم الحقيقية الموجودة في الجدول
يدلنا هذا الإجراء على الأعمدة التي تتضمن قيم خالية وعددها فارغ ويمكن أن نلاحظ أيضاً
“option_description” أن العمود
هو العمود الذي يحوي إدخالات فارغة و1246 منها خالية
كما ويمكننا تحديد وجود القيم الخالية لكل عمود مع إيجاد الرقم كما في الصورة التالية
ثم نتوجه إلى العثور على القيم المفقودة لكل عمود
وفي مثالنا نلاحظ أن عمود واحد فقط يتضمن قيم فارغة
يجدر التنويه هنا إلى أنه من الضروري حساب النسبة المئوية للقيم الموجودة في كل عمود لأنه وخصوصاً في حالة وجود بيانات ضخمة فمن المحتمل وجود قيم فارغة ضمن عدة أعمدة
النتيجة
description نجد هنا أن عمود
يحوي قيم مفقودة بنسبة 27% وهذه النسبة لا تستوجب حذف العمود بأكمله لأنها لم تتجاوز 70% وهي نسبة القيم المفقودة التي إن وجدت في عمود فيفضل التخلص منه ومن الطرق الأخرى المتبعة في التعامل مع القيم المفقودة عند تنظيف البيانات الاعتماد على نوع البيانات والخلل المطلوب معالجته
“choice_description”ولمزيد من التوضيح لدينا العمود
ولفهم ماهية المشكلة نتحقق من الإدخالات الفريدة في هذا العمود لنحصل على مزيد من الحلول
choice_description نتأكد الآن من عدد
choice_description الذي يتضمن
على اعتبار أن القيم المفقودة مخصصة لاختيار العميل فيمكن استبدالها على فرض أن هؤلاء العملاء لم يعطوا تفصيلاً عن طلباتهم
” Regular” فنستبدل القيم المفقودة بـ
” Regular Order” ونستبدل القيم الخالية بـ
النتيجة
ولنتأكد الآن من وجود قيم خالية
وعن طريق استبدال القيم الخالية بالأوصاف الخاصة بها تخلصنا من جميع القيم المفقودة وهكذا بدأنا بتحسين بياناتنا
ب. إزالة التكرار
سنتحقق الآن من عدد الإدخالات المكررة لنقوم بعد ذلك بالتخلص منها وعملية الحذف هذه لا تتم إذا كان أحد الإدخالات على الأقل مختلفاً من صف إلى آخر حيث أن الإدخالات المتكررة تعني أن جميع الصفوف متطابقة تماماً مع الصف الآخر
يمكننا التحقق من خلال تشغيل الكود
النتيجة
سنقوم الآن بحذف الإدخالات المتكررة
كخطوة احترازية سنتأكد من عدم وجود إدخالات مكررة مرة أخرى
ج. حذف المسافات الزائدة
أي التخلص من المسافات الفراغات الإضافية التي لا فائدة منها بين الأحرف والكلمات
ويمكن أن تنفذ هذه المهمة منها
وظائف معالجة السلاسل
التعبيرات العادية
الأدوات المخصصة لتنظيف البيانات
المرحلة الرابعة: تصدير البيانات
هذه الخطوة تتضمن تصدير البيانات النظيفة مع الأخذ بعين الاعتبار أننا في مثالنا نعمل على نطاق ضيق ومبسط
يعمل هذا الكود على كتابية البيانات المنظفة
cleaned_data.csv جديد اسمه CSV إلى ملف
في نفس المسار مثل نص بايثون الخاص بنا مع إمكانية تعديل اسم الملف والمسار حسب المطلوب
index = False تدل الوسيطة
أن “باندا” لا تقوم بتضمين أرقام فهرس الصفوف في البيانات المصدرة
المرحلة الخامسة: تصور البيانات باستخدام تابلو
وصلنا إلى نهاية رحلة تصفية البيانات بحصولنا على البيانات النظيفة والتي سنصدرها إلى التصور فهي الآن جاهزة لإجراء عملية التحليل بسهولة
The data science employee in his first appointment period often suffers from some difficulties that are embodied in some chaos, instability, lack of organization, and perhaps difficulty in adapting and confusion, especially in the early days, at the very least, but the new employee must overcome these obstacles, which, in my opinion, are a normal condition. His first steps towards success and development
What we will discuss in this article is how to create the right conditions for building a successful team in the data science job
Co-workers are the environment that helps each person in this group to progress and develop at their various levels, and as a junior employee, your colleague, who was hired a short time ago, will help you answer beginners’ questions, and soon you will have an idea of the basics of the work system for the job, and as your activity grows and develops Your level You can start the stage of receiving ideas about a group of experiences and skills from those older than you in the job with experience and competence at work until you find in yourself that experienced employee who can discuss with his manager on deeper and more accurate topics, as the manager in general tends to the employee who offers suggestions and initiates To the effective discussion by expressing valuable opinions and providing feasible solutions.
You must agree with me that if we look at any successful functional community, whether it is a company, an institution, or even within the private sector, we see that the basis for success lies in the spirit of cooperation and love among the team members at different levels and degrees.
At the beginning of talking about the incorporation stages, especially in the first month of the job, we recommend asking a lot of questions, as it is an ideal period for receiving information, setting priorities and learning vocabulary, by following the following instructions:
1. Be sure to join the guidance units provided by your company, which are dedicated to guiding new employees, as they are capable of informing you of the company’s policy and approach in terms of privacy, security and ethics, and you will also be able to request comprehensive guides for what you need.
2. Always seek information about the team’s work so that you can keep up with the work with them, through continuous communication with your manager and try to make suggestions that contribute to the progress of the company’s work, and try to know the type of challenges that the company faces to start building a successful plan based on your skills and method to overcome problems and face the challenges.
3. Take advantage of the opportunity when there are no internal repositories to publish analytics suites, collect examples and create one so that these repositories become very important to the team and future employees, and do not miss out on getting to know the previous work or project of the company – that is, before your appointment period – to have an idea of how it works Upcoming projects.
4. Try to stay abreast of current issues in the company by joining e-mail subscriptions and other chat platforms. Joining these channels, getting to know their users, and sharing ideas and experiences with them helps you gain more experience.
5. Make sure to introduce yourself in front of your manager and your colleagues through the meetings, and try briefly to present some of your work and projects that you have undertaken and the solutions that you presented during the implementation of the projects. It will increase their confidence in you.
We have already explained in a previous article how to build a business portfolio in the field of data science. For information, click here
6. It is necessary to know the main contacts in the company so you should request a list of contacts from your manager or colleagues
Advertisements
Start building your own data science ecosystem
1. The first step is to prepare your computer with login and remote access information, download the necessary software for your business, get technical support, and don’t forget the necessary equipment and devices
2. It is very important that you obtain the information as soon as possible after your appointment, as the processing takes some time and the time factor here is very important. You should take the initiative directly to ask your manager and those in charge of the work about the data sets that you need to communicate with them and ask for a list of websites that you may need in your business
3. Definitely don’t forget to download the software that your team relies on to work continuously, such as programming languages and data visualization tools
4. Understanding (domain): It is very necessary to help you ensure that the data is interpreted correctly when doing analysis or using a machine learning model The proficiency stage After completing the correct preparation and preparation stage, you must establish yourself and
prove your competence by following these steps:
1. Start your career journey by getting to know your colleagues and introducing yourself to them, such as asking your manager to work with them by appointing you to the team. Share your opinions and experiences with them, even if they are modest. This will help them determine the level of interaction with you and will help build a spirit of cooperation and participation among team members.
2. The first impression is the effect that will be imprinted on your colleagues from the first meeting, whether it is at the level of your morals or your scientific level. In terms of ethics and dealing, people generally tend towards a humble, loving and tolerant person, and they rush to gain his friendship to be close to him. As for the scientific level, when your colleagues find you A person who loves to cooperate and share ideas and experiences will be an ideal person and a model for an efficient employee
3. Let others know about the nature of your work and your main mission in the company, and keep them up to date with your work style and achievements, such as placing links in newsletters and presenting them to the team
Finally..
I believe that by following these steps it is possible to overcome the most difficult period in the appointment stage for a new job, and this is what came to my mind regarding the matters that necessitated that.
My friends If you, think that there are things that we did not mention that may help in establishing a successful work team, then share them with us in the comments so that we can apply what we have previously read on the ground and build a small team whose members exchange information and experiences between the publisher and the recipient .. Thank you.
Advertisements
مراحل التجهيز لبناء فريق عمل ناجح في علم البيانات
Advertisements
غالباً ما يعاني موظف علم البيانات في فترة تعيينه الأولى من بعض الصعوبات التي تتجسد ببعض الفوضى وعدم الاستقرار وقلة التنظيم ولربما صعوبة التأقلم والارتباك خصوصاً في الأيام الأولى على أقل تقدير، ولكن لابد للموظف الجديد أن يتجاوز هذه العراقيل التي هي باعتقادي حالة طبيعية فتجاوز هذه المرحلة يعتبر أولى خطواته نحو النجاح والتطور
وما سنتناوله في مقالتنا هذه هو كيفية تهيئة الظروف المناسبة لبناء فريق عمل ناجح في وظيفة علم البيانات
يعتبر زملاء العمل هم البيئة التي تساعد كل شخص في هذه المجموعة على التقدم والتطور وعلى مختلف مستوياتهم، وكونك موظف مبتدئ ليعينك زميلك الذي تم تعيينه منذ فترة وجيزة على الإجابة عن أسئلة المبتدئين وسرعان ما تتشكل لديك فكرة عن أساسيات منظومة العمل للوظيفة، ومع نمو نشاطك وتتطور مستواك يمكن أن تبدأ مرحلة تلقي أفكار حول مجموعة خبرات ومهارات ممن هم أقدم منك في الوظيفة من ذوي الخبرة والكفاءة في العمل إلى أن تجد في نفسك ذلك الموظف المتمرس الذي بإمكانه مناقشة مديره في مواضيع أعمق وأدق، فالمدير بشكل عام يميل إلى الموظف الذي يقدم الاقتراحات ويبادر إلى المناقشة الفعالة عن طريق إبداء الآراء القيمة وتقديم الحلول المجدية
ولابد أنكم تتفقون معي بأننا إذا نظرنا إلى أي مجتمع وظيفي ناجح شركة كانت أم مؤسسة أو حتى ضمن القطاع الخاص نرى أن أساس النجاح يكمن روح التعاون والمحبة بين أعضاء الفريق على اختلاف على مستوياتهم وشهاداتهم
وفي مستهل الحديث عن مراحل التأسيس وخصوصاً في الشهر الأول من الوظيفة ننصح بالإكثار من الأسئلة فهي فترة مثالية لتلقي المعلومات وتحديد الأولويات وتعلم المفردات وذلك من خلال اتباع الإرشادات التالية
احرص على الانضمام إلى الوحدات الإرشادية التي تقدمها شركتك وهي مخصصة لتوجيه الموظفين الجدد فهي كفيلة بإطلاعِك على سياسة الشركة ونهج عملها من ناحية الخصوصية والأمن والأخلاق، كما وسيكون بإمكانك طلب أدلة إرشادية شاملة بما تحتاجه
اسعى دائماً للحصول على معلومات تخص عمل الفريق لكي تتمكن من مواكبة العمل معهم وذلك عن طريق التواصل المستمر مع مديرك ومحاولة تقديم اقتراحات تسهم في تقدُّم عمل الشركة، وحاول معرفة نوع التحديات التي تواجهها الشركة لتبدأ ببناء خطة ناجحة معتمداً على مهاراتك وأسلوبك للتغلب على المشاكل ومواجهة التحديات
اغتنم الفرصة في حال عدم وجود مستودعات داخلية لنشر مجموعات التحليلات وقم بجمع الأمثلة وإنشاء واحدة بحيث تصبح هذه المستودعات مهمة جداً للفريق والموظفين المستقبليين ولا تفوت على نفسك التعرف على العمل أو المشروع السابق للشركة – أي قبل فترة تعيينك – لتتكون لديك فكرة عن آلية عمل المشاريع القادمة
حاول البقاء على اطلاع مستمر على المواضيع الحالية في الشركة وذلك عن طريق الانضمام إلى اشتراكات البريد الإلكتروني ومنصات الدردشة الأخرى فانضمامك لهذه القنوات والتعرف على روداها ومشاركتهم الأفكار والخبرات يساعدك اكتساب مزيد من الخبرة
احرص على تقديم نفسك أمام مديرك وزملائك من خلال الاجتماعات وحاول بإيجاز طرح بعض أعمالك ومشاريعك التي قمت بها والحلول التي قدمتها خلال قيامك بالمشاريع أي باختصار أعطِ نظرة مبسطة عن إنجازاتك كتلك التي تحدثت عنها أثناء المقابلة، فاطلاع مديرك وزملائك على محفظة أعمالك سيرفع رصيدك العملي وسيزيد ثقتهم بك
وقد كنا قدر شرحنا في مقال سابق كيفية بناء محفظة أعمال في مجال علم البيانات للاطلاع اضغط هنا
من الضروري التعرُّف على جهات الاتصال الرئيسية في الشركة لذا يجب عليك طلب قائمة بجهات الاتصال من مديرك أو زملائك
Advertisements
ابدأ بتجهيز منظومة عملك الخاصة بعلوم البيانات
الخطوة الأولى هي إعداد الكمبيوتر الخاص بك ورفده بمعلومات تسجيل الدخول والوصول عن بعد، قم بتنزيل البرامج اللازمة لعملك واحصل على الدعم الفني ولا تنسى المعدات والأجهزة اللازمة
من المهم جداً أن تحصل على المعلومات في أسرع وقت ممكن بعد تعيينك إذ أن المعالجة تحتاج لبعض الوقت وعامل الوقت هنا مهم جداً، عليك المبادرة مباشرةً بسؤال مديرك والقائمين على العمل عن مجموعات البيانات التي تلزمك للتواصل معهم واطلب قائمة بمواقع الويب التي قد تحتاجها في عملك
بالتأكيد لا تنس تحميل البرامج التي يعتمد عليها فريقك في العمل بشكل مستمر كلغات البرمجة وأدوات تصور البيانات
فهم (الدومين): فهو أمر ضروري جداً يعينك على ضمان تفسير البيانات بشكل صحيح عند القيام بعمليات التحليل أو استخدام نموذج التعلم الآلي
مرحلة إثبات الكفاءة
بعد إتمامك لمرحلة التجهيز والإعداد الصحيحين يتوجب عليك تثبيت نفسك وإثبات كفاءتك وذلك باتباع الخطوات التالية
ابدأ رحلتك الوظيفية بالتعرف على زملائك وعرفهم عن نفسك كأن تطلب من مديرك أن يعملهم بتعيينك معهم في الفريق شاركهم آراءك وخبراتك ولو كانت متواضعة فهذا سيساعدهم على تحديد مستوى التفاعل معك وسيساعد في بناء روح التعاون والمشاركة بين أعضاء الفريق
الانطباع الأول هو الأثر الذي سينطبع عند زملائك منذ اللقاء الأول سواء كان على مستوى أخلاقك أو مستواك العلمي، فمن ناحية الأخلاق والتعامل يميل الناس بشكل عام نحو الشخص المتواضع والمحب والمتسامح ويسارعون لاكتساب صداقته ليكونوا مقربين منه، أما على المستوى العلمي فعندما يجد زملاؤك فيك الشخص المحب للتعاون وتشارك الأفكار والخبرات فستكون بنظرهم شخصاً مثالياً ونموذجاً للموظف الكفؤ
دع الآخرين يتعرفون على طبيعة عملك ومهمتك الأساسية في الشركة وابقهم على اطلاع دائم بأسلوب عملك وإنجازاتك كأن تضع روابط في الرسائل الإخبارية وتقدمها إلى الفريق
أخيراً.. أعتقد أنه باتباع هذه الخطوات يمكن تجاوز الفترة الأصعب في مرحلة التعيين في وظيفة جديدة، وهذا ما وصل إلى ذهني من أمور تعين على ذلك
إن كنتم أصدقائي ترون أن هناك أمور لم نتطرق إلى ذكرها قد تساعد على تأسيس فريق عمل ناجح فشاركونا فيها في التعليقات لنطبق ما قرآناه سابقاً على أرض الواقع ونبني فريقاً مصغراً يتبادل أعضاؤه المعلومات والخبرات بين الناشر والمتلقي .. وشكراً
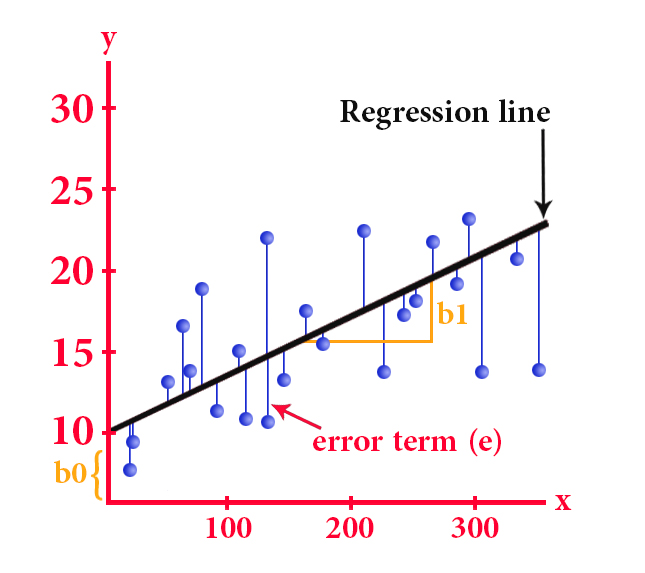
This term stands for a process of statistical analysis to test the relationship between two continuous variables, the first is independent and the second is one dependent
This type of statistics is used to find the best line through a set of data points that in turn will reveal the best future predictions
The simple linear regression equation is as follows:
y = b0 + b1*x
y is the dependent variable
x represents the independent variable
b0 represents the y-intercept (the point of intersection of the y-axis with the line)
b1 represents the slope of the line
And by the method of least squares, we can get the most appropriate line, that is, the line that reduces the sum of the square differences between the actual and expected values of the value of y
We can also customize the work of linear regression to expand it to several independent variables, then it is called multiple linear regression, whose equation is as follows:
y = b0 + b1x1 + b2x2 +… + bn * xn
x1, x2, …, xn represent the independent variables
b1, b2, …, bn represent the corresponding variables
As mentioned above, linear regression is useful for obtaining future predictions, as is the case when predicting stock prices or determining future sales of a specific product, and this is done by making predictions about the dependent variable
However, there are cases in which the regression model is not very accurate, in the event that there are extreme values that do not take the direction of the data in general
In order to show the optimal treatment in linear regression in the presence of extreme values, the following figure is given
– Neutralizing outliers from the data set before training the model
– Minimize the effect of outliers by applying a transform as taking a data log
Use powerful regression methods such as RANSAC or Theil-Sen because they mitigate the negative impact of outliers more effectively than traditional linear regression.
However, it cannot be denied that linear regression is an effective and commonly used statistical method
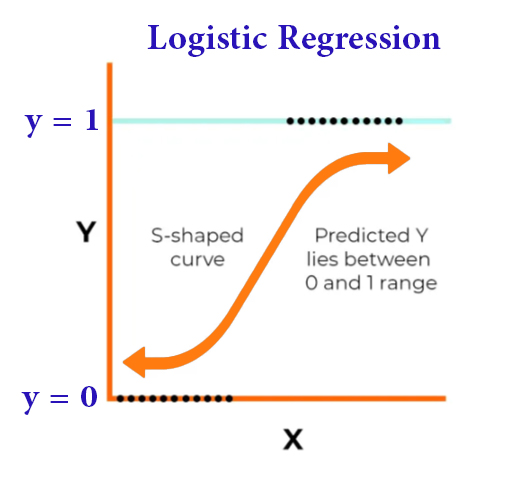
2. Logistic regression
It is a statistical method used to obtain predictions for options that bear two options, i.e. binary outcome, by relying on one or more independent variables, and this regression has a role in classification and sorting functions, such as predicting customer behavior and other tasks.
The work of logistic regression is based on a sigmoid function that sets the input variables to a probability between 0 and 1, and then comes the role of the prediction to get the possible outcome
Logistic regression is represented by the following equation:
P(y = 1|x) represents the probability that the outcome of y is 1 compared to the input variables x
b0 represents the intercept
b1, b2, …, bn represent the coefficients of the input variables x1, x2, …, xn
By training the model on a data set and using the optimization algorithm, the coefficients are determined and then used to make predictions by entering new data and calculating the probability that the result is 1
In the following diagram we see the logistic regression model
By examining the previous diagram , we find that the input variables x1 and x2 were used to predict the result y that has two options.
This regression is tasked with assigning the input variables to a probability that will determine in the future the shape of the expectation of the outcome
The coefficients b1 and b2 are determined by training the model on a data set and setting the threshold to 0.5.
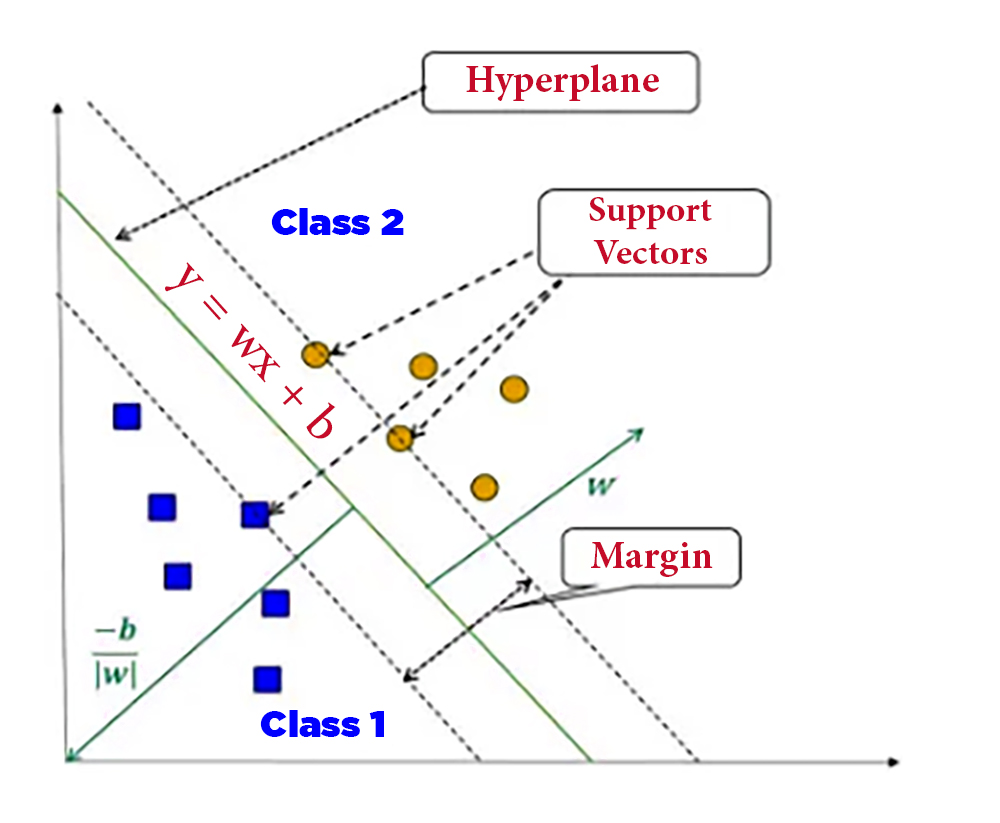
3. Support Vector Machines (SVMs)
SVM is a powerful algorithm for both classification and regression. It divides data points into different categories by finding the optimal level with maximum margin. SVMs have been successfully applied in various fields, including image recognition, text classification, and bioinformatics.
The cases where SVMs are used are when the data cannot be separated by a straight line, this channel can distribute the data over a high-dimensional swath to facilitate the detection of nonlinear boundaries
SVMs have proven memory utilization, they focus on storing only the support vectors without the entire data set, and they are highly efficient in high-dimensional spaces even if the number of features is greater than the number of samples
This technique is strong against outliers due to its dependence on support vectors
However, one of the drawbacks of this technique is that it is sensitive to kernel function selection, and it is not effective for large data sets, as its training time is often very long.
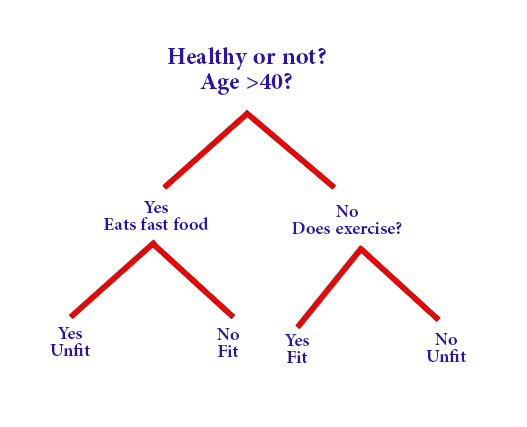
4. Decision Trees:
Decision trees are multi-pronged algorithms that build a tree-like model of decisions and their possible outcomes. By asking a series of questions, decision trees classify data into categories or predict continuous values. They are common in areas such as finance, customer segmentation, and manufacturing
So, it is a tree-like diagram, where each internal set forms a decision point, while the leaf node expresses prediction
To explain how the decision tree works:
The process of building the tree begins with selecting the root node so that it is easy to sort the data into different categories, then the data is iteratively divided into subgroups based on the values of the input features in order to find a classification formula that facilitates the sorting of the different data or required values
The decision tree diagram is easy to understand as it enables the user to create a well-defined visualization that allows the correct and beneficial decision-making
However, it should be known that the deeper the decision tree and the greater the number of its leaves, the greater the probability of neglecting the data, and this is one of the negative aspects of the decision tree.
If we want to talk about other negative aspects, it must be noted that the decision tree is often sensitive to the order of the input features, and this leads to different tree diagrams, and on the other hand, the final tree may not give the best result.
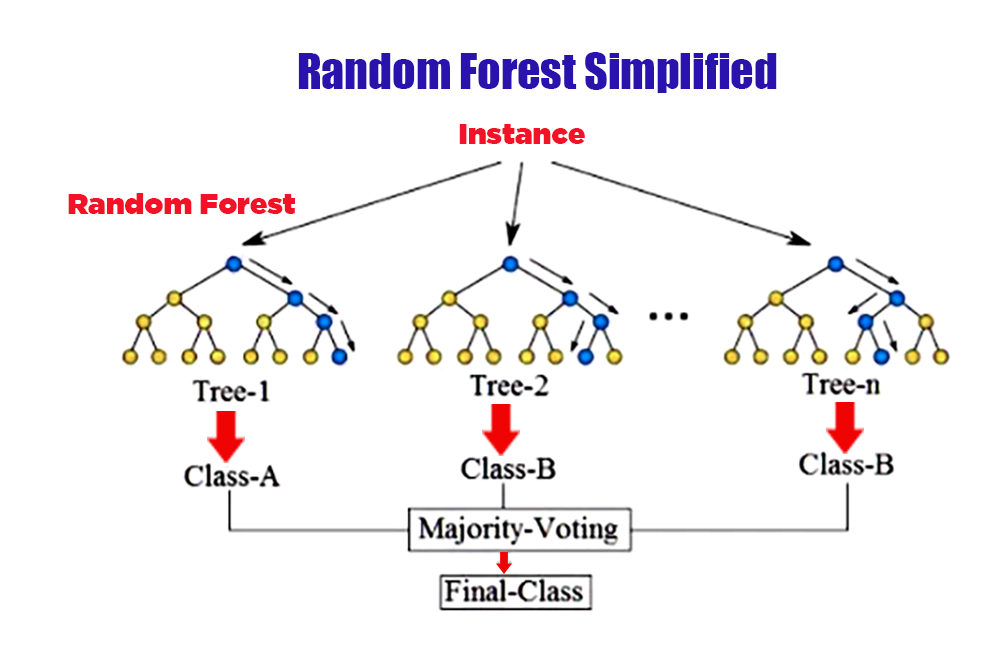
5. Random Forest:
The random forest is a group learning method that combines many decision trees to improve prediction accuracy. Each tree is built on a random subset of the training data and features. Random forests are effective for classification and regression tasks, finding applications in areas such as finance, healthcare, and bioinformatics.
Random forests are used if the data in a single decision tree is subject to overfitting, thus improving the model with greater accuracy
This forest is formed using the Bootstrapping technique which generates multiple decision trees
It is a statistical method based on randomly selecting data points and replacing them with the original data set. As a result, multiple data sets are formed that include a different set of data points that are later used to train individual decision trees.
Random forest allows to improve overall model performance by reducing the correlation between trees within a random forest because it relies on using a random subset of features for each tree and this method is called “random subspace”.
One of the drawbacks of a random forest is the higher computational cost of training and predictions as the number of trees in a forest increases
In addition to its lower interpretability compared to a single decision tree, it is superior to a single decision tree by being less prone to overfitting and having a higher ability to handle high-dimensional datasets.
Advertisements
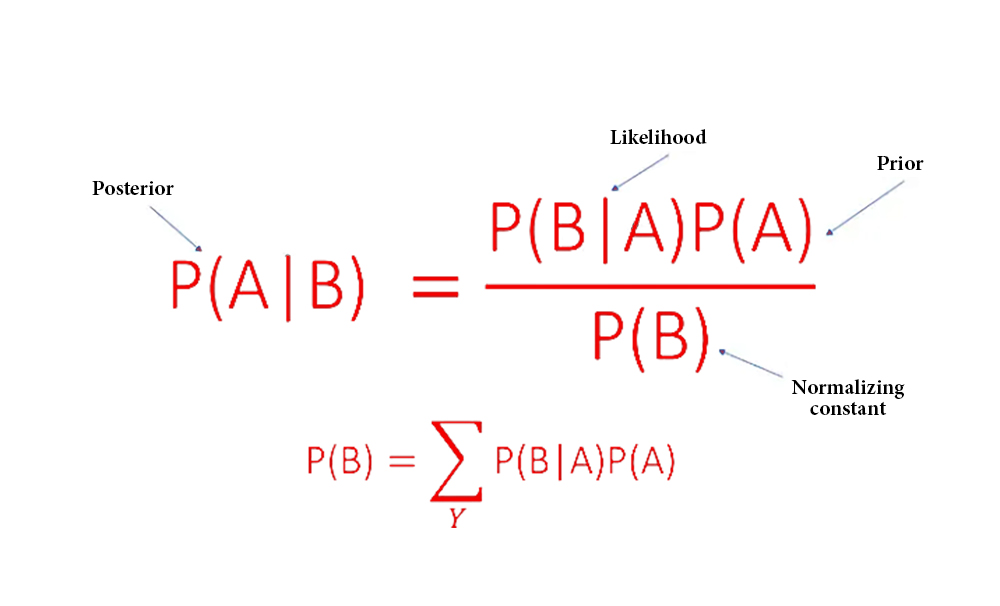
6. Naive Bayes
Naive Bayes is a probability algorithm based on Bayes’ theory with the assumption of independence between features. Despite its simplicity, Naive Bayes performs well in many real-world applications, such as spam filtering, sentiment analysis, and document classification.
Based on Bayes’ theorem, the probability of a particular class is calculated according to the values of the input features
There are different types of probability distributions when implementing the Naive Bayes algorithm, depending on the type of data
Among them:
Gaussian: for continuous data
Multinomial: for discrete data
Bernoulli: for binary data
Turning to the advantages of using this algorithm, we can say that it enjoys its simplicity and quality in terms of its need for less training data compared to other algorithms, and it is also characterized by the ability to deal with missing data.
But if we want to talk about the negatives, we will collide with their dependence on the assumption of independence between features, which often contradicts real-world data.
In addition, it is negatively affected by the presence of features different from the data set, so the level of performance decreases and the required efficiency decreases with it
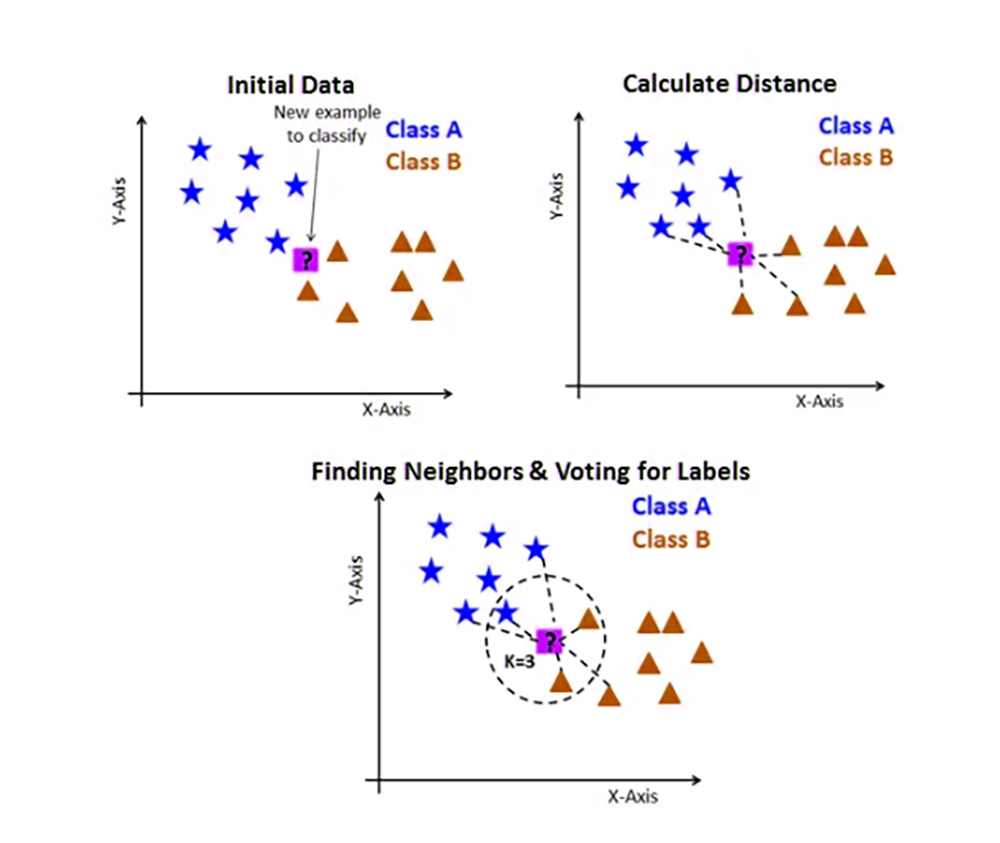
7. KNN
KNN is a non-parametric algorithm that classifies new data points based on their proximity to the seeded examples on the training set. It is widely used in pattern recognition and recommendation systems
KNN can handle classification and regression tasks.
That is, it relies on assigning similarity to similar data points
After choosing the k value, the value closest to the prediction, the data is sorted into training and test sets to make a prediction for a new input by calculating the distance between the entry and each data point in the training set, then choosing the k nearest data points to set the prediction later using the closest set of data points
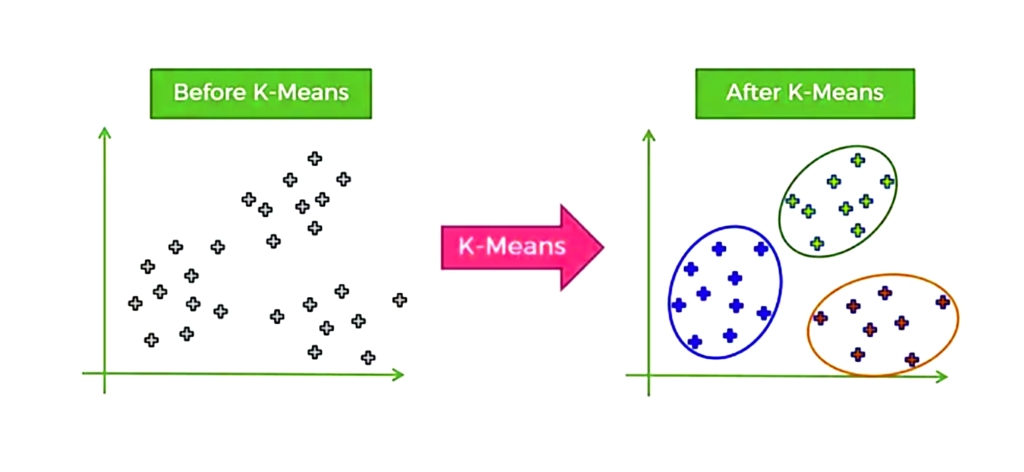
8. K-means
The working principle of this algorithm is based on the random selection of k centroids
So that k represents the number of clusters we want to create and then each data point is mapped to the cluster that was closest to the central point
So it is an algorithm that relies on grouping similar data points together and it is based on distance so that distances are calculated to assign a point to a group
This algorithm is used in many market segmentation, image compression and many other widely used applications
The downside of this algorithm is that its assumptions for data sets often do not match the real world
9. Dimensional reduction algorithms
This algorithm aims to reduce the number of features in the data set while preserving the necessary information. This technique is called “Dimensional Reduction”.
Like many dimension reduction algorithms, this algorithm makes data visualization easy and simple.
As in Principal Components Analysis (PCA)
and linear discriminant analysis (LDA)
Distributed Random Neighborhood Modulation (t-SNE)
We will come to explain each one separately
* Principal Component Analysis (PCA): It is a linear pattern of dimension reduction. Principal components can be defined as a set of correlated variables that have been orthogonally transformed into uncorrelated linear variables. Its aim is to identify patterns in the data and reduce its dimensions while preserving the necessary information.
* Linear Discrimination Analysis (LDA): is a supervised dimensionality reduction pattern used to obtain the most discriminating features of the sorting and classifying function
It is a well-proven nonlinear dimension reduction technique for visualizing high-dimensional data in order to obtain a low-dimensional representation that prevents loss of data structure.
The downside of the dimension reduction technique is that some necessary information may be lost during the dimension reduction process
It is also necessary to know the type of data and the task to be performed in order to choose the dimension reduction technique, so the process of determining the appropriate number of dimensions to keep may be somewhat difficult.
10. Gradient boosting algorithm and AdaBoosting algorithm
They are two algorithms used in classification and regression functions and they are widely used in machine learning
The working principle of these two algorithms is based on forming an effective model by collecting several weak models
Gradient enhancement:
It depends on building a pattern in a progressive manner according to multiple stages, starting from installing a simple model on the data (such as a decision tree, for example) and then correcting the errors made by the previous models by adding additional models. Thus, each added model obtains agreement with the negative gradient of the loss function in terms of the predictions of the previous model.
In this way, the final output of the model is the result of assembling the individual models
AdaBoost:
It is an acronym for Adaptive Boosting. This algorithm is similar to its predecessor in terms of its mechanism of action by relying on creating a pattern for the forward staging method and differs from the gradient boosting algorithm by focusing on improving the performance of weak models by adjusting the weights of the training data in each iteration, i.e. it depends on the wrong training models according to the previous model. It then adjusts the weights for the erroneous models so that they have a higher probability of being selected in the next iteration until finally arriving at a model weighted for all individual models. These two algorithms are characterized by their ability to deal with wide types of numerical and categorical data, and they are also characterized by their strength in dealing with the extreme value and with data with missing values, so they are used in many practical applications
Advertisements
أشهر عشرة خوارزميات التعلم الآلي للعام 2024
Advertisements
1. الانحدار الخطي
يرمز هذا المصطلح إلى عملية تحليل إحصائي لاختبار العلاقة بين متغيرين مستمرين الأول مستقل والثاني تابع واحد
يستخدم هذا النوع من الإحصاء لإيجاد الخط الأفضل عن طريق مجموعة من نقاط البيانات التي بدورها ستكشف لنا التنبؤات المستقبلية الأفضل
:تتمثل معادلة الانحدار الخطي البسيط بالشكل التالي
y = b0 + b1*x
متغير التابع y يمثل
المتغير المستقل x يمثل
y تقاطع b0 يمثل
(مع الخط y نقطة تقاطع المحور)
ميل الخط b1 يمثل
وبطريقة المربعات الصغرى نستطيع الحصول على الخط الأنسب أي الخط الذي يقلل من مجموع الفروق المربعة بين القيم الفعلية
y والمتوقعة للقيمة
كما وأننا نستطيع تخصيص عمل الانحدار الخطي ليتوسع إلى عدة متغيرات مستقلة فيسمى عندها الانحدار الخطي المتعدد والذي تتمثل معادلته بالشكل التالي
y = b0 + b1x1 + b2x2 +… + bn * xn
المتغيرات المستقلة x1 ، x2 ، … ، xn تمثل
المتغيرات المقابلة b1 ، b2 ، … ، bn وتمثل
وكما ذكرنا آنفاً يفيد الانحدار الخطي للحصول على التنبؤات المستقبلية، كما هو الحال عند التنبؤ بأسعار الأسهم أو تحديد مبيعات مستقبلية لمنتج معين ويتم ذلك بإجراء تنبؤات حول المتغير التابع
إلا أنه يوجد حالات لا يكون فيها نموذج الانحدار دقيق جداً وذلك في حال وجود قيم متطرفة لا تأخذ اتجاه البيانات بشكل عام
ولتبيان التعامل الأمثل في الانحدار الخطي بوجود القيم المتطرفة على الشكل التالي
تحييد القيم المتطرفة وإبعادها من مجموعة البيانات قبل تدريب النموذج *
تقليل تأثير القيم المتطرفة عن طريق تطبيق تحويل كأخذ سجل البيانات *
Theil-Senأو RANSAC استخدام طرق الانحدار القوية مثل *
لأنها تخفف من التأثير السلبي للقيم المتطرفة بفعالية أكبر من الانحدار الخطي التقليدي
ومع ذلك لا يمكن إنكار أن الانحدار الخطي يعتبر طريقة إحصاء فعالة وشائعة الاستخدام
2. الانحدار اللوجستي
وهو طريقة إحصاء تستخدم للحصول على تنبؤات للخيارات التي تحتمل خيارين أي ثنائية النتيجة وذلك بالاعتماد على مغير مستقل أو أكثر كما وأن لهذا الانحدار دور في وظائف التصنيف والفرز كأن يتنبأ بسلوك العملاء وغيرها من المهام الأخرى
يعتمد عمل الانحدار اللوجستي على دالة سينية تقوم بتعيين متغيرات الإدخال
ومن خلال تدريب النموذج على مجموعة بيانات والاستعانة بخوارزمية التحسين يتم تحديد المعاملات ثم يتم استخدامه في إجراء التنبؤات عن طريق إدخال بيانات جديدة
1 وحساب احتمالية أن تكون النتيجة
في الشكل التالي نلاحظ نموذج الانحدار اللوجستي
وبدراسة الشكل السابق نجد أنه استُخدمت
y للتنبؤ بالنتيجة x2و x1 متغيرات الإدخال
التي تحتمل خيارين
يتولى هذا الانحدار مهمة تعيين متغيرات الإدخال إلى احتمالية والتي ستحدد مستقبلاً شكل التوقع للنتيجة
b2و b1 أما المعامِلان
فيتحددان من خلال تدريب النموذج على مجموعة بيانات
0.5 وتعيين الحد على
3. (SVMs)دعم آلات المتجهات
خوارزمية قوية لكل من التصنيف والانحدار SVM يعد
يقسم نقاط البيانات إلى فئات مختلفة من خلال إيجاد المستوى الأمثل مع الحد الأقصى للهامش
بنجاح في مجالات مختلفةSVMs تم تطبيق
بما في ذلك التعرف على الصور وتصنيف النص والمعلوماتية الحيوية
SVMs تعتبر الحالات التي تستخدم فيها
هي التي لا يمكن فيها فصل البيانات بخط مستقيم، فبإمكان هذه القنية أن توزع البيانات على رقعة عالية الأبعاد لتسهيل اكتشاف حدود غير خطية
قدرتها على استخدام الذاكرة SVMs أثبتت أجهزة
فهي تركز على تخزين متجهات الدعم فقط دون الحاجة إلى مجموعة البيانات كلها، كما وأنها تتمتع بكفاءة عالية في المساحات عالية الأبعاد حتى لو كان عدد الميزات أكبر من عدد العينات
تعتبر هذه التقنية قوية ضد القيم المتطرفة نظراً لاعتمادها على ناقلات الدعم
إلا أن أحد سلبيات هذه التقنية هو أنها
kernel حساسة لاختيار وظيفة
كما أنها غير فعالة لمجموعات البيانات الضخمة كونها وقت التدريب فيها طويل جداً على الأغلب
4. أشجار القرار
أشجار القرار هي خوارزميات متعددة الجوانب تبني نموذجًا شبيهًا بالشجرة من القرارات ونتائجها المحتملة. من خلال طرح سلسلة من الأسئلة، تصنف أشجار القرار البيانات إلى فئات أو تتنبأ بقيم مستمرة. وهي شائعة في مجالات مثل التمويل وتجزئة العملاء والتصنيع
إذاً هي مخطط يشبه الشجرة بحيث تشكل كل عدة داخلية نقطة قرار أما العقدة الورقية فتعبر عن التنبؤ
:ولشرح عمل شجرة القرار
تبدأ عملية بناء الشجرة باختيار عقدة الجذر بحيث يسهل فرز البيانات إلى فئات مختلفة، ثم يتم تقسيم البيانات إلى مجموعات فرعية بشكل متكرر بالاعتماد على قيم ميزات الإدخال بغية إيجاد صيغة تصنيفية تسهل فرز البيانات المختلفة أو القيم المطلوبة
مخطط شجرة القرار سهل الفهم فهو يمكن المستخدم من إنشاء تصور واضح المعالم يتيح اتخاذ القرار الصائب والمفيد
إلا يجب معرفة أنه كلما كانت شجرة القرار عميقة أكثر وكان عدد أوراقها أكبر كلما زاد احتمال التفريط في البيانات وهذا أحد الجوانب السلبية في شجرة القرار
وإذا أردنا التحدث عن جوانب سلبية أخرى فلابد من التنويه إلى أن شجرة القرار غالباً ما تكون حساسة لترتيب ميزات الإدخال وهذا يؤدي إلى مخططات شجرية مختلفة والمقابل قد لا تعطي الشجرة النهائية النتيجة الأفضل
Advertisements
5. الغابة العشوائية
الغابة العشوائية هي طريقة تعلم جماعية تجمع بين العديد من أشجار القرار لتحسين دقة التنبؤ، كل شجرة مبنية على مجموعة فرعية عشوائية من بيانات التدريب والميزات، تعتبر الغابات العشوائية فعالة في مهام التصنيف والانحدار وإيجاد تطبيقات في مجالات مثل التمويل والرعاية الصحية والمعلوماتية الحيوية
ويتم استخدام الغابات العشوائية في حال كانت البيانات في شجرة قرار واحدة معرضة للإفراط في التجهيز وبالتالي تحسين النموذج بدقة أكبر
Bootstrapping يتم تشكيل هذه الغابة باستخدام تقنية
التي تقوم بإنشاء أشجار قرارات متعددة
وهي طريقة إحصائية تعتمد على اختيار عشوائي لنقاط بيانات واستبدالها مع مجموعة البيانات الأصلية فتتشكل بالنتيجة مجموعات بيانات متعددة تتضمن مجموعة مختلفة من نقاط البيانات المستخدمة لاحقاً لتدريب أشجار القرار الفردية
تتيح الغابة العشوائية تحسين أداء النموذج بشكل عام عن طريق تقليل الارتباط بين الأشجار ضمن الغابة العشوائية لأنها تعتمد على استخدام مجموعة فرعية عشوائية من الميزات لكل شجرة وهذه الطريقة تسمى “الفضاء الجزئي العشوائي”
أحد سلبيات الغابة العشوائية يكمن في ارتفاع التكلفة الحسابية للتدريب والتنبؤات كلما زاد عدد الأشجار في الغابة علاوة على انخفاض قابلية التفسير مقارنة بشجرة قرار واحدة إلا أنها تتفوق على شجرة القرار الواحدة بكونها أقل عرضة للإفراط في التجهيز وقدرتها العالية على التعامل مع مجموعات بيانات عالية الأبعاد
6. Naive Bayes
هي خوارزمية احتمالية تعتمد على نظرية بايز مع افتراض الاستقلال بين الميزات
Naive Bayes على الرغم من بساطته فإن
يعمل بشكل جيد في العديد من تطبيقات العالم الحقيقي، مثل تصفية البريد العشوائي، وتحليل المشاعر، وتصنيف المستندات
بالاعتماد على نظرية بايز يتم حساب احتمالية فئة معينة وفق قيم ميزات الإدخال ويوجد أنواع مختلفة من التوزيعات الاحتمالية
تستخدم حسب نمط البيانات Naive Bayes عند تنفيذ خوارزمية
:نذكر منها
للبيانات المستمرة :Gaussian
للبيانات المنفصلة :Multinomial
للبيانات الثنائية :Bernoulli
وبالتطرق إلى إيجابيات استخدام هذه الخوارزمية فيمكننا القول أنها تتمتع ببساطتها وجودتها من حيث حاجتها لبيانات تدريب أقل مقارنة بالخوارزميات الأخرى وتتميز أيضاً بإمكانية التعامل مع البيانات المفقودة
أما إذا أردنا التحدث عن السلبيات فسنصطدم باعتمادها على افتراض الاستقلال بين الميزات والذي غالباً ما يتعارض مع بيانات العالم الواقعي
إضافة إلى أنها تتأثر سلباً بوجود ميزات مختلفة عن مجوعة البيانات فينخفض مستوى الأداء وتقل معها الكفاءة المطلوبة
7. KNN
هي خوارزمية غير معلمية تصنف نقاط البيانات الجديدة بناءً على قربها من الأمثلة المصنفة في مجموعة التدريب، يستخدم على نطاق واسع في التعرف على الأنماط وأنظمة التوصية
التعامل مع مهام التصنيف والانحدار KNN يمكن لـ
أي أنها تعتمد على إضفاء صفة التشابه على نقاط البيانات المتشابهة
القيمة الأقرب للتنبؤ k بعد اختيار قيمة
يتم فرز البيانات إلى مجموعات تدريب واختبار لعمل تنبؤ لمدخل جديد عن طريق حساب المسافة بين الإدخال وكل نقطة بيانات في مجموعة التدريب
أقرب نقاط البيانات k ثم تختار
ليتم تعيين التنبؤ لاحقاً باستخدام المجموعة الأكثر قرباً لنقاط البيانات
8. K-means
يعتمد مبدأ عمل هذه الخوارزمية
k centroids على الاختيار العشوائي لـ
عدد المجموعات التي نريد إنشاءها k بحيث تمثل
ثم يتم تحديد كل نقطة بيانات إلى المجموعة التي تم أقرب نقطة مركزية
إذاً هي خوارزمية تعتمد على تجميع نقاط البيانات المتشابهة معاً وهي قائمة على المسافة بحيث تُحسب المسافات لتعيين نقطة إلى مجموعة
تستخدم هذه الخوارزمية في كثير من تطبيقات تجزئة السوق وضغط الصور وغيرها العديد من التطبيقات الواسعة الاستخدام
يتمثل الجانب السلبي لهذه الخوارزمية هو أن افتراضاتها لمجموعات البيانات لا تطابق الواقع الحقيقي في أغلب حيان
9. خوارزميات تقليل الأبعاد
تهدف هذه الخوارزمية إلى تقليل عدد الميزات في مجموعة البيانات مع المحافظة على المعلومات الضرورية، تسمى هذه التقنية تقليل الأبعاد
تسهم هذه الخوارزمية في جعل تصور البيانات أمراً سهلاً وبسيطاً شأنها شأن كثير من خوارزميات تقليل الأبعاد
(PCA) كما في تحليل المكونات الرئيسية
(LDA) والتحليل التمييزي الخطي
(t-SNE) والتضمين المتجاور العشوائي الموزع
وسنأتي على شرح كل واحدة منها على حدا
: (PCA) تحليل المكون الرئيسي *
هو نمط خطي لتقليل الأبعاد، ويمكن تعريف المكونات الأساسية بأنها مجموعة من المتغيرات المرتبطة تم تحويلها تحويلاً متعامداً إلى متغيرات خطية غير مترابطة، الهدف منه تحديد الأنماط في البيانات وتقليل أبعادها مع المحافظة على المعلومات الضرورية
: (LDA) تحليل التمييز الخطي *
هو نمط تقليل الأبعاد خاضع للإشراف يستخدم بغية الحصول على السمات الأكثر تمييزاً لوظيفة الفرز والتصنيف
وهي تقنية لتقليل الأبعاد غير الخطية أثبتت جدارتها لتصور البيانات عالية الأبعاد بغية الحصول على تمثيل منخفض الأبعاد يَحُول دون فقدان بنية البيانات
تتمثل سلبيات تقنية تقليل الأبعاد هو أنه بعض المعلومات الضرورية قد تتعرض الفقدان أثناء عملية تقليل الأبعاد
كما وأنه من الضروري معرفة نوع البيانات والمهمة المطلوب تنفيذها لاختيار تقنية تقليل الأبعاد لذا قد تكون عملية تحديد العدد الأنسب للأبعاد للاحتفاظ بها صعبة نوعاً ما
10. AdaBoosting خوارزمية تعزيز التدرج وخوارزمية
وهما خوارزميتان تستخدمان في وظائف التصنيف والانحدار وهما تستخدمان على نطاق واسع في التعلم الآلي
يعتمد مبدأ عمل هاتين الخوارزميتين على تشكيل نموذج فعال من خلال جمع عدة نماذج ضعيفة
:تعزيز التدرج
تعتمد على بناء نمط بأسلوب تقدمي وفق مراحل متعددة انطلاقاً من تركيب نموذج بسيط على البيانات (كشجرة القرار مثلاً) ثم تصحيح الأخطاء التي ارتكبتها النماذج السابقة وذلك بإضافة نماذج إضافية وبذلك يحصل كل نموذج مضاف على توافق مع التدرج السلبي لوظيفة الخسارة من حيث تنبؤات النموذج السابق
وعلى هذا النحو يكون الناتج النهائي للنموذج هو حصيلة تجميع النماذج الفردية
:AdaBoost
Adaptive Boosting وهي اختصار لـ
تشبه هذه الخوارزمية سابقتها من حيث آلية عملها باعتمادها على إنشاء نمط لأسلوب المرحلي للأمام وتختلف عن خوارزمية تعزيز التدرج بتركيزها على تحسين أداء النماذج الضعيفة من خلال تعديل أوزان بيانات التدريب في كل تكرار أي أنها تعتمد على نماذج التدريب الخاطئة حسب النموذج السابق وثم تثوم بتعديل الأوزان النماذج الخاطئة بحيث يصبح لديها احتمال أكبر للاختيار في التكرار الذي يليه حتى الوصول في النهاية إلى نموذج مرجح لجميع النماذج الفردية
تمتاز هاتان الخوارزميتان إلى بقدرتهما على التعامل مع أنماط واسعة من البيانات الرقمية منها والفئوية وتمتازان أيضاً بقوتهما بالتعامل مع القيمة المتطرفة ومع البيانات ذات القيم المفقودة لذا تستخدمان في العديد من التطبيقات العملية


You must be logged in to post a comment.