


As an applicant for an interview in data science and related sciences, you may notice that the success rates seem low compared to the number of applicants. You may notice that the level of questions becomes more difficult in the advanced stages of the interview, especially when questions related to machine learning are asked. In fact, the questions may seem difficult at first. The first is often the failure to answer as a result of confusion, which usually leads to the failure of the applicant.
Anyone who can avoid falling into this trap can benefit from his previous stumbling blocks and turn them into strengths that will help him overcome this interview with ease because he has become fully aware of the level and method of asking difficult questions.
Of course, not all applicants will wait until they fail to become aware of the level of questions and answer them in another interview. Here we exclude a small group of applicants who are fully prepared for any kind of questions. For them, machine learning is a specialty and they deal with it professionally, making them able to face the questions that constitute For others, it is a bump that is difficult to overcome, so in this article, for example, we will address, for example, the five most difficult questions that are classified as difficult in interviews related to machine learning. Understanding these questions that form the basic concepts in machine learning will undoubtedly make the applicant in a position of strength when he is tested with them.
Question 1: What is the difference between XGBoost and Gradient Boosting?
The obvious answer to this question may seem to you that XGBoost is the most suitable application for dealing with Gradient Descent, and this answer is not wrong, but the questioner is trying to extract the skills of the applicant through an answer that indicates that the respondent is a professional data scientist
- So the expected answer will be as follows:
- XGBoost has a requirement to get the job done
- XGBoost has a built-in technology for handling null values by a mechanism called sparsity awareness
- Uses gradients that are based on similarity scores
- It has a great role in speeding up the calculations
- Parallelism to find (variable – threshold) groups on huge data sets using weighted quantitative sketch technique
Question 2: What are the best uses for regression evaluation scales?
the answer :
Evaluation criteria used in regression:
R2 is very common in detecting the presence of regression, as it explains by the percentage of variance in the function that is explained by the independent variables
MSE loss function
RMSE Root mean square variance
MAPE is the average percentage of absolute error, which is the most appropriate measure for the commercial activity, as its work is based on giving a percentage of error in the average prediction values
How do you use the most appropriate option for each of: MSE and RMSE?
Use the RMSE which is the same scale as the actual scale
Use MSE on the squared scale
Question 3: How can overfitting be controlled using cross-validation?
the answer :
It is important to know that cross-validation enables you to identify redundant composition without the possibility of controlling it
In order to be able to control it, we must do the following:
- Selection and engineering of features
- If the algorithm is linear, outliers must be processed
- Parameter setting
- Early stop
- Organization
- Try to get as much data as possible
Question 4: What are precision and recall?
Let’s say that out of 18 expected fraud incidents, 12 were classified as true, and in this context, 80% of all fraud incidents were found. Precision and recall
Answer: Let’s create the following matrix:
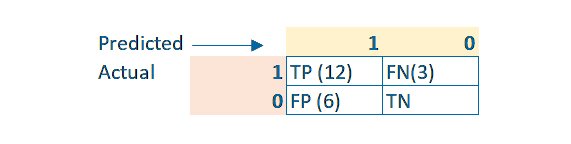
Precision = TP/(TP + FP) = 12/18 = 0.66
Recall = TP/(TP + FN) = 12/15 = 0.8
If your information is superficial on this subject, you will feel confused
On the contrary, if you are well versed, you will find that the answer is already in the question
Recall: What percentage of the actual 1s were correctly predicted = 80% = 0.8
Precision: How accurate were the predictions? Out of 18 predictions, 12 were correct, so 12/18 = 0.66.
It is noted here that TN is not a question and is not even required for both Recall and Precision
Question 5: What are the differences between Bagging and Boosting?
Bagging:
- Creating a large number of decision trees that enable the final prediction to be obtained
- Possibility to create decision trees on the dependent actual value
- Possible poor results on random datasets
Boosting:
- The dependence of the following tree on the prediction residuals on the last decision tree is the sequence of the beginners
- Create trees on the tailings
- Work well on random data set as it focuses on misclassified samples
Based on your knowledge of the previous points, you can choose between the two jobs
أصعب 5 أسئلة يمكن أن تطرح على المتقدم إلى مقابلة التعلم الآلي

قد تلاحظ كمتقدم لمقابلة في علوم البيانات وما يتفرع عنها من علوم أن معدلات النجاح تبدو منخفضة قياساً إلى عدد المتقدمين، قد تلاحظ أن مستوى الأسئلة يزداد صعوبة في مراحل متقدمة من المقابلة وخصوصاً عندما يتم طرح الأسئلة المتعلقة بالتعلم الآلي، في الحقيقة الأسئلة قد تبدو صعبة للوهلة الأولى وغالباً ما يكون التعثر في الإجابة نتيجة الارتباك الذي عادةً ما يؤدي إلى فشل المتقدم
يستطيع تجنب الوقوع في هذه المصيدة من يستفيد من عثرته السابقة ويحولها إلى نقاط قوة تعينه على تجاوز هذه المقابلة بسهولة ويسر لأنه بات على اطلاع تام على مستوى وأسلوب طرح الأسئلة الصعبة
بالطبع ليس كل المتقدمين سينتظرون إلى أن يفشلوا ليصبحوا على دراية بمستوى الأسئلة ويجيبوا عليها في مقابلة أخرى، نحن هنا نستثني فئة قليلة من المتقدمين المستعدين تماماً إلى أي نوع من الأسئلة، فالتعلم الآلي بالنسبة لهم هو اختصاص ويتعاملون معه باحترافية تجعلهم قادرين على مواجهة الأسئلة التي تشكل بالنسبة لغيرهم عثرة يصعب تجاوزها، لذا فسنتناول في مقالتنا هذه على سبيل المثال لا الحصر أكثر خمسة أسئلة تصنف على أنها صعبة في المقابلات المتعلقة بالتعلم الآلي، فهم هذه الأسئلة التي تشكل المفاهيم الأساسية في التعلم الآلي سيجعل بلا شك المتقدم في موضع قوة عندما يتم اختباره بها
:السؤال الأول
Gradient Boosting و XGBoost ما الفرق بين
قد تبدو لك الإجابة البديهية على هذا السؤال
هو التطبيق الأنسب XGBoost أن
Gradient Descent للتعامل مع
وهذه الإجابة ليست خاطئة ولكن السائل يحاول استخراج مهارات المتقدم من خلال إجابة تدل على أن المجيب عالِم بيانات محترف لذا فالإجابة المنتظرة ستكون على النحو الآتي
لديه شرط لإنجاز المهمة XGBoost
XGBoost يحتوي
على تقنية مدمجة للتعامل مع القيم الفارغة
sparsity awareness بواسطة آلية تسمى
يستخدم التدرجات التي تعتمد على درجات التشابه
لها دور كبير في تسريع العمليات الحسابية
التوازي للعثور على مجموعات ( متغيرة – عتبة ) على مجموعات البيانات الضخمة باستخدام تقنية الرسم الكمي الموزون
السؤال الثاني: ماهي الاستخدامات الأمثل لمقاييس تقييم الانحدار؟
: الإجابة
:معايير التقييم المستخدمة في الانحدار
هو شائع كثيراً في الكشف عن وجود الانحدار R2
فهو يشرح بنسبة مئوية التباين في التابع الذي يتم تفسيره بواسطة المتغيرات المستقلة
وظيفة الخسارة MSE
جذر المتوسط التربيعي للتباين RMSE
متوسط النسبة المئوية للخطأ المطلقMAPE
وهو المقياس الأنسب للنشاط التجاري فعمله قائم على إعطاء نسبة مئوية للخطأ في متوسط قيم التنبؤ
كيف تستخدم الخيار الأنسب
؟ MSE و RMSE : لكل من
RMSE استخدام
وهو نفس المقياس الموجود في المقياس الفعلي
MSE استخدام
على المقياس التربيعي
: السؤال الثالث
overfitting كيف يمكن ضبط عملية
باستخدام التحقق المتبادل؟
:الإجابة
من الضروري أن تعلم أن التحقق المتبادل يمكنك من تحديد التركيب الزائد دون إمكانية التحكم فيه
:ولنتمكن من التحكم فيه علينا إجراء الآتي
اختيار وهندسة الميزات *
إذا كانت خوارزمية خطية يجب معالجة القيم المتطرفة *
ضبط المعلمة *
التوقف المبكر *
التنظيم *
محاولة الحصول على مزيد من البيانات قدر المستطاع *
: السؤال الرابع
؟ precision و recall ما هي
لنقل أنه من أصل 18 حادثة احتيال متوقعة تم تصنيف 12 منها على أنها صحيحة وفي هذا السياق تم العثور على 80 % من إجمال حوادث الاحتيال
precision و recall اذكر
:الجواب
:لنقوم بإنشاء المصفوفة التالية

Precision = TP/(TP + FP) = 12/18 = 0.66
Recall = TP/(TP + FN) = 12/15 = 0.8
إن كانت معلوماتك سطحية حول هذا الموضوع ستشعر بالارتباك
وعلى العكس تماماً إن كنت متمكن جيداً فستجد أن الإجابة موجودة أصلاً بالسؤال
: Recall
1s ما هي النسبة المئوية من
الفعلية التي تم توقعها بشكل صحيح = 80٪ = 0.8
: Precision
ما مدى دقة التنبؤات، من أصل 18 تنبؤ ، كان 12 منها صحيحاً ومن ثم 12/18 = 0.66
TN ومن الملاحظ هنا أن
ليس سؤالاً وليس مطلوباً
Recall و Precision حتى لكل من
السؤال الخامس: ما هي أوجه الاختلاف
Bagging و Boosting بين
: Boosting
اعتماد الشجرة التالية على بقايا التنبؤ على آخر شجرة قرار فهو تسلسل المبتدئين *
إنشاء الأشجار على المخلفات *
العمل بشكل جيد على مجموعة البيانات العشوائية فهو يركز على العينات المصنفة بشكل خاطئ *
: Bagging
إنشاء عدد كبير من أشجار القرار تمكِّن من الحصول على التنبؤ النهائي *
إمكانية إنشاء أشجار قرار على القيمة الفعلية التابعة *
من الممكن إعطاء نتائج رديئة على مجموعات البيانات العشوائية *
فبناءً على معرفتك بالنقاط السابقة تستطيع الاختيار بين الوظيفتين


You must be logged in to post a comment.