


Today, we will discuss the basic concepts that data analysts rely on while practicing their job in data science, and we will go together to identify the main stages that we will pass through during our research from examples of work in the VBO Bootcamp / Miuul project.
1. Forming an idea of the problem to be addressed:
The most important thing that a data scientist begins to do in addressing any issue related to his professional work is to understand the problem that he must solve, and then understand the benefits that result from that solution to the institution or entity in which he works.
A correct understanding of the type of problem or the nature of the work required helps to determine the most appropriate mechanism to address the problems and thus enhance the experiences gained through experience and practice. In our example, we will see different solutions with two different mechanisms.
The data set used:
The data that we will use in this project includes outputs in order to determine the budget necessary to attract the largest possible number of customers, classify them, and prepare advertising programs according to their requirements. Therefore, we followed the regression method to determine the value of the budget, and we followed the aggregation method to classify customers.
The importance of this strategy lies in our ability to determine the level of production based on our knowledge of the profit rates that we will reach
2- Determine the type of data we deal with
In order to carry out this stage accurately, it requires knowledge of several points:
A. What is the type of correlation between the data in our example?
B. What is the primary origin of this data?
C. Are there any null values in this data?
D. Is there a defect in the data?
E. Is there a specific time for the origin of this data?
F. What are the meanings of the columns in the data set?
And your use of the Kaggle data set will make your identification of the data type more necessary to obtain accurate results.
* It is necessary to familiarize yourself with the instructions of the main source of data, and through this you can determine the outliers and empty records, if any.
* Verifying all variables (categorical, numerical, and numeric) that are primarily related to the data of our project.
* Checking the numerical variables that have been identified to assign outliers, if any.
* Identifying the categories that are frequently present within the data and the categories that are hardly present, by exploring the locations of the categorical variables.
* Analyze the correlation between variables to see their effect on each other, and this procedure helps us to keep the variable with the highest correlation with the dependent variable during selection.
* Formation of a general idea of the characteristics and advantages of each element of the project.
This is a practical application of the compilation that we conducted on the information indicating the relationship between the producer and the consumer in a specific population unit and one of the shops located in that area:

The results show that we have: STORE_SALES=UNIT_SALES*SRP
Under normal circumstances, you cannot understand the meaning of this concept, so you will have to search on Google to make sure that the assembly is correct.
3- Data Preprocessing
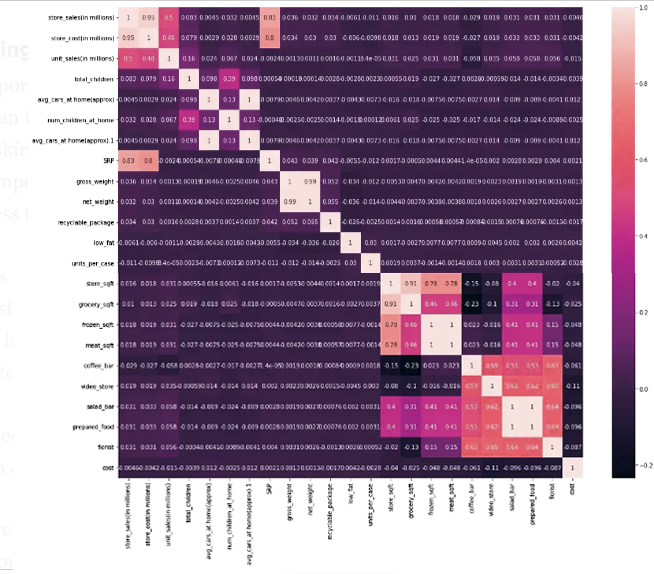
In our example, it is clear to us through the chart that there were no outliers or null records in the data, but we removed a duplicate column that was detected in the table.
Through our expectation of the correlation, it became clear to us that the information is strongly related to each other:
Grossy_sqft x Meat_sqft → Negative High Correlation
Store_sales x Store_cost → High positive correlation
Store_sales x SRP → High positive correlation
Gross_weight x Net_weight → High positive correlation
Salad_bar x Prepared_food x Coffee_bar x Video_store x Florist → positive median correlation

4. Data Engineering :
It is essential to understand the problems that the organization you work in faces. You need to create value added from data, create key tool indicators, and other necessary tasks.
The main goal of our project is to determine the budget necessary to obtain clients, and this is necessary in order to estimate an appropriate value for the budget that is supposed to be spent in the future at the lowest possible cost.
We have created a number of new variants with Onehot technology
So first we need to convert the categorical variable values into a numeric value so that we can use them in the algorithms, as shown below:

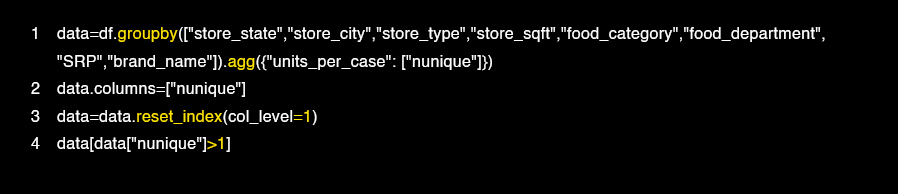
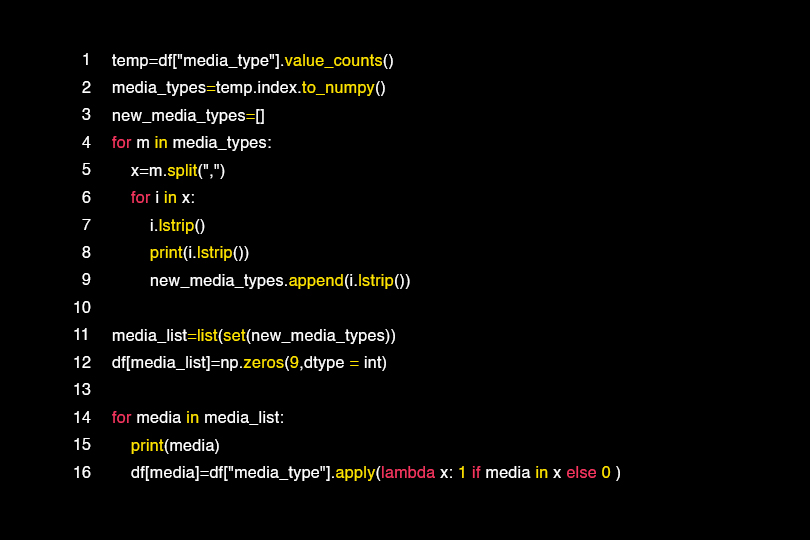
We have obtained new columns by separating the columns by more than one value with the following operations as in the case of the arguments column.
Here we notice the media channels that are used a lot and that directly affect the cost variable.

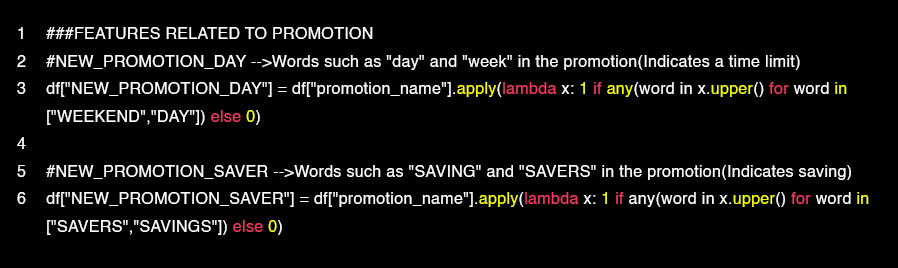
Motivational words that attract customers as promotional offers have been added to the column related to the promotion category containing words such as “today” and “weekend” and other words that inform the user of the need to obtain a product during a certain period.

We also notice that the columns passed through Onehot are within columns that have a few different values such as: country, profession.
5. Monotheism:
A necessary study so that no variable affects the data and to obtain effective training within the shortest possible period.
We note that we used the StandardScaler model because our data did not contain an exception.
If the data happens to contain an exception, then the RobustScaler model is recommended
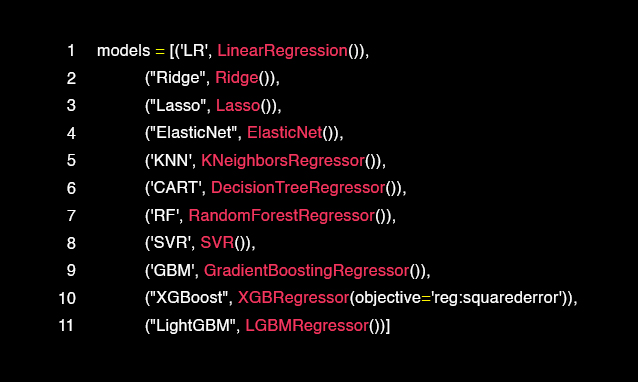
6. Estimation:
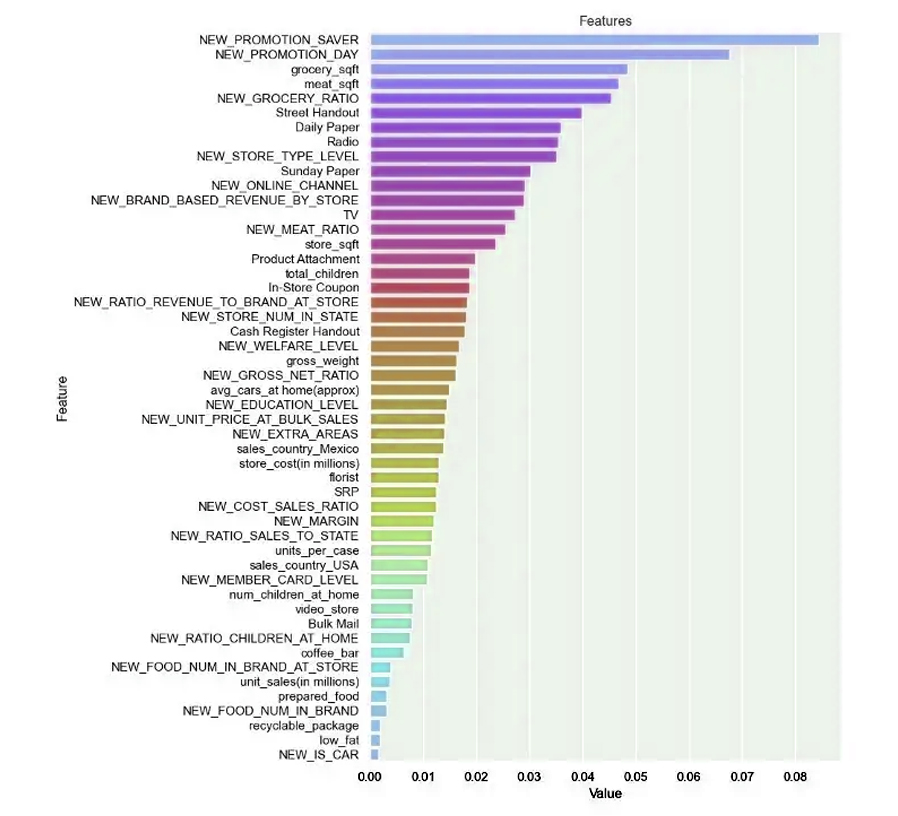
Indeed, we can say that we succeeded in estimating each model by varying the different skills of machine learning, and we worked on adjusting the Hyperparameter, and before that we had excluded weakly correlated variables, and the purpose of that was to remove the correlation to obtain training in less time.

7. Compilation:
The second plan that we are working on in our project is to obtain customers and keep them as permanent customers, so we classified customers and worked to estimate the value needed for that
This image shows what is meant:

8- Graphic representation:
Data loses its value if we do not deal with it properly. The basis on which successful analysis is built is the correct description of the data, and the best way to achieve this is to visualize the data.
In our project we made a control panel by Microstrategy
Project elements:
Store sales according to its type and cost: The purpose is to determine the sales value and cost based on the type of store.
Stores location map: This map shows the distribution of stores within the city.
Customer Chart: It is a map that shows the classification of customers by country.
Distribution of customers by brand: Depending on the WORD-CLOUD model, we can count the brands of customers.
The media channel staff and the annual AVG: After doing the marketing offers, we were able to determine the appropriate membership and the audience that earns profits from that membership.
Classification of customers: using the dispersion chart.
Based on the division of the resulting five groups, you are now able to deal with them closely and form appropriate strategies to work according to the plans of the company in which you work
Here are examples of the plans that we have created based on the ratios between spending and financial return:
High cost and high financial return: It is represented in spending large amounts of money in exchange for attracting customers, then what you spent on me will return with abundant profit. By analogy, it is possible to determine the channel that receives the largest possible number of communications and exploit that by saving spending as much as possible.
High cost and low financial return: I spend a large amount of money to attract customers, but the financial return is low. This is due to several reasons, including that customers do not find their need in my store.
Low cost and low financial return: I spend a very small amount to get customers, but I may be the target of a specific audience who prefers a specific type of my products, whose financial returns are low. To follow the best strategy in this case, it is advisable to create a marketing campaign for preferred products based on statistics on the quantity and types of materials required.
Low cost and high financial return: This case embodies the speed of my access to customers in the shortest possible time, which brings me a large financial profit through marketing tours for this type of customer.
Medium cost and low financial return: I spend money to get customers, but the financial return is low. My store does not have enough materials that customers require. This problem can be solved by conducting some statistics to remedy the defect.
معالجة شاملة لمشروع علم البيانات

سنتناول اليوم المفاهيم الأساسية التي يرتكز عليها محللو البيانات أثناء ممارستهم لوظيفتهم فيما يتعلق بعلم البيانات وسنمضي سوياً لنتعرف على المراحل الرئيسية التي سنمر عليها تباعاً أثناء بحثنا هذا من أمثلة
VBO Bootcamp / Miuul عن العمل في مشروع
1. تكوين فكرة عن ماهية المشكلة المطلوب معالجتها :
أهم ما يبدأ به عالِم البيانات في معالجة أي قضية متعلقة بعمله الوظيفي هو فهم المشكلة التي يتوجب عليه حلها ثم فهم ما ينتج عن ذلك الحل من فوائد تعود على المؤسسة أو الكيان الذي يعمل فيه
يساعد الفهم الصحيح لنوع المشكلة أو ماهية العمل المطلوب على تحديد الآلية الأنسب لمعالجة المشاكل وبالتالي تعزيز الخبرات المكتسبة من خلال التجربة والممارسة , وفي مثالنا سنشاهد حلول مختلفة بآليتين مختلفتين
مجموعة البيانات المستخدمة
تتضمن البيانات التي سنستخدمها في هذا المشروع مخرجات من أجل تحديد الميزانية اللازمة لجذب أكبر عدد ممكن من العملاء وتصنيفهم وتجهيز برامج دعائية حسب متطلباتهم , لذا اتبعنا طريقة الانحدار لتحديد قيمة الميزانية واتبعنا أسلوب التجميع لتصنيف العملاء
تكمن أهمية هذه الاستراتيجية قدرتنا على تحديد مستوى الإنتاج بناءً على معرفتنا بنسب الربح التي سنصل إليها
2- تحديد نوع البيانات التي نتعامل معها
:وللقيام بهذه المرحلة بدقة يتطلب ذلك معرفة عدة نقاط
أ. ما نوع الترابط بين البيانات في مثالنا ؟
ب. ما هو المنشأ الأساسي لهذه البيانات ؟
ج. هل يوجد ضمن هذه البيانات قيم فارغة ؟
د. هل يوجد خلل في البيانات ؟
و. هل يوجد زمن محدد لمنشأ هذه البيانات ؟
ز. ما هي مدلولات الأعمدة في مجموعة البيانات ؟
Kaggle واستخدامك لمجموعة بيانات
سيجعل تحديدك لنوع البيانات أكثر ضرورة للحصول على نتائج دقيقة
* من الضروري التعرف على تعليمات المصدر الرئيسي للبيانات ومن خلال ذلك تتمكن من تحديد القيم المتطرفة والسجلات الخالية إن وجدت
التحقق من جميع المتغيرات ( الفئوية والعددية والرقمية ) التي تتعلق بصفة أساسية بالبيانات الخاصة بمشروعنا *
تدقيق المتغيرات العددية التي تم تحديدها لتعيين القيم الشاذة إن وجدت *
تعيين الفئات المتواجدة بكثرة ضمن البينات والفئات التي بالكاد تكون موجودة وذلك استكشاف أماكن تموضع المتغيرات الفئوية *
* تحليل الترابط بين المتغيرات لمعرفة تأثيرها على بعضها البعض , ويفيدنا هذا الإجراء في الاحتفاظ بالمتغير ذو الارتباط الأعلى مع المتغير التابع أثناء الاختيار
* تكوين فكرة عامة عن خصائص وميزات كل عنصر من عناصر المشروع *
وهذا تطبيق عملي على التجميع الذي أجريناه على المعلومات الدالة العلاقة بين المنتج والمستهلك في وحدة سكانية معينة وأحد المحلات التجارية المتواجدة في تلك المنطقة
: تظهر النتائج أنه يوجد لدينا
STORE_SALES=UNIT_SALES*SRP
بالأحوال العادية لا يمكنك إدراك معنى هذا المفهوم لذا ستضطر للبحث
للتأكد من صحة التجميع Google في
3. استكشاف القيم المتطرفة والسجلات الخالية :
في مثالنا يتضح لنا من خلال المخطط أنه لم تكن هناك قيم متطرفة أو سجلات خالية في البيانات ولكن أزلنا عموداً مكرراً تم اكتشافه في الجدول
من خلال توقعنا لعلاقة الارتباط اتضح لنا أن المعلومات مرتبطة بقوة بين بعضها
Grossy_sqft x Meat_sqft → ارتباط عالي سلبي
Store_sales x Store_cost → ارتباط عالي إيجابي
Store_sales x SRP → ارتباط عالي إيجابي
Gross_weight x Net_weight → ارتباط عالي إيجابي
Salad_bar x Prepared_food x Coffee_bar x Video_store x Florist → ارتباط متوسط إيجابي
4. هندسة البيانات :
من الضروري فهم المشاكل التي تواجهها المؤسسة التي تعمل بها فأنت بحاجة إلى إنشاء القيم المضافة من البيانات وإنشاء مؤشرات الأداة الرئيسية وغيرها من المهام الضرورية الأخرى
والغاية الأساسية في مشروعنا هو تحديد الميزانية اللازمة للحصول على العملاء وهذا ضروري من أجل تقدير قيمة مناسبة للميزانية المفترض صرفها في المستقبل بأقل تكلفة ممكنة
قمنا بإنشاء عدد من المتغيرات الجديدة
Onehot عن طريق تقنية
إذاً نحن بحاجة أولاً إلى تحويل القيم المتغيرة الفئوية إلى قيمة عددية لكي نتمكن من استخدامها في الخوارزميات , وذلك كما على النمطالموضح أدناه

لقد حصلنا على أعمدة جديدة عن طريق فصل الأعمدة بأكثر من قيمة مع العمليات التالية كما هو الحال في عمود الوسائط
هنا نلاحظ القنوات الإعلامية التي تُستعمل كثيراً والتي تؤثر تأثيراً مباشراً على متغير التكلفة
تم طرح ألفاظ تحفيزية تجذب الزبائن كعروض ترويجية أضيفت للعمود المرتبط بفئة الترويج تحوي كلمات مثل ” اليوم ” و” عطلة نهاية الأسبوع ” وغيرها من ألفاظ التي تُشعِر المستخدم بضرورة الحصول على منتج ما خلال فترة معينة
Onehot نلاحظ أيضاً أن الأعمدة التي مرت عبر
موجودة ضمن أعمدة حازت على عدد قليل من القيم المختلفة مثل : البلد , المهنة
5. التوحيد :
دراسة ضرورية لكي لا يقوم أي متغير بالتأثير على البيانات وللحصول على تدريب فعال خلال أقصر فترة ممكنة
StandardScaler نلاحظ أننا استخدمنا نموذج
لأن بياناتنا لم تحتوي على استثناء
وإن حدث واحتوت البيانات على استثناء فعندها يوصى
RobustScaler باستخدام نموذج
6. التقدير :
, بالفعل نستطيع القول بأننا نجحنا في تخمين كل نموذج عن طريق تنوع المهارات المختلفة للتعلم الآلي
Hyperparameter وعملنا على ضبط
وقبل ذلك كنا قد استثنينا المتغيرات ضعيفة الترابط , والغاية من ذلك إزالة علاقة الارتباط للحصول على تدريب في وقت أقل

7. التجميع :
الخطة الثانية التي نعمل عليها في مشروعنا هي الحصول على الزبائن والمحافظة عليهم كعملاء دائمين لذا صنفنا العملاء وعملنا على تقدير القيمة اللازمة لذلك
: وهذه الصورة توضح المقصود

8. التمثيل البياني :
تفقد البيانات قيمتها إن لم نكن نحسن التعامل معها كما يجب فالأساس الذي يبنى عليه التحليل الناجح هو الوصف الصحيح للبيانات وأفضل طريقة لتحقيق ذلك هو تصور البيانات
Microstrategy في مشروعنا قمنا بصنع لوحة تحكم بواسطة
: عناصر المشروع
مبيعات المتجر قياساً إلى نوعه وتكلفته : الغاية هي تحديد قيمة المبيعات والتكلفة على أساس نوع المتجر
خريطة تموضع المتاجر : تظهر هذه الخريطة توزع المتاجر ضمن المدينة
مخطط العملاء : عبارة عن خريطة توضح تصنيف العملاء حسب البلد
:توزيع العملاء حسب العلامة التجارية
WORD-CLOUD بالاعتماد على نموذج
يمكننا إحصاء العلامات التجارية الخاصة بالعملاء
كادر القناة الإعلامية و AVG السنوي : بعد قيامنا بالعروض التسويقية استطعنا تحديد العضوية المناسبة والجمهور الذي يكسب أرباح من تلك العضوية
تصنيف العملاء : باستخدام مخطط التشتت
استناداً إلى تقسيم المجموعات الخمسة الناتجة أصبح بمقدورك التعامل معها عن قرب وتكوين استراتيجيات مناسبة للعمل وفق خطط الشركة التي تعمل بها
: إليك نماذج عن الخطط التي أنشأناها مبنية على النسب بين الإنفاق والعائد المادي
تكلفة مرتفعة وعائد مادي مرتفع : تتمثل في إنفاق مبالغ كبيرة من المال مقابل جذب العملاء ثم يعود ما أنفقت علي بالربح الوفير , يمكن قياساً إلى ذلك تحديد القناة التي تستقبل أكبر من عدد ممكن من اتصالات واستغلال ذلك بتوفير الإنفاق أكبر قدر ممكن
تكلفة مرتفعة وعائد مادي منخفض : أقوم بإنفاق مبلغ مالي كبير لجذب العملاء ولكن المردود المادي منخفض , يعود هذا لعدة أسباب منها أن الزبائن لا يجدون حاجتهم في متجري
تكلفة قليلة وعائد مادي منخفض : أقوم بإنفاق مبلغ قليل جداً للحصول على العملاء ولكن قد أكون مقصد لجمهور معين يفضل نوع محدد من منتجاتي عوائدها المادية قليلة ولاتباع أفضل استراتيجية حول هذه الحالة يُنصح بإنشاء حملة تسويقية للمنتجات المفضلة استناداً إلى إحصائيات بمكية وأنواع المواد المطلوبة
تكلفة قليلة وعائد مادي مرتفع : تجسد هذه الحالة سرعة وصولي إلى العملاء بأقل وقت ممكن مما يعود علي بربح مادي كبير عن طريق جولات تسويقية لهذا النوع من العملاء
تكلفة متوسطة وعائد مادي منخفض : أنفق المال للحصول على العملاء ولكن المردود المادي قليل , لا تتوفر في متجري المواد التي يطلبها العملاء بشكل كافي , يمكن حل هذه المشكلة بإجراء بعض الإحصائيات لتدارك الخلل
