While there is no secret formula to success, many thriving businesses do attempt to follow a few standard best practices to help them stay in the fast lane. Digital marketing is one area that many companies are focusing on because they see the value of concentrating their efforts online.
A consultation with DATA World will ensure that you stay a step ahead with proven data science and mentoring services.
Keeping on top of technology
It’s safe to say businesses can’t succeed without relying on technology to a large degree.
Data visualization is a rising software platform that more and more businesses are using to communicate better.
Keeping the lines of communication open is especially vital in this digital age when more and more people are working remotely.
Focusing on self-improvement
Business owners realize the importance of self-improvement. Hence, the reason why many seasoned entrepreneurs still take it upon themselves to continue upskilling themselves.
Advertisements
A business degree is always useful to have if you want to enhance the skills you already have. Try this to see why an online degree in business can help you push further.
A mentor can help you reach your goals much quicker than you might do on your own.
Networking with the right people can also broaden your horizons.
Staying with the plan
You will most probably have derived a plan right at the beginning of your business venture.
A S.W.O.T analysis can help to identify your strengths as well as your weaknesses, your opportunities, and your threats, so you don’t get caught off guard by anything you weren’t expecting.
Best business practices might seem like a complex formula to follow. Reminding yourself to take that course or a degree can help to enhance your focus on the strategic elements of growing your business even more.
Written by: Lance Cody-Valdez
Advertisements
أفضل ممارسات العمل التي يجب مراعاتها
Advertisements
على الرغم من عدم وجود صيغة سرية للنجاح ، تحاول العديد من الشركات المزدهرة اتباع بعض أفضل الممارسات القياسية لمساعدتهم على البقاء في المسار السريع. التسويق الرقمي هو أحد المجالات التي تركز عليها العديد من الشركات لأنها ترى قيمة تركيز جهودها على الإنترنت
أن تظل متقدمًا بخطوة في خدمات علم البيانات والتوجيه التي أثبتت جدواها
مواكبة التكنولوجيا
من المهم أن ننوه إلى إن الشركات لا يمكنها النجاح دون الاعتماد على التكنولوجيا بدرجة كبيرة
تصور البيانات عبارة عن منصة برمجية متنامية يستخدمها المزيد والمزيد من الشركات للتواصل بشكل أفضل *
تعد ثقافة الشركة القوية أيضًا جانبًا آخر يجب مراعاته عندما يتعلق الأمر ببناء فريق أكثر تزامنًا مع بعضه البعض. يمكن أن تساعد أدوات إدارة المشروع في ذلك
يعد إبقاء خطوط الاتصال مفتوحة أمرًا حيويًا بشكل خاص في هذا العصر الرقمي حيث يعمل المزيد والمزيد من الأشخاص عن بُعد *
Advertisements
التركيز على تطوير الذات
يدرك أصحاب الأعمال أهمية تحسين الذات. ومن ثم ، فإن السبب الذي يجعل العديد من رواد الأعمال المخضرمين لا يزالون يأخذون على عاتقهم مواصلة تطوير مهاراتهم
إن الحصول على درجة علمية مفيد دائمًا إذا كنت ترغب في تعزيز المهارات التي لديك بالفعل جرب هذا لترى لماذا يمكن أن تساعدك شهادة في الأعمال التجارية عبر الإنترنت في المضي قدمًا
يمكن أن يساعدك المرشد في الوصول إلى أهدافك بشكل أسرع بكثير مما قد تفعله بمفردك
يمكن للتواصل مع الأشخاص المناسبين أيضًا توسيع آفاقك
البقاء على الخطة
من المحتمل أن تكون قد اشتقت خطة مباشرة في بداية مشروعك التجاري
يعد الالتزام بالخطة مع الحفاظ على المرونة للتغيير أمرًا حيويًا لأنه لا ينبغي أن تراوح مكانك دون مواكبة التطور السريع
يجب أن تحدد خطة عملك أهداف شركتك
S.W.O.T يمكن أن يساعد تحليل
في تحديد نقاط قوتك بالإضافة إلى نقاط ضعفك ، وفرصك ، وتهديداتك ، حتى لا تتفاجأ بأي شيء لم تكن تتوقعه
خصص وقتًا لمراجعة أدائك لتقيم مستوى النجاح قد تبدو أفضل الممارسات التجارية كصيغة معقدة يجب اتباعها. يمكن أن يساعد تذكير نفسك بأخذ هذه الدورة أو الحصول على درجة علمية في تعزيز تركيزك على العناصر الإستراتيجية لتنمية عملك بشكل أكبر
To define this data set: Netflix is a media and video broadcasting platform that includes a large number of movies and TV shows, and according to statistics, its subscribers exceeded 200 million subscribers in 2021 from all over the world.
In this case, the tabular dataset consists of lists of all the movies and TV shows available on Netflix, plus information about actors, directors, audience ratings, and other information.
Here are some important ideas:
* Content available in different countries
* Choose similar content by matching attributes related to the text
* Finding valuable and interesting content by analyzing the network of actors and directors
* A comparison of the most popular broadcasts in recent years (movies – TV shows) on the Netflix platform.
(real or imaginary): Predicting the imaginary job description:
This dataset includes 18,000 job attributes, of which 800 are fictitious descriptions. The data consists of text and descriptive information about jobs. The dataset can be used to build screening models that detect the fictitious attribute of fictitious jobs.
The dataset can be used to answer the following questions:
* You have to build a screening model based on the characteristics of the text data to determine whether the job description is real or fraudulent.
* Focusing on words and phrases that express description and deception, adjusting and identifying them.
Determine the characteristics of similar jobs.
* You have to perform exploratory data analysis on the data set to find useful values from said data set.
In our example, the datasets are player data represented by their abilities and skills from FIFA 15 to FIFA 22 (“players_22.csv”). This data provides procedures for finding several comparisons for specific players through the eighth version of the FIFA game
The following are available analytical models:
* A comprehensive comparison between Messi and Ronaldo (compared to the statistics of their working lives – changes in skill over time)
* The appropriate liquidity to build a team that competes on the level of the European continent, and at this point the budget does not allow the purchase of distinguished players from the eleven-man squad.
* Analyzing a model for the most efficient n% of players (for example, we deal with the largest percentage of 5% of players) to determine the presence of basic features in the game versions such as speed, agility, and ball control. As a live example, we note that the best 5% of players in FIFA 20 version are faster And agility from the FIFA 15 version, and through this kind of comparisons, we can conclude that with more than 5% of the best players who have obtained high statistics with ball control, this means that the game’s interest in the skill and technical aspect is greater than the interest in the physical aspect.
Specifically, we see that:
* The URL of the excluded players.
* The URL of the uploaded face of the player with the club or national team logo
* Information about the player, such as nationality, the team he plays for, date of birth, salary, and others.
* Statistics of the player’s skills, which are related to attack, defense, goalkeeper skill, and other skills.
* Every player present in FIFA 15 through 22 versions of the game
* More than 100 features
* The position in which the player plays and his mission in the club and the national team
The main success of a bookstore that sells various books lies in the high demand for effective purchases of the right books at the right time. In this context, one of the leading business events in the field of books and libraries organizes a competition to support booksellers that allows them to compete in the market.
So the competition here is to predict the purchase quantities of a clearly defined property portfolio for each site by means of simulated data.
Occupation :
Being competitive requires forecasting purchase quantities for eight addresses for 2418 different locations. To build the model, simulated purchasing data will be available from an additional 2349 locations, with all data referring to a limited time period. possible.
data :
There are two auxiliary files available to solve the problem:
The densely populated areas are more prevalent for supermarkets, and this creates commercial competition among them, which reflects positively on the market movement and contributes to the growth of the economy in general.
In our research today, we will discuss the data set that represents sales of three branches of a supermarket company for a period of ninety days. This group was chosen due to the ease of its predictive data analysis models.
Classification data:
Invoice ID: This is an identification number for the sales invoice
Branch: Super Center branch (out of three branches indicated by symbols A, B and C).
City: the most lively locations
Customer Type: Members classify the type of customers based on membership card users and non-users.
Gender: Specifies the gender of the customer
Production line: It depends on distributing basic components such as food, beverages, tourism, sports, electronic accessories, decorative accessories, fashion, and others
Product price: It is estimated in US dollars
Quantity: It is the number of products that the customer has purchased
Tax: It is a 5% tax fee added to the purchase value
Total Price: The total price including tax
Date: The date of purchase (which is the period between May and July of 2019)
Time: which is the time of purchase (from 9 am to 8 p.m.)
Payment: The payment method used by the customer upon purchase, and it is one of three methods (direct payment – credit card – electronic business archive).
COGS: The value of products sold
Total Margin Ratio: Total Margin Ratio
Total return: the total income
Classification: It is based on the classification of customer levels based on shopping traffic, according to a ratio estimated from 1 to 10
6. Control fraudulent procedures related to credit cards:
The process of controlling fraud in credit card transactions is very important for credit companies, which is to obtain fees from customers for products that they did not purchase
The data set includes transactions that were carried out in two days by credit cards in September of 2013, so that several forged transactions were caught out of thousands of transactions, and thus we find a large percentage of imbalance in this data set, and fraud recorded a rate of 0.172% of the total transactions.
The basic elements, which are the features V1, V2, … V28, were obtained using the PCA transformation, which results in the numeric input variables. However, the features that were not converted are represented by the amount and time, so that the amount represents the amount (transaction cost), and the time represents the seconds spent between one transaction and the other. As for the category attribute, it is variable according to the state of the transaction. In the case of fraud, the category takes a value of 1 and takes a value of zero if the transaction is valid.
7. The 50 most famous fast food chains in America:
It is the food that is sold in a restaurant or shop, and it consists of frozen or pre-cooked foods and is presented in special packages for immediate external orders. It is produced in large quantities, taking into account the speed of presentation and delivery. According to 2018 statistics, the value of fast food production reached hundreds of billions of dollars all over the world. .
The hamburger outlets, as is the case with McDonald’s, are the most common and sought-after in the world, and other fast food outlets that depend on the on-demand assembly of basic ingredients prepared in advance in large quantities.
It can be available in the form of kiosks, mobile cars, or quick service restaurants.
Content :
In our case, this data set is a study of information about the 50 best restaurant chains in America for the year 2021, and we can identify the main points of this data set:
Fast Food Chains – Sales in America in Millions of Dollars – Average Sales Per Unit in Thousands of Dollars – Licensed Stores – Total Number of Units for 2021
The vertical format of the dataset:
• Fast-Food Chains – the name of the fast food chain
• U.S. Systemwide Sales (Millions – U.S Dollars) Systemwide sales are estimated in the millions of dollars
• Average Sales per Unit (Thousands – U.S Dollars)
• Franchised Stores – the number of licensed stores
• Company Stores – the number of company stores
• 2021 Total Units – The number of total units in 2021
• Total Change in Units from 2020 – the number of total changes from the previous year 2020
You will have in your hands the sales data of a number of Wal-Mart stores spread in many regions, so that each store includes several departments, and the task entrusted to you will be to forecast sales related to the department of each store.
In addition, Wal-Mart carries out many promotional campaigns on an ongoing basis, especially the offers that coincide with the major official holidays, and these weeks, including holidays, receive a rating five times higher than the holidays. There is no complete historical data.
csv stores:
This file includes anonymous data for forty-five stores indicating the type and size of the store
train. csv
It is a historical training data file that includes the period between 5/2/2010 to 1/11/2012.
It contains the following fields:
• Store – the store number
• Dept – the department number
• Date – the week
• Weekly_Sales: Sales of a specific department in a particular store
• IsHoliday: Is it a holiday week or not
test. csv
This file differs from train.csv only in that sales must be forecasted for each three departments of the store, date and department in this file, otherwise it is completely identical to the train.csv file
features. csv
This file includes more information, such as the store, department, and the activity of the specified dates, and it contains the following fields:
• Store – the store number
• Date – the week
• Temperature – the average temperature in the area
• Fuel_Price – the price of fuel in the region
• MarkDown1-5 – Anonymous data for marketing write-offs operated by Wal-Mart
• CPI – a value indicating consumer prices
• Unemployment – Unemployment rate
• IsHoliday – Is it a week off or not?
For the break, the four holidays coincide in the following weeks in the data set, noting that not all holidays were included in the data.
For every beginner in data analysis, here are the simple steps for collecting, cleaning, and analyzing data:
In terms of data collection, we wrote a script in the Python language to go through Linkedin, and we collected all the necessary data, and the choice fell on 3 sites: Africa, Canada, and America
Advantages :
* Designation: Job title
Company: The name of the company
* Description: Description of the job and the company
* On site – remotely
* The employee’s workplace
Salary: The salary of the position
* The company’s website
* Standards: Terms of employment such as experience and nature of work
We’ll take reviews of fifty an electronic product from online stores such as Amazon and Best Buy.
Datafiniti includes a data set of revision history, location, classification, and metadata of references. We note that it is a huge data set, so we will learn about the best way to use this data and benefit from it as it should:
The point of benefiting from this data lies in knowing the consumer’s opinion about the process of purchasing the product. For clarification, we define the following points:
* What are the main uses of electronic products?
* Determine the link between ratings and positive reviews.
* How good is the variety of online brands?
What is the function of Datafiniti?
Allows direct access to website data by collecting it from a large number of websites to build common databases for commercial activity, products, and property rights.
تضم عدداً كبيراً من الأفلام والبرامج التلفزيونية ووفق إحصائية فإن المشتركين لديهم تجاوز عددهم 200 مليون مشترك في عام 2021 من جميع أنحاء العالم . تتكون مجموعة البيانات المجدولة في حالتنا هذه قوائم بجميع الأفلام والبرامج التلفزيونية
Netflix المتوفرة على
أضف عليها معلومات عن الممثلين والمخرجين وتقييم الجمهور وغيرها من المعلومات الأخرى
: وفيما يلي بعض الأفكار المهمة
المحتوى المتوفر في بلدان مختلفة *
اختيار محتوى شبيه بواسطة مطابقة السمات المتعلقة بالنص *
إيجاد محتوى قيِّم وممتع من خلال تحليل شبكة الممثلين والمخرجين *
إجراء مقارنة على البث الأكثر شيوعاً في السنوات الأخيرة ( أفلام – البرامج التلفزيونية ) *
تضم مجموعة البيانات هذه 18 ألف سمة وظيفية منها 800 وصف وهمي , تتألف البيانات من نصوص ومعلومات وصفية عن الوظائف , ومن الممكن استخدام مجموعة البيانات لبناء نماذج فرز تكشف السمة المزيفة للوظائف الوهمية
يمكن استخدام مجموعة البيانات للإجابة عن الأسئلة التالية
عليك بناء نموذج فرز يعتمد على خصائص البيانات النصية لتحديد ماهية الوصف الوظيفي حقيقي كان أم احتيالي*
التركيز على الكلمات والعبارات التي تعبر عن وصف وخادع وضبطها والتعرف عليها *
تحديد خصائص الوظائف المتماثلة *
عليك القيام بإجراء تحليل البيانات الاستكشافية على مجموعة البيانات لمعرفة القيم المفيدة من مجموعة البيانات المذكورة *
تشكل مجموعات البيانات في مثالنا هذا بيانات اللاعبين ممثلة بقدراتهم ومهاراتهم من إصدار
FIFA 22 إلى FIFA 15
(“players_22.csv”)
بحيث تتيح هذه البيانات إجراءات إيجاد عدة مقارنات للاعبين معينين وذلك من خلال الإصدار الثامن
FIFA من لعبة
مقارنة شاملة بين ميسي ورونالدو ( مقارنة بإحصائيات حياتهم العملية – المتغيرات في المهارة مع مرور الزمن ) *
* السيولة المناسبة لبناء فريق ينافس على مستوى القارة الأوروبية وعند هذه النقطة لا تتيح الميزانية شراء لاعبين متميزين من تشكيلة الفريق المؤلف من أحد عشر لاعباً .
n٪ تحليل نموذج لأكفأ *
من اللاعبين ( كأن نتناول أكبر نسبة حاصلة على 5% من اللاعبين ) لتحديد وجود الميزات الأساسية في إصدارات اللعبة كالسرعة وخفة الحركة والتحكم بالكرة وبمثال حي على ذلك نلاحظ أن أفضل 5% من اللاعبين الموجودين
FIFA 20 في إصدار
أكثر سرعة وخفة في الحركة
FIFA 15من إصدار
ومن خلال هذا النوع من المقارنات يمكننا استنتاج أنه بوجود أكثر من 5% من أفضل اللاعبين الذين نالوا إحصائيات مرتفعة بالتحكم بالكرة هذا يعني أن اهتمام اللعبة بالجانب المهاري والتقني أكبر من الاهتمام بالجانب البدني وعلى وجه التحديد نرى أن
للاعبين المستبعدين URL عنوان *
لملامح الوجه URL عنوان *
المحملة للاعب مع الشعار الخاص بالنادي أو المنتخب
المعلومات الخاصة باللاعب مثل الجنسية , الفريق الذي يلعب له , تاريخ التولد , الراتب وغيرها *
الإحصائيات الخاصة بمهارات اللاعب والتي تتعلق بالهجوم والدفاع ومهارة حارس المرمى وغيرها من المهارات الأخرى *
كل لاعب موجود في إصدارات *
من الإصدار 15 حتى 22 FIFA لعبة
ميزات كثيرة تفوق الـ 100 *
المركز الذي يلعب به اللاعب ومهمته في النادي والمنتخب *
يكمن النجاح الرئيسي لمكتبة تبيع الكتب المتنوعة في الإقبال الكبير على عمليات الشراء الفعالة للكتب المناسبة في الوقت المناسب وفي هذا السياق تقوم إحدى الفعاليات التجارية الرائدة في مجال الكتب والمكتبات بتنظيم مسابقة لدعم بائعي الكتب تتيح لهم المنافسة في السوق
لذا المنافسة هنا تتمثل بالتنبؤ بكميات الشراء لمحفظة ملكية معينة بوضوح لكل موقع بواسطة بيانات محاكاة
: الوظيفة
خوض غمار المنافسة يتطلب التنبؤ بكميات الشراء لثمانية عناوين لـ 2418 موقعاً متنوعاً , ولبناء النموذج سيتم إتاحة بيانات الشراء المحاكاة من 2349 موقعاً إضافياً مع إشارة جميع البيانات إلى فترة زمنية محدودة , والغاية هي تقدير كميات الشراء لهذه العناوين الثمانية المتنوعة للمواقع المقدر عددها بـ 2418 بأعلى دقة ممكنة
تُعدُّ المناطق المكتظة بالسكان أكثر انتشاراً لمحلات السوبر ماركت وهذا يخلق فيما بينها تنافساً تجارياً ينعكس إيجاباً على حركة السوق ويساهم في نمو الاقتصاد إجمالاً
وسنتناول في بحثنا اليوم مجموعة البيانات التي تمثل مبيعات لثلاثة فروع تابعة لشركة سوبر ماركت لمدة تسعين يوماً وقد اختيرت هذه المجموعة نظراً لسهولة نماذج تحليل البيانات التنبؤية الخاصة بها
:البيانات الخاصة بالتصنيف
معرِّف الفاتورة : وهو عبارة عن رقم تعريفي لفاتورة المبيعات
الفرع : فرع السوبر سنتر ( من أصل ثلاث فروع تم الإشارة إليها
( C و B و A بالرموز
المدينة : المواقع الأكثر حيوية
نوع العميل : يصنف الأعضاء نوع العملاء على أساس المستخدمين لبطاقة العضوية وغير المستخدمين لها
الجنس : يحدد جنس العميل
خط الإنتاج : يعتمد على توزيع المكونات الأساسية كالأطعمة والمشروبات والسياحة والرياضة والإكسسوارات الإلكترونية وإكسسوارات الزينة والأزياء .. وغيرها
سعر المنتج : ويقدر بالدولار الأمريكي
الكمية : وهي عدد المنتجات التي قام العميل بشرائها
الضريبة : وهي رسوم ضريبية تقدر بقيمة 5 % تضاف لقيمة الشراء
السعر الإجمالي : المجموع الكلي للسعر بما فيه الضريبة
التاريخ : تاريخ الشراء ( وهي الفترة المحصورة بين مايو ويوليو من عام 2019 )
الوقت : وهو وقت الشراء ( من 9 صباحاً إلى 8 مساءً )
الدفع : طريقة الدفع التي يستخدمها العميل عند الشراء وهي واحدة من ثلاثة طرق ( دفع مباشر – وبطاقة ائتمان – أرشيف أعمال إلكتروني )
قيمة المنتجات المباعة : COGS
نسبة الهامش الكلّي : نسبة الهامش الكلي
المردود الكلي : الدخل الإجمالي
التصنيف : يعتمد على تصنيف مستويات العملاء بناء على حركة التسوق وفق نسبة تقدر من 1 إلى 10
6. ضبط الإجراءات الاحتيالية الخاصة ببطاقات الائتمان :
تعتبر عملية ضبط عمليات التزوير في معاملات بطاقات الائتمان من الأمور بالغة الأهمية لشركات الائتمان والمتمثلة بالحصول على رسوم من العملاء مقابل منتجات لم يقوموا بشرائها
تضم مجموعة البيانات معاملات نُفِّذَت في يومين بواسطة بطاقات الائتمان في أيلول من عام 2013 بحيث ضُبِطَت عدة معاملات مزورة من أصل آلاف المعاملات , وبهذا نجد نسبة كبيرة من عدم التوازن في مجموعة البيانات هذه , وسجلت عمليات التزوير نسبة 0.172٪ من أصل إجمالي المعاملات
تم الحصول على العناصر الأساسية
V1 ، V2 ، … V28 وهي الميزات
PCA باستخدام تحويل
الذي ينتج عنه متغيرات الإدخال الرقمية , إلا أن السمات التي لم يتم تحويلها تتمثل بالمبلغ والوقت بحيث يمثل المبلغ ( كلفة المعاملة ) , والوقت يمثل الثواني المستهلكة بين المعاملة والأخرى , أما سمة الفئة فهي متغيرة وفقاً للحالة التي عليها المعاملة ففي حالة الاحتيال تأخذ الفئة قيمة 1 وتأخذ قيمة صفر في حال كانت المعاملة سليمة
7. أشهر 50 سلسلة مطاعم للوجبات السريعة في أمريكا :
هو الطعام الذي يباع في مطعم أو متجر وهو مؤلف من أطعمة مجمدة أو مطهوة مسبقاً وتُقدم في عبوات خاصة للطلبات الفورية الخارجية ويتم إنتاجها بكميات كبيرة مع مراعاة السرعة في التقديم والتوصيل ووفق إحصائيات عام 2018 وصلت قيمة إنتاج الوجبات السريعة مئات المليارات من الدولارات في جميع أنحاء العالم
وتعتبر منافذ بيع الهامبرغر كما هو الحال عند ماكدونالدز الأكثر شيوعاً وطلباً في العالم وغيرها من الوجبات السريعة الأخرى التي تعتمد على تجميع وفق الطلب للمكونات الأساسية المعدّة مسبقاً بكميات كبيرة
ويمكن أن تتوفر على شكل أكشاك أو سيارات متنقلة أو مطاعم الخدمة السريعة
المحتوى
في حالتنا هذه تعتبر مجموعة البيانات هي دراسة لمعلومات عن أفضل 50 سلسلة مطاعم في أمريكا لعام 2021 , ويمكننا تحديد النقاط الرئيسية لمجموعة البيانات هذه
سلاسل الوجبات السريعة – المبيعات في أمريكا مقدرة بملايين الدولارات – المعدل الوسطي للمبيعات في كل وحدة مقدرة بآلاف الدولارات – المتاجر المرخصة – العدد الكلي للوحدات لعام 2021
: التنسيق العمودي لمجموعة البيانات
Fast-Food Chains – اسم سلسلة الوجبات السريعة
U.S. Systemwide Sales (Millions – U.S Dollars) – المبيعات على مستوى النظام الأمريكي مقدرة بملايين الدولارات
Average Sales per Unit (Thousands – U.S Dollars) – المعدل الوسطي للمبيعات لكل وحدة مقدرة بآلاف الدولارات
Franchised Stores – عدد المتاجر المرخصة
Company Stores – عدد مخازن الشركة
2021 Total Units – عدد الوحدات الإجمالية في عام 2021
Total Change in Units from 2020 – عدد التغيرات الكلية عن العام السابق 2020
سيكون بين يديك بيانات المبيعات الخاصة بعدد من المتاجر التابعة لـوول مارت والمنتشرة في العديد من المناطق بحيث يتضمن كل متجر عدة أقسام وستكون المهمة الموكلة إليك هي التنبؤ بالمبيعات المتعلقة بالقسم الخاص بكل متجر .
كما وأن وول مارت يقوم بالعديد من الحملات الترويجية بشكل مستمر ولاسيما العروض التي تتزامن مع الأعياد الرسمية الكبرى وتنال هذه الأسابيع بما فيها الإجازات تقييم أعلى بخمس مرات من أيام العطلات ويكمن إثبات الكفاءة في خوض هذه التجربة من خلال تحديد نتائج عمليات الشطب في أسابيع العطلات في ظل عدم وجود بيانات تاريخية كاملة .
مخازن csv
يضم هذا الملف بيانات غير معلومة المصدر لخمس وأربعون متجراً تدل على نوع وحجم المتجر
train.csv
وهو ملف بيانات التدريب التاريخية تشمل الفترة بين 5/2/2010 ولغاية 1/11/2012
: وهو يحوي الحقول التالية
Store – the store number
Dept – the department number
Date – the week
Weekly_Sales : مبيعات قسم معين في متجر معين
IsHoliday : هل هو أسبوع عطلة أما لا
test.csv
train.csv هذا الملف يختلف عن
فقط في وجوب التنبؤ بالمبيعات لكل ثلاثة أقسام من المتجر والتاريخ والقسم في هذا الملف , وعدا ذلك هو مطابق
train.csv تماماً لـملف
features.csv
يتضمن هذا الملف المزيد من المعلومات كالمخزن والقسم ونشاط التواريخ المحددة وهو يحوي الحقول التالية
Store – the store number
Date – the week
Temperature – معدل درجة الحرارة في المنطقة
Fuel_Price – ثمن المحروقات في المنطقة
MarkDown1-5 – بيانات غير معلومة المصدر خاصة بإجراءات الشطب التسويقية التي يشغلها وول مارت
CPI – قيمة تدل على أسعار السمتهلك
Unemployment – معدل البطالة
IsHoliday – هل هو أسبوع عطلة أم لا ؟
للاستراحة تصادف العطلات الأربعة في الأسابيع التالية في مجموعة البيانات مع ملاحظة أنه لم تُدرج جميع العطل في البيانات
Super Bowl: 12 فبراير 10 ، 11 فبراير 11 ، 10 فبراير 12 ، 8 فبراير ، 13
Labor Day: 10 سبتمبر – 10 ، 9 سبتمبر – 11 ، 7 سبتمبر – 12 ، 6 سبتمبر – 13
Thanksgiving: 26-نوفمبر -10 ، 25-نوفمبر -11 ، 23-نوفمبر -12 ، 29-نوفمبر -Christmas: 31 ديسمبر 10 ، 30 ديسمبر 11 ، 28 ديسمبر 12 ، 27 ديسمبر 13
لكل مبتدئ في تحليل البيانات إليك الخطوات البسيطة والتي تتمثل في جمع البيانات وتنظيفها وتحليلها أما من ناحية جمع البيانات فقد قمنا بكتابة نص برمجي بلغة بايثون
Linkedin للانتقال عبر
وقمنا بجمع كل البيانات اللازمة ووقع الاختيار على 3 مواقع : إفريقيا وكندا وأمريكا
سنتناول تقييمات لـخمسين منتجاً إلكترونياً من متاجر إلكترونية عبر الإنترنت مثل أمازون وبيست باي
تشمل مجموعة بيانات Datafiniti
تاريخ المراجعة والموقع والتصنيف والبيانات الوصفية للمراجع , نلاحظ أنها مجموعة بيانات ضخمة لذا سنتعرف على الطريقة المثلى لاستخدام هذه البيانات والاستفادة منها كما يجب
يكمن وجه الاستفادة من هذه البيانات في معرفة رأي المستهلك في عملية شراء المنتج وللتوضيح نحدد النقاط التالية
ما هي الاستخدامات الرئيسية للمنتجات الإلكترونية ؟ *
تحديد الصلة بين التقييمات والمراجعات الإيجابية *
ما مدى جودة الماركات التجارية المتنوعة عبر الإنترنت ؟ *
؟ Datafiniti ما وظيفة
يتيح الوصول المباشر إلى بيانات الموقع الإلكتروني وذلك بتجميعها من عدد كبير من المواقع لبناء قواعد بيانات مشتركة للنشاط التجاري والمنتجات وحقوق الملكية
Data analytics provide key insights and information to support your business planning, growth, and operational efficiencies. Marketing campaigns, product development, and customer recruitment and retention are critical business activities that benefit it when customer relationship management (CRM) data analytics are used to understand trends, reveal subtle patterns, and identify new opportunities and leads.
This article illustrates several ways in which successful business operations gain a competitive advantage with a comprehensive CRM data analytics approach.
Baseline CRM Data Analytics
Data on business sales, marketing, and customers are the foundation for your business operations and strategy. Successful use of CRM software appropriate for your business size and type is key to collecting and analyzing these data. Baseline CRM data analytics are descriptive and diagnostic and are developed automatically from a wide range of sales and customer service performance data.
A good place to start is to relate marketing and product inventory statistics to your customer demographics, experience, behavior, preferences, and sentiments. Important presale data inputs include website click compilations, chat summaries, and social media tracking information. Post-sale metrics incorporate customer satisfaction and tracking data, such as additional purchases, spending pattern changes, and customer churn rates.
Needless to say, this data is valued not just by you and your company, but to others operating for nefarious purposes. Cyber criminals pose a huge and continuous risk, and the more data that’s collected online the bigger the risk of sensitive data being hacked and stolen. As important as gathering customer data, you should protect your business from cyberattacks like malware, viruses and worms, ransomware, and man-in-the-middle attacks. Seek out a reputable IT security company that can help plug any holes in your security and monitor your systems 24/7.
Traditional business analytics analyze average sales and market segments, but CRM data analytics go much deeper to reveal subtle patterns, map long-term customer and product value, and create market predictions. Sales reports document product life cycles and predict future profitability and volume. CRM.org explains that customer life cycle data analytics provide insights to improve customer loyalty and impact. Geographic CRM analytics map customer locations, behavior, and experience to make distribution networks and territory management visually dynamic and easier to plan and execute. Baseline CRM data analytics are a proven commodity in servicing, retaining, and understanding existing customers.
If you plan to make upgrades to your CRM system, it may be expensive for a small business. If your business lacks the necessary financial history to qualify for business loans, you may be forced to explore personal loan options. Before doing so, be sure to check your credit report for irregularities. A ding on your credit history that catches you unaware may scuttle your planned upgrades.
Advertisements
Looking to the Future with Business Process Management and Automation Tools
Advanced CRM data analytics really shine in understanding your target audience’s personality, intentions, and likely behaviors. When integrated with automation tools and business process management (BPM), processes across the organization can be implemented to improve and optimize many aspects of BPM, including new process workflows.
By improving the efficiency of CRM processes, BPM can help businesses save time and money while also improving the quality of their customer service. In addition, BPM can help businesses to better understand their customers’ needs and expectations, leading to improved customer satisfaction. If you’re incorporating BPM for managing your digital processes, it’s important to constantly monitor its effectiveness and act on this information to make improvements.
A forward-looking analysis is needed to guide and shape new marketing campaigns, generate customer leads, and acquire new customers. Market segmentation, targeted content, and personalized messaging are all enhanced with knowledge gleaned from your existing customer database and mapped or projected into the future. Predicting customer characteristics and decision-making processes support your strategy for customer engagement and conversion of leads.
Analyze the factors that led to new customer acquisition and study feedback to learn what worked to pull them in. Wharton School of the University of Pennsylvania notes that sophisticated analytics use big data and artificial intelligence tools to understand where the market is heading and predict emerging market segments and new customer profiles.
Get the most out of your existing customer database by using these tools to sift through detailed, fine-grained website cookie tracking and large-scale patterns hidden in consumer behavior databases. Advanced CRM data analytics dashboards integrate diverse sources of information to help you shape marketing campaigns, product development, and product placement efforts. Use a risk management approach to mitigate any reputational and regulatory issues associated with potential algorithm bias and data privacy concerns.
Be sure to have a plan for how your content integrates with your CRM system. You can learn more here about how to create engaging content for your website. A high-quality content strategy can help boost your business’s profile and customer engagement.
Resources and Planning Improve your business strategy and operations using baseline and advanced CRM data analytics. Understand how CRM analytics fits into a larger-scope BPM, as well as the importance of cybersecurity, and use all the different business tools at your disposal. This will help you gain insight and information on future market trends to guide marketing plans, customer retention, and customer recruitment initiatives.
Written by : Cameron Ward
Advertisements
التحليل العميق للبيانات الخاصة بإدارة علاقات العـملاء
Advertisements
توفر تحليلات البيانات رؤى ومعلومات أساسية لدعم تخطيط أعمالك والنمو والكفاءات التشغيلية. تعد الحملات التسويقية ، وتطوير المنتجات ، وتوظيف العملاء والاحتفاظ بهم من الأنشطة التجارية الهامة التي تفيدها عند استخدام تحليلات بيانات إدارة
(CRM) علاقات العملاء
لفهم الاتجاهات ، وكشف الأنماط الدقيقة ، وتحديد الفرص الجديدة والعملاء المتوقعين
توضح هذه المقالة العديد من الطرق التي تكتسب بها العمليات التجارية الناجحة ميزة تنافسية من خلال نهج
CRM تحليل بيانات شامل
:الأساسيةCRMتحليلات بيانات
البيانات المتعلقة بمبيعات الأعمال والتسويق والعملاء هي الأساس لعمليات واستراتيجية عملك
CRM يعد الاستخدام الناجح لبرنامج
المناسب لحجم ونوع عملك هو المفتاح لجمع هذه البيانات وتحليلها
CRM تعد تحليلات بيانات
الأساسية وصفية وتشخيصية ويتم تطويرها تلقائيًا من مجموعة واسعة من بيانات أداء المبيعات وخدمة العملاء
أفضل مكان للبدء هو ربط إحصاءات مخزون المنتجات والتسويق بالتركيبة السكانية للعملاء ، والخبرة ، والسلوك ، والتفضيلات ، والمشاعر. تتضمن مدخلات بيانات ما قبل البيع الهامة مجموعات نقرات موقع الويب وملخصات الدردشة ومعلومات تتبع الوسائط الاجتماعية. تتضمن مقاييس ما بعد البيع رضا العملاء وبيانات التتبع ، مثل عمليات الشراء الإضافية وتغييرات نمط الإنفاق ومعدلات تضاؤل العملاء
ويجدر الذكر بأن هذه البيانات لا تقدر قيمتها أنت وشركتك فحسب ، بل للآخرين الذين يعملون لأغراض شائنة. يشكل مجرمو الإنترنت خطرًا كبيرًا ومستمرًا ، وكلما زادت البيانات التي يتم جمعها عبر الإنترنت ، زادت مخاطر اختراق البيانات الحساسة وسرقتها. على الرغم من أهمية جمع بيانات العملاء ، يجب عليك حماية عملك من الهجمات الإلكترونية مثل البرامج الضارة والفيروسات
man-in-the-middle وبرامج الفدية وهجمات
ابحث عن شركة أمن تكنولوجيا معلومات حسنة السمعة يمكنها المساعدة في سد أي ثغرات في أمنك ومراقبة أنظمتك على مدار الساعة طوال أيام الأسبوع
تحلل تحليلات الأعمال التقليدية متوسط المبيعات وقطاعات السوق
CRM لكن تحليلات بيانات
تتعمق أكثر لتكشف عن أنماط دقيقة ، وتعيين قيمة العملاء والمنتج على المدى الطويل ، وإنشاء توقعات السوق. توثق تقارير المبيعات دورات حياة المنتج وتتنبأ بالربح والحجم في المستقبل
CRM.org يوضح
أن تحليلات بيانات دورة حياة العميل توفر رؤى لتحسين ولاء العملاء وتأثيرهم
CRM تحدد تحليلات
الجغرافية مواقع العملاء وسلوكهم وخبراتهم لجعل شبكات التوزيع وإدارة المناطق ديناميكية بصريًا وأسهل في التخطيط والتنفيذ
CRM تعد تحليلات بيانات
الأساسية سلعة مثبتة في خدمة العملاء الحاليين والاحتفاظ بهم وفهمهم
إذا كنت تخطط لإجراء تحديثات
الخاص بك CRM لنظام
فقد يكون ذلك مكلفًا بالنسبة إلى شركة صغيرة . إذا كان عملك يفتقر إلى أرضية مالية تؤهلك للحصول على قروض تجارية ، فقد تضطر إلى استكشاف خيارات القروض الشخصية. قبل القيام بذلك ، تأكد من مراجعة تقرير الائتمان الخاص بك لمعرفة المخالفات. قد يؤدي الخلل في وضعك الائتماني الذي يجهلك إلى إفساد ترقياتك المخطط لها
Advertisements
:التطلع إلى المستقبل باستخدام أدوات إدارة عمليات الأعمال والأتمتة
CRM تتألق تحليلات بيانات
المتقدمة حقًا في فهم شخصية جمهورك المستهدف ونواياك وسلوكياته المحتملة. عند التكامل مع أدوات الأتمتة
(BPM) وإدارة عمليات الأعمال
يمكن تنفيذ العمليات عبر المؤسسة لتحسين
BPM العديد من جوانب
بما في ذلك عمليات سير عمل العمليات الجديدة
CRM من خلال تحسين كفاءة عمليات
BPM يمكن أن تساعد
الشركات في توفير الوقت والمال مع تحسين جودة خدمة العملاء أيضًا. بالإضافة إلى ذلك ، يمكن أن تساعد الشركات على فهم احتياجات .وتوقعات عملائها بشكل أفضل ، مما يؤدي إلى تحسين رضا العملاء
BPM إذا كنت تقوم بدمج
لإدارة عملياتك الرقمية ، فمن المهم أن تراقب فعاليتها باستمرار وتتصرف بناءً على هذه المعلومات لإجراء تحسينات
هناك حاجة إلى تحليل دقيق لتوجيه حملات التسويق الجديدة وتشكيلها ، وإنشاء عملاء محتملين ، واكتساب عملاء جدد. يتم تحسين تجزئة السوق والمحتوى المستهدف والرسائل الشخصية من خلال المعرفة المستخلصة من قاعدة بيانات العملاء الحالية الخاصة بك وتعيينها أو توقعها في المستقبل. يدعم التنبؤ بسلوك العملاء وعمليات اتخاذ القرار استراتيجيتك لمشاركة العملاء وتحويل العملاء المحتملين
قم بتحليل العوامل التي أدت إلى اكتساب عملاء جدد ودراسة التعليقات لمعرفة ما نجح في جذبهم. تلاحظ مدرسة وارتون بجامعة بنسلفانيا أن التحليلات المتطورة تستخدم البيانات الضخمة وأدوات الذكاء الاصطناعي لفهم توجه السوق والتنبؤ بالأسواق الناشئة شرائح وملفات تعريف العملاء الجديدة
احصل على أقصى استفادة من قاعدة بيانات العملاء الحالية باستخدام هذه الأدوات للتدقيق في تتبع ملفات تعريف ارتباط موقع الويب المفصل والدقيق والأنماط المخفية واسعة النطاق في قواعد بيانات سلوك المستهلك. تعمل لوحات معلومات
CRMتحليلات بيانات
المتقدمة على دمج مصادر متنوعة للمعلومات لمساعدتك في تشكيل حملات التسويق وتطوير المنتجات وإجراءات وضع المنتج. استخدم نهج إدارة المخاطر للتخفيف من أي مشكلات تتعلق بالسمعة والتنظيم مرتبطة بتحيز الخوارزمية المحتمل ومخاوف خصوصية البيانات
تأكد من وجود خطة لكيفية تكامل المحتوى الخاص بك
الخاص بك CRM مع نظام
يمكنك معرفة المزيد هنا حول كيفية إنشاء محتوى جذاب لموقعك على الويب. يمكن أن تساعد استراتيجية المحتوى عالي الجودة في تعزيز الملف الشخصي لنشاطك التجاري ومشاركة العملاء
الموارد والتخطيط
قم بتحسين استراتيجية عملك وعملياتك باستخدام
الأساسية والمتقدمة CRM تحليلات بيانات
CRM افهم كيف تتناسب تحليلات
أوسع نطاقًا BPM مع
بالإضافة إلى أهمية الأمن السيبراني ، واستخدم جميع أدوات الأعمال المختلفة الموجودة تحت تصرفك. سيساعدك هذا على اكتساب نظرة ثاقبة ومعلومات حول اتجاهات السوق المستقبلية لتوجيه خطط التسويق والاحتفاظ بالعملاء ومبادرات توظيف العملاء
Today we will learn to create attractive and valuable bar charts with a simple set of code backed by some experience and technical skill.
There is no doubt that mastering the design of graphic visualizations is an important factor for any data scientist, so in this article we will learn about the most important procedures necessary to complete these designs using Python (Matplotlib & Seaborn).
Dataset:
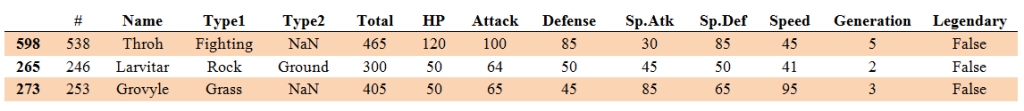
In our research today, we will discuss a data set that includes information about Pokemons due to the diversity of its characteristics.
They are characterized by continuity (Pokemons are characterized by defense, attack and other combat skills).
It is characterized by a variety of groups (species, name and genes).
And logical (legendary) and thus we have a balance of a variety of models to create charts.
And to get this set of data immediately from the store by the main code related to our search as shown in this table:
Knowing the purpose of the analysis process is the initial stage for designing strong graphic representations by finding solutions to the questions raised about the data available to us.
Our data set can represent answers to many of the questions posed, and what the creation of an excellent chart depends on is finding a solution to the question asked about categorical values such as determining the type of Pokemon:
In our example presented in this research, the most appropriate question to be answered is:
What types of Pokemons have the highest attack values?
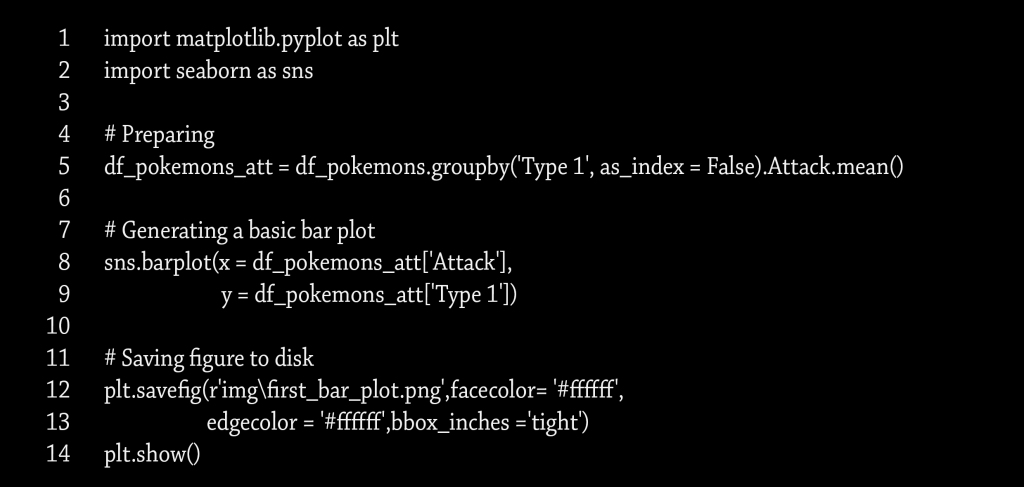
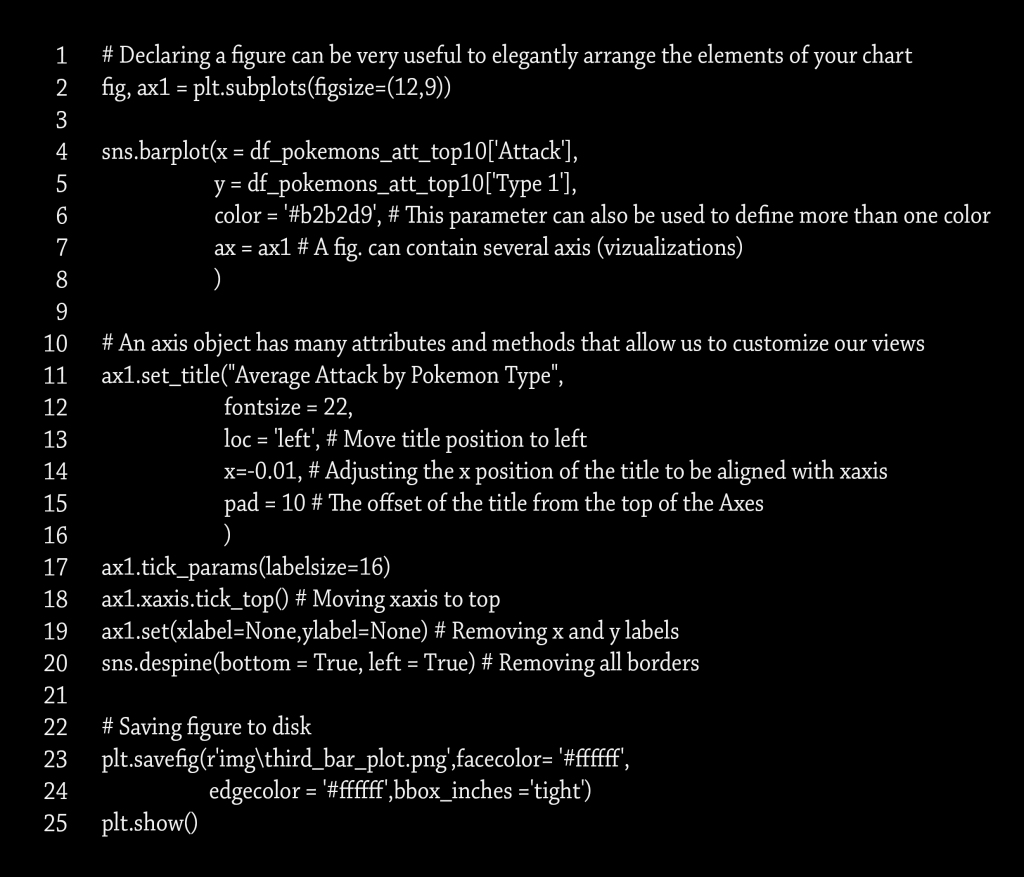
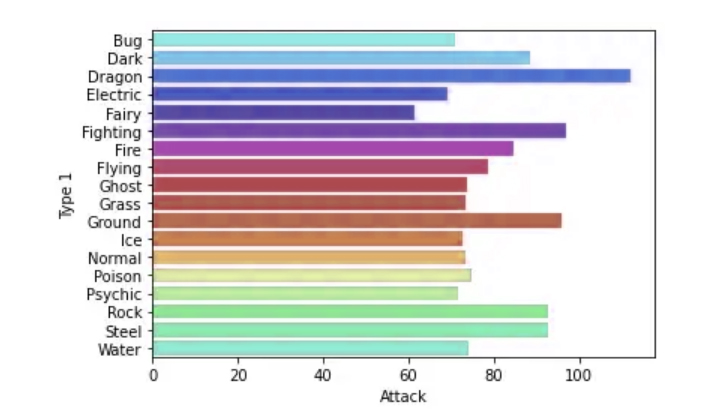
To prepare for the answer to this question we will start by preparing the data and creating the first “master” bar chart using Group by and we can plot the data using Seaborn
Observing what resulted in the scheme, it becomes clear to us that the information calls into question the validity of the answer to the question posed above, as it does not show us an accurate answer about the type of the highest attacking Pokemon.
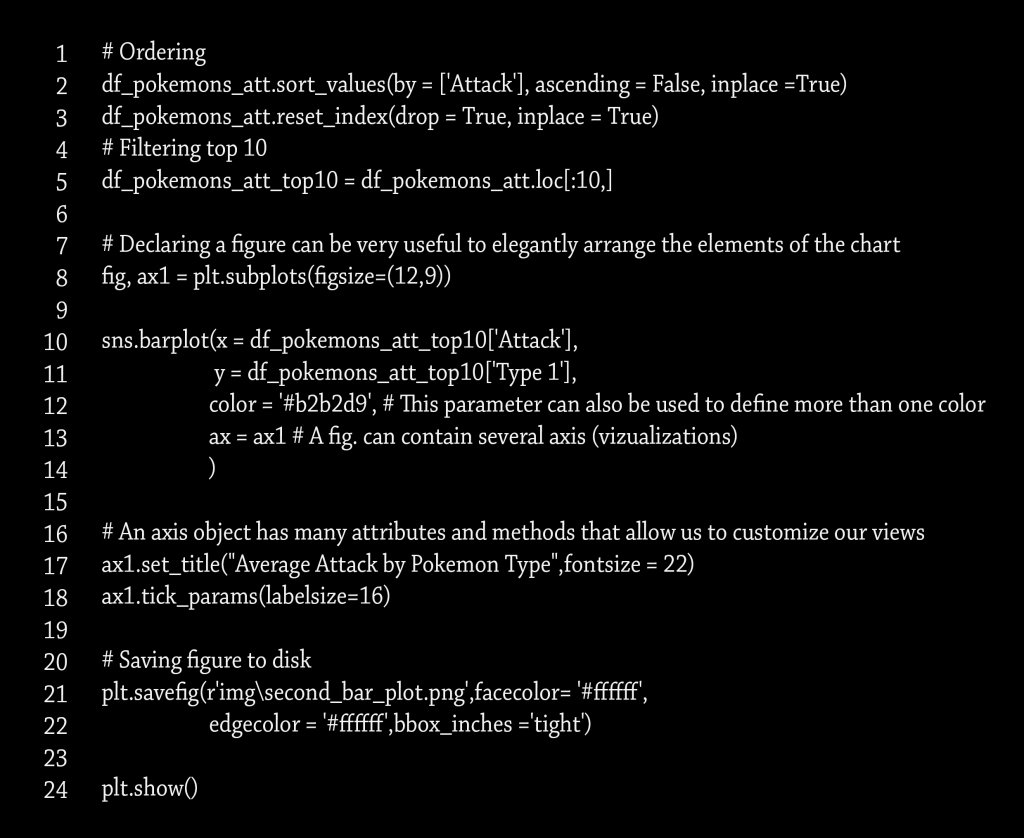
In order to reach an accurate answer, we must adjust the data according to an ascending or descending pattern and determine the number of available items. When we reach the top ten positions, for example, we can exclude random data and make the chart more organized and useful.
With more coordination and organization, we should not neglect the aspect of choosing the most appropriate colors, and this is embodied in selecting only one color. The value of the chart is derived from the appropriateness of the colors, and choosing different colors loses this value. This is done through a few code formats that enable us to add a title, change the font size, and adjust the image size.
We can make use of the color selection feature using Hex code.
Here is an explanation of how to write the code:
Advertisements
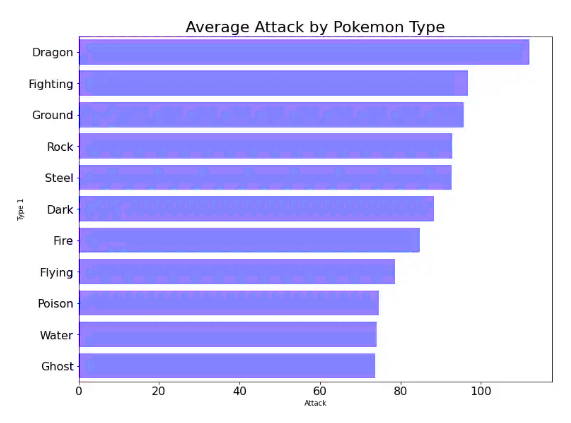
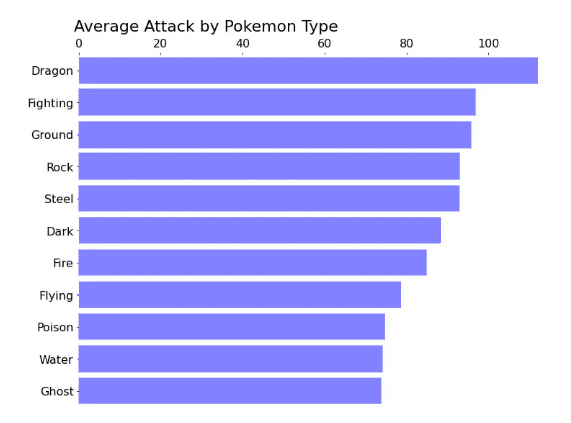
We notice that we are beginning to see a more organized result, and here we are about to achieve a more accurate answer by identifying the type of pokemon that is the best attacker, and what increases the graphic representation is more quality, the reset dimensions, in addition to the appropriate title that attracts the attention of the reader.
Despite the quality that we have achieved, it is possible to show a more organized and accurate scheme. This is done by removing redundant information that is useless. In our scheme, we note for each axis a name that indicates it, and it is also shown in the title. So here, repetition is useless.
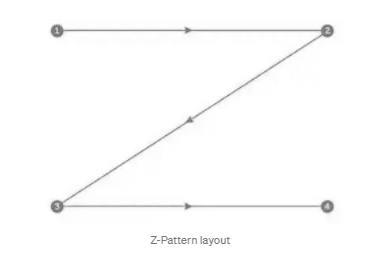
The direction of the graph also has implications that help the reader to identify the chart before reading the data itself. The prevailing definition is that reading the visualizations from left to right or from top to bottom enables the viewer to know the information that will be read first, and this is called the Z pattern.
Applying this pattern to our chart, we will move the title to the left to be read first and shift the X axis to the top for the same reason.
We have the following codes:
Thus, we have obtained an ordered and understandable graphic representation, and it can be said that we have obtained the required goal by creating an ideal bar chart visualization.
Advertisements
أنشئ المخطط الشريطي الخاص بك للوصول إلى مستوى متقدم بواسطة بايثون
Advertisements
سنتعلم اليوم إنشاء مخططات شريطية جذابة وقيِّمة وبمجموعة بسيطة من التعليمات البرمجية مدعومة ببعض الخبرة والمهارة الفنية
مما لا شك فيه أن إتقان تصميم المخططات البيانية هو عامل مهم لدى أي عالِم بيانات لذا سنتعرف في هذا المقال على أهم الإجراءات اللازمة لإنجاز هذه التصاميم على أكمل وجه
(Matplotlib & Seaborn) باستخدام بايثون
:مجموعة البيانات
في بحثنا اليوم سنتناول مجموعة بيانات تضم معلومات عن البوكيمونات نظراً لتنوع خصائصها
فهي تتصف بالاستمرارية ( فالبوكيمونات تتصف بالدفاع والهجوم وغيرها من المهارات القتالية )
وتتصف بزمر متنوعة ( الأنواع والاسم والجينات )
والمنطقية ( الأسطورية ) وبهذا يصبح لدينا رصيد من نماذج متنوعة لإنشاء المخططات البيانية
وللحصول على مجموعة البيانات هذه بشكل فوري من المخزن بواسطة الكود الرئيسي المتعلق ببحثنا هذا كما هو موضح في هذا الجدول
معرفة الهدف من عملية التحليل هو المرحلة الأولية لتصميم تمثيلات بيانية قوية وذلك عن طريق إيجاد الحلول للأسئلة المطروحة حول البيانات المتاحة لدينا
مجموعة البيانات الموجودة لدينا يمكن أن تمثل إجابات للعديد من الأسئلة المطروحة , وما يعتمد عليه إنشاء مخطط بياني ممتاز هو إيجاد حل للتساؤل المطروح عن قيم فئوية كتحديد نوع البوكيمون
وفي مثالنا المطروح في هذا البحث السؤال الأنسب المراد الإجابة عليه هو
ما هي أصناف البوكيمونات التي تمتلك أعلى قيم من حيث الهجوم ؟ *
“وللتحضير للإجابة عن هذا السؤال سنبدأ بتجهيز البيانات وإنشاء المخطط الشريطي الأول ” الرئيسي
Group by باستخدام
Seaborn ويمكننا رسم البيانات باستخدام
بملاحظة ما نتج عنه المخطط يتضح لنا أن المعلومات وتدعو إلى الشك في صحة الإجابة على السؤال المطروح آنفاً إذ لا تظهر لنا إجابة دقيقة عن نوع البوكيمون الأعلى هجوماً
وللوصل إلى إجابة دقيقة لابد لنا من ضبط البيانات وفق نسق تصاعدي أو تنازلي وتحديد عدد الأصناف المتاحة وعند الوصول إلى تحديد المراكز العشر الأولى مثلاً يصبح بإمكاننا استبعاد البيانات العشوائية وجعل المخطط أكثر تنظيماً وفائدة
وبمزيد من التنسيق والتنظيم لا يجب أن نهمل جانب الاختيار الأنسب للألوان ويتجسد ذلك بتحديد لون واحد فقط فقيمة المخطط مستمدة من مناسبة الألوان واختيار الألوان المختلفة تفقده هذه القيمة وهذا يتم من خلال بضعة أنساق من التعليمات البرمجية تمكننا من إضافة عنوان وتغيير حجم الخط وتعديل قياس الصورة يمكننا الاستفادة من خاصية اختيار الألوان
Hex باستخدام كود
: وفيما يلي توضيح لطريقة كتابة الكود
Advertisements
نلاحظ أننا بدأنا نلمس نتيجة أكثر تنظيماً وها نحن على وشك تحقيق إجابة أكثر دقة بتحديد نوع البوكيمون الأفضل هجوماً , ومما زاد التمثيل البياني أكثر جودة إعادة ضبط الأبعاد إضافة إلى العنوان المناسب الذي يلفت انتباه القارئ
ورغم الجودة التي وصلنا إليها إلا أنه بالإمكان إظهار مخطط أكثر تنظيماً ودقة ويتم ذلك عن طريق إزالة المعلومات المكررة التي لا فائدة منها وفي مخططنا نلاحظ لكل محور اسم يدل عليه وهي موضحة أيضاً في العنوان إذاً هنا التكرار لا فائدة منه كما وأن لاتجاه الرسم البياني مدلولات تعين القارئ على التعرف على المخطط قبل قراءة البيانات نفسها فالتعريف السائد أن قراءة التصورات من اليسار إلى اليمين أو من الأعلى إلى الأسفل يمكن الناظر من معرفة المعلومات التي سيتم قراءتها أولاً
Z وهذا ما يسمى بالنمط
وبتطبيق هذا النمط على مخططنا سنقوم بنقل العنوان إلى اليسار لتتم قراءته أولاً
X وإزاحة المحور
: إلى الأعلى للسبب ذاته فينتح لدينا الرموز التالية
وبهذا نكون قد حصلنا على تمثيل بياني مرتب ومفهوم ويمكن القول أننا حصلنا على الغاية المطلوبة بإنشاء تمثيل بياني شريطي مثالي
There is no work, project, or commercial activity that does not need analysis or statistics, even if it is on a small scale, whether to know the movement of buying and selling, customer interaction, the type of product required, the reasons for profit and loss, and other elements of commercial activity.
However, with the development of commercial activities techniques such as marketing, selling and buying, it became necessary to study the analysis processes of the data that make up the project in more depth and to acquire the necessary experience to conduct advanced statistical operations that yield more accurate and effective results.
Start learning coding and building code:
As a person who does not have any knowledge or experience in the basics of programming that starts from coding and building codes, you must find it difficult to start learning coding, but this thinking is not suitable for those who aspire to be a data scientist, as the determination and insistence on learning coding is an essential pillar in initiating the process This learning, no matter how complicated it may seem at first, and what also contributes to the correct learning of coding is the help of a person who has sufficient experience in programming who directs you to the right path in the learning journey and draws your attention to errors and helps you on how to avoid them, and perhaps the best programming language for a learner to start with is Python They are excellent for data analysis due to their multiple characteristics that can be employed to deal with different types of data
Learn programming:
1. Codecademy platform:
Codecademy platform is the best place to start learning programming and Python will be the best choice to start learning data analysis
The advantage of this platform lies in several points, including that it allows writing code on the browser directly, and this is not easily available in other platforms. That in the event that there is a defect resulting from your writing a software code, then you will know that the error is in the structure of the code itself and not as a result of an error in preparing the program that you need to install on the computer
Also, the smooth sequence and flexible transition between learning stages is very comfortable for beginners and removes some of the fear from learning programming
Interestingly, the courses on this platform are free, of high quality, and are a very good starting point for new learners
Advertisements
Learn to analyze data:
2. Coursera Majored in Data Science from Johns Hopkins :
The free version of the Coursera Data Science specialization provides learners with a free token certificate, but it is not officially accredited, but its importance lies in the moral value that you get as a data science learner, as it will qualify you to show the skills you acquired in the training course in dealing with technical interviews
Since this educational series includes teaching the R language as well, given that it is an excellent language for statistical analysis, and it is the preferred language for academics, however, most analysts prefer the Python language to perform the data analysis process, especially in companies and private and public bodies.
It is clear from the quality of these Python courses that they are directed to the category of software engineers who have a desire to advance to data science, so you find these courses assume that you have high programming skills in advance
What distinguishes Coursera data science is that it starts from the beginning and helps to understand the main principles of the data science mechanism, especially addressing programming in R, and establishes the general concept of master data technology, analysis and machine learning in a broader sense through which you can start completely comfortably with the use of code to analyze data, which gives motivation Larger to complete educational courses.
Learn to query databases:
3. Stanford Online Course
In fact, Data Science Coursera did not include SQL in its training curriculum, so it is advised to go to the Stanford platform to learn SQL on your own via the Internet. This platform is run by professional trainers who use simple explanatory models in a variety of ways.
Learning SQL is very important for data scientists in terms of extracting data from databases, and once you have completed the Stanford SQL course, you can apply for a job in data science
Install information:
4. edx Principles of Data Analysis:
It is important for those who study data science to learn the basic principles of data analysis by edx, and most importantly, to review each learner’s principles and concepts to consolidate and consolidate the information he received in the training courses.
One of the most important elements of correct learning is training at the hands of different trainers, so the learner acquires various skills and becomes able to present wide options in processing and analysis, so it becomes easier when the learner intends to turn to machine learning and advanced statistics.
Applying to a job in data science:
It can be said that having sufficient experience and the required technical skills enhances your chance of passing the final interview and thus obtaining a suitable job in data science. You are the person that the bosses will look for, as the basic requirement for them is a person with capabilities that raise the technical and material level of the company, relying on those experiences that you have gained. In the training courses and in your practical experiences that they will learn about at the interview, and they know full well that your balance of knowledge and experience is a valuable treasure that they will never neglect.
This qualitative transition constitutes an important stage in your scientific and practical life. Here you are now a data scientist that everyone is looking for, so be sure to choose a suitable company that will open new horizons for you full of success and permanent development. In the end, we can conclude from the aforementioned that the difficulties and challenges that will stand in your way during the beginning of the journey of learning programming should not be an obstacle that makes you feel frustrated by several attempts that may fail, but on the contrary, you should invest every bump in searching for solutions that refine your expertise, you will not You will learn only if you make a mistake, and you will not get up unless you fall. Know that if you pass the stage of fear and dread and start to gain the necessary confidence, your motivation will grow and your desire to complete the path that will lead you to the goal you aspire to will increase.
Advertisements
كيف تنتقل من مستوى صفر في البرمجة إلى عالِم بيانات
في 6 أشهر ؟
Advertisements
هناك أربع أدوات يمكنك تعلمها مجاناً
المبادئ الأساسية لتنمية المهارات
لا يوجد عمل أو مشروع أو نشاط تجاري لا يحتاج إلى تحليل أو إحصاء وإن كان على نطاق ضيِّق سواء لمعرفة حركة البيع والشراء وتفاعل الزبائن ونوعية المنتج المطلوب وأسباب الربح والخسارة وغيرها من مقومات النشاط التجاري
ولكن ومع تطور تقنيات الفعاليات التجارية من تسويق وبيع وشراء أصبح لابد من التعمق أكثر في دراسة عمليات التحليل للبيانات المكوِّنة للمشروع واكتساب الخبرة اللازمة لإجراء عمليات الإحصاء المتقدمة التي تعود بنتائج أكثر دقة وفاعلية
البدء في تعلم الترميز وبناء الكودات البرمجية : كشخص لا يملك أي معرفة أو خبرة في أساسيات البرمجة التي تبدأ من الترميز وبناء الكودات لابد وأنك ستجد صعوبة في بدء تعلم الترميز ولكن هذا التفكير لا يناسب من يطمح لأن يكون عالِم بيانات , إذ أن العزيمة والإصرار على تعلم الترميز هي ركن أساسي في الشروع في عملية التعلم هذه مهما بدا الأمر معقداً في البداية , ومما يسهم أيضاً في التعلم الصحيح للترميز هو الاستعانة بشخص يمتلك الخبرة الكافية في البرمجة يوجهك إلى الطريق الصحيح في رحلة التعلم ويلفت نظرك إلى الأخطاء ويساعدك على كيفية تلافيها , ولعل أفضل لغة برمجة يبدأ بها المتعلم هي لغة بايثون فهي ممتازة لتحليل البيانات نظراً لما لها من خصائص متعددة يمكن توظيفها للتعامل مع مختلف أنواع البيانات
تعلم البرمجة
1. Codecademyمنصة
Codecademy تعتبر منصة
المكان الأفضل لبدء تعلم البرمجة وستكون بايثون الخيار الأفضل لبدء تعلم تحليل البيانات
تكمن ميزة هذه المنصة في عدة نقاط منها أنها تتيح كتابة التعليمات البرمجية على المتصفح مباشرة وهذا مالا يتوفر بسهولة في منصات أخرى فعملية تنصيب بيئات البرمجة على جهاز الكمبيوتر تشكل صعوبة لدى بعض المستخدمين لذا فهذه الميزة التي توفرها هذه المنصة تعتبر بداية مثالية مريحة للمبتدئين أضف على ذلك أنه في حال وجود خلل نتج عن كتابتك لكود برمجي فستعلم عندها أن الخطأ في بنية الكود نفسه وليس نتيجة خطأ في إعداد البرنامج الذي تحتاج إلى تنصيبه على الكمبيوتر
كما أن التسلسل السلس والانتقال المرن بين مراحل التعلم يعتبر مريحاً جداً للمبتدئين ويزيل بعض الرهبة من تعلم البرمجة
والمثير للاهتمام أن هذه الدورات في هذه المنصة مجانية وهي ذات جودة عالية وتعتبر نقطة بدء ممتازة جداً للمتعلمين الجدد
Advertisements
:تعلم تحليل البيانات
2. تخصص كورسيرا في علم البيانات
:Johns Hopkinsمن جامعة
تتيح النسخة المجانية من تخصص علم بيانات كورسيرا للمتعلمين شهادة رمزية مجانية ولكنها ليست معتمدة رسمياً إلا أن أهميتها تكمن في القيمة المعنوية التي تحصل عليها كمتعلم لعلم البيانات بحيث ستؤهلك لإظهار المهارات التي اكتسبتها في الدورة التدريبية في التعامل مع المقابلات التقنية
بما أن هذه السلسلة التعليمية يدخل في منهاجها
أيضاً على اعتبار R تعليم لغة
أنها لغة ممتازة للتحليل الإحصائي وهي اللغة المفضلة لدى الأكاديميين إلا أن أغلب المحللين يفضلون لغة بايثون لإجراء عملية تحليل البيانات وخاصة في الشركات والهيئات الخاصة والعامة
يتضح من خلال نوعية هذه الدورات الخاصة ببايثون أنها موجهة لفئة مهندسي البرمجيات الذين لديهم الرغبة في الارتقاء إلى علم البيانات لذا تجد هذه الدورات تفترض أنك تملك مهارات عالية في البرمجة مسبقاً ما يميز علوم بيانات كورسيرا هو أنها تنطلق منذ البداية وتساعد على استيعاب المبادئ الرئيسية لآلية علم البيانات ولاسيما التطرق إلى
R البرمجة في
وترسخ المفهوم العام لتقنية البيانات الرئيسية والتحليل والتعلم الآلي بمعنى أشمل يمكنك من خلالها أن تبدأ بأريحية تامة مع استعمال الكود لتحليل البيانات مما يعطي دافع أكبر لإتمام الدورات التعليمية
:تعلم الاستعلام قواعد البيانات
3. دورة ستانفورد عبر الإنترنت
في الواقع لم يقم تخصص علوم البيانات كورسيرا
ضمن منهجه التدريبي SQL بإدخال
لذا ينصح بالتوجه إلى
ذاتياً SQL لتعلم Stanford منصة
عبر الإنترنت فهذه المنصة يديرها مدربون محترفون يستخدمون نماذج توضيحية بسيطة بأساليب متنوعة
SQL يعتبر تعلم
مهم جداً لعلماء البيانات من جهة استخلاص البيانات من قواعد البيانات , وما إن تنتهي من استكمال
SQL دورة ستانفورد
يمكنك التقدم لوظيفة في علم البيانات
تثبيت المعلومات
4. مبادئ تحليل البيانات edx
من المهم لمن يدرس علم البيانات أن يتعلم المبادئ الأساسية لتحليل البيانات بواسطة edx والأهم مراجعة كل متعلمه من مبادئ ومفاهيم لتثبيت وترسيخ المعلومات التي تلقاها في الدورات التدريبية
ومن أهم مقومات التعلم الصحيح هو التدرب على أيدي مدربين مختلفين فبذلك يكتسب المتعلم مهارات متنوعة فيصبح قادر على طرح خيارات واسعة في المعالجة والتحليل فيصبح الأمر أسهل عندما ينوي المتعلم التوجه إلى التعلم الآلي والإحصاء المتقدم
:التقدم إلى وظيفة في علم البيانات
يمكن القول أن امتلاكك للخبرة الكافية والمهارات التقنية المطلوبة يعزز فرصتك في تجاوز المقابلة النهائية وبالتالي حصولك على وظيفة مناسبة في علم البيانات , أنت الشخص الذي سيبحث عنه رؤساء العمل فالمطلب الأساسي بالنسبة لهم هو شخص يتمتع بقدرات ترفع المستوى الفني والمادي للشركة معتمدين على تلك الخبرات التي اكتسبتها في الدورات التدريبية وفي تجاربك العملية التي سيتعرفون عليها عند المقابلة وهم يعرفون تمام المعرفة أن رصيدك من المعارف والخبرات هو بمثابة كنز ثمين لن يفرطوا به أبداً
هذا الانتقال النوعي يشكل مرحلة هامة في حياتك العلمية والعملية , ها أنت الآن أصبحت عالِم بيانات يبحث عنه الجميع فاحرص على اختيار شركة مناسبة تفتح لك آفاق جديدة مكللة بالنجاح والتطور الدائم
وفي النهاية يمكن أن نستخلص مما ذُكر آنفاً أن الصعوبات والتحديات التي ستعترض طريقك أثناء بداية رحلة تعلم البرمجة لا يجب أن تشكل عائقاً يجعلك تشعر بالإحباط جراء عدة محاولات ربما تبوء بالفشل , بل على العكس يجب أن تستثمر كل عثرة في البحث عن الحلول التي تصقل خبراتك فلن تتعلم إلا إذا أخطأت ولن تنهض إلا إذا سقطت واعلم أنك إذا تجاوز مرحلة الخوف والرهبة وبدأت تكتسب الثقة اللازمة وسينمو عندك الدافع وستزيد الرغبة في إكمال الطريق الذي سيوصلك إلى هدفك الذي ترنو إليه
Today, we will discuss the basic concepts that data analysts rely on while practicing their job in data science, and we will go together to identify the main stages that we will pass through during our research from examples of work in the VBO Bootcamp / Miuul project.
1. Forming an idea of the problem to be addressed:
The most important thing that a data scientist begins to do in addressing any issue related to his professional work is to understand the problem that he must solve, and then understand the benefits that result from that solution to the institution or entity in which he works.
A correct understanding of the type of problem or the nature of the work required helps to determine the most appropriate mechanism to address the problems and thus enhance the experiences gained through experience and practice. In our example, we will see different solutions with two different mechanisms.
The data set used:
The data that we will use in this project includes outputs in order to determine the budget necessary to attract the largest possible number of customers, classify them, and prepare advertising programs according to their requirements. Therefore, we followed the regression method to determine the value of the budget, and we followed the aggregation method to classify customers.
The importance of this strategy lies in our ability to determine the level of production based on our knowledge of the profit rates that we will reach
2- Determine the type of data we deal with
In order to carry out this stage accurately, it requires knowledge of several points:
A. What is the type of correlation between the data in our example?
B. What is the primary origin of this data?
C. Are there any null values in this data?
D. Is there a defect in the data?
E. Is there a specific time for the origin of this data?
F. What are the meanings of the columns in the data set?
And your use of the Kaggle data set will make your identification of the data type more necessary to obtain accurate results.
* It is necessary to familiarize yourself with the instructions of the main source of data, and through this you can determine the outliers and empty records, if any.
* Verifying all variables (categorical, numerical, and numeric) that are primarily related to the data of our project.
* Checking the numerical variables that have been identified to assign outliers, if any.
* Identifying the categories that are frequently present within the data and the categories that are hardly present, by exploring the locations of the categorical variables.
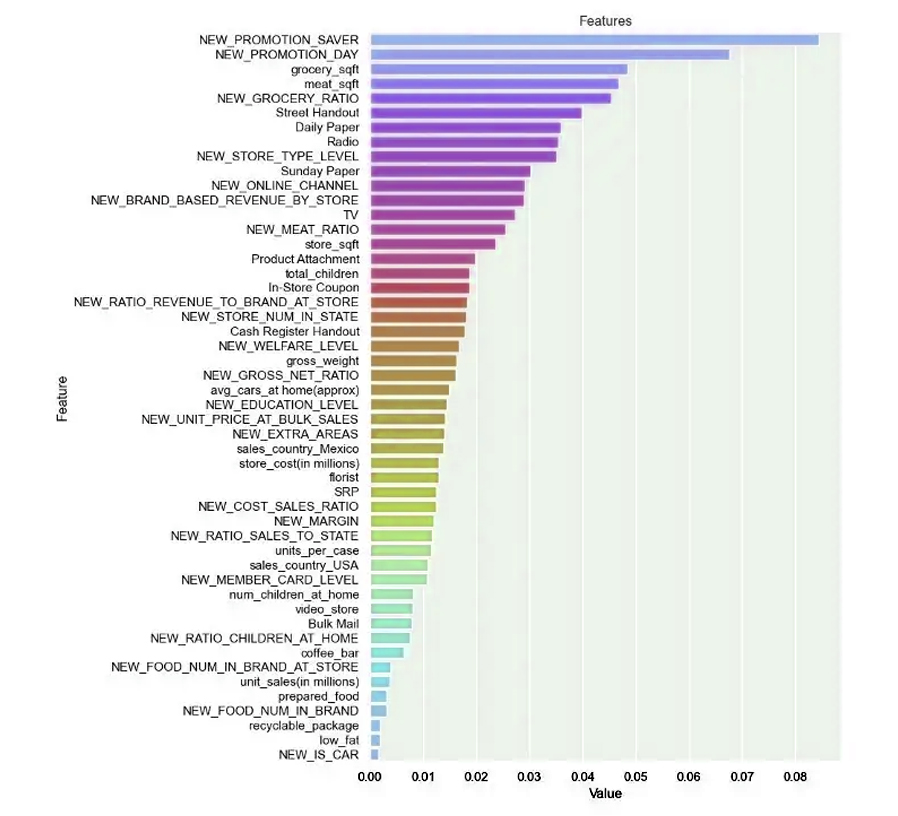
* Analyze the correlation between variables to see their effect on each other, and this procedure helps us to keep the variable with the highest correlation with the dependent variable during selection.
* Formation of a general idea of the characteristics and advantages of each element of the project.
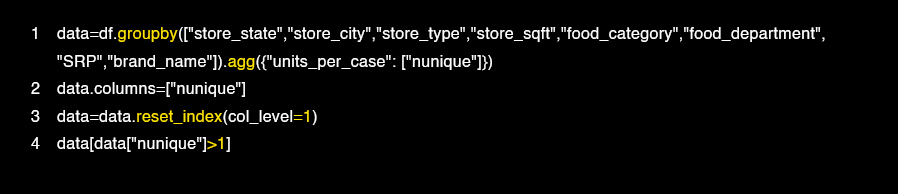
This is a practical application of the compilation that we conducted on the information indicating the relationship between the producer and the consumer in a specific population unit and one of the shops located in that area:
The results show that we have: STORE_SALES=UNIT_SALES*SRP
Under normal circumstances, you cannot understand the meaning of this concept, so you will have to search on Google to make sure that the assembly is correct.
3- Data Preprocessing
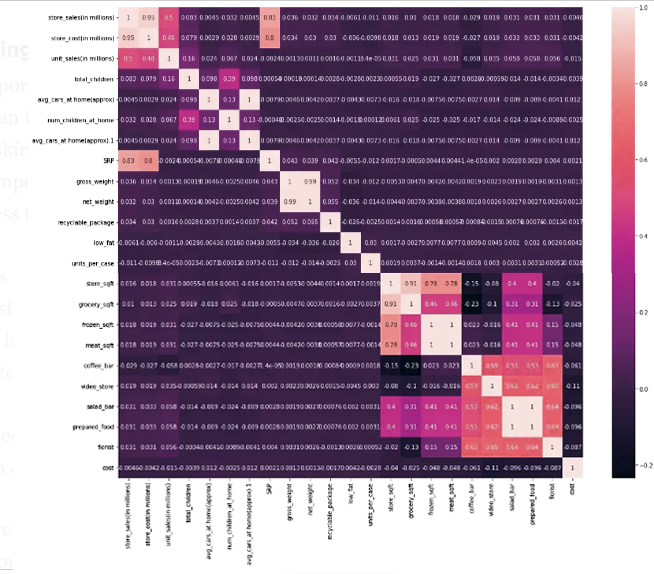
In our example, it is clear to us through the chart that there were no outliers or null records in the data, but we removed a duplicate column that was detected in the table.
Through our expectation of the correlation, it became clear to us that the information is strongly related to each other:
Grossy_sqft x Meat_sqft → Negative High Correlation
Store_sales x Store_cost → High positive correlation
Store_sales x SRP → High positive correlation
Gross_weight x Net_weight → High positive correlation
Salad_bar x Prepared_food x Coffee_bar x Video_store x Florist → positive median correlation
Advertisements
4. Data Engineering :
It is essential to understand the problems that the organization you work in faces. You need to create value added from data, create key tool indicators, and other necessary tasks.
The main goal of our project is to determine the budget necessary to obtain clients, and this is necessary in order to estimate an appropriate value for the budget that is supposed to be spent in the future at the lowest possible cost.
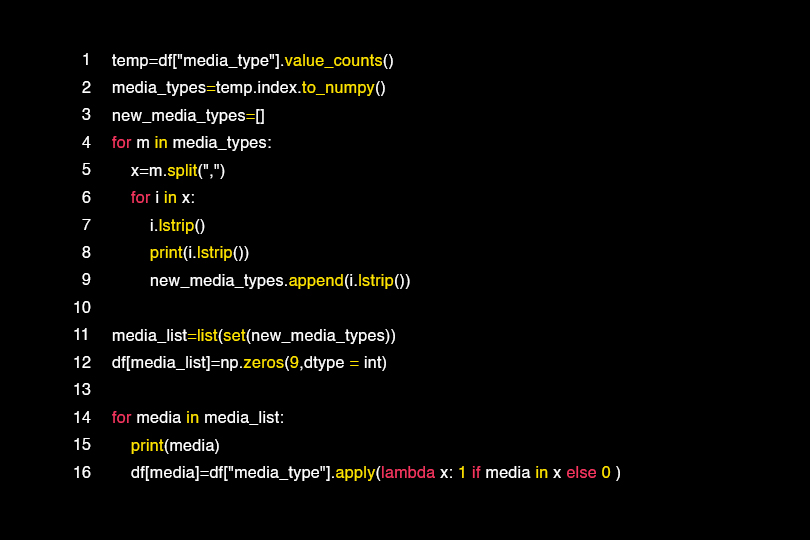
We have created a number of new variants with Onehot technology
So first we need to convert the categorical variable values into a numeric value so that we can use them in the algorithms, as shown below:
We have obtained new columns by separating the columns by more than one value with the following operations as in the case of the arguments column.
Here we notice the media channels that are used a lot and that directly affect the cost variable.
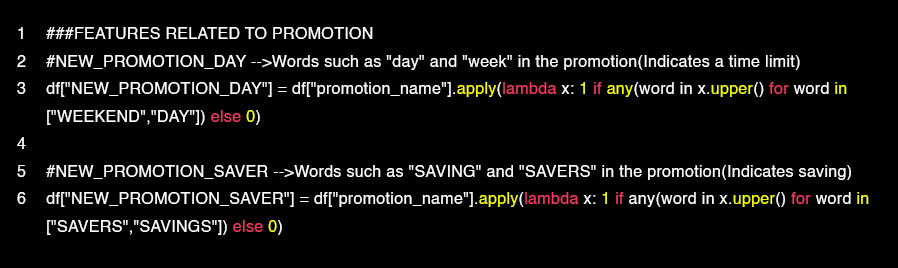
Motivational words that attract customers as promotional offers have been added to the column related to the promotion category containing words such as “today” and “weekend” and other words that inform the user of the need to obtain a product during a certain period.
We also notice that the columns passed through Onehot are within columns that have a few different values such as: country, profession.
5. Monotheism:
A necessary study so that no variable affects the data and to obtain effective training within the shortest possible period.
We note that we used the StandardScaler model because our data did not contain an exception.
If the data happens to contain an exception, then the RobustScaler model is recommended
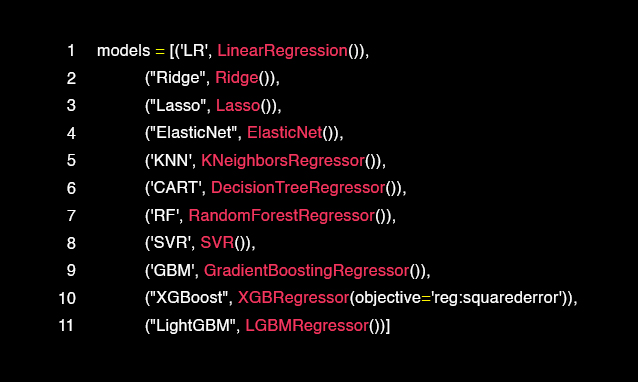
6. Estimation:
Indeed, we can say that we succeeded in estimating each model by varying the different skills of machine learning, and we worked on adjusting the Hyperparameter, and before that we had excluded weakly correlated variables, and the purpose of that was to remove the correlation to obtain training in less time.
7. Compilation:
The second plan that we are working on in our project is to obtain customers and keep them as permanent customers, so we classified customers and worked to estimate the value needed for that
This image shows what is meant:
8- Graphic representation:
Data loses its value if we do not deal with it properly. The basis on which successful analysis is built is the correct description of the data, and the best way to achieve this is to visualize the data.
In our project we made a control panel by Microstrategy
Project elements:
Store sales according to its type and cost: The purpose is to determine the sales value and cost based on the type of store.
Stores location map: This map shows the distribution of stores within the city.
Customer Chart: It is a map that shows the classification of customers by country.
Distribution of customers by brand: Depending on the WORD-CLOUD model, we can count the brands of customers.
The media channel staff and the annual AVG: After doing the marketing offers, we were able to determine the appropriate membership and the audience that earns profits from that membership.
Classification of customers: using the dispersion chart.
Based on the division of the resulting five groups, you are now able to deal with them closely and form appropriate strategies to work according to the plans of the company in which you work
Here are examples of the plans that we have created based on the ratios between spending and financial return:
High cost and high financial return: It is represented in spending large amounts of money in exchange for attracting customers, then what you spent on me will return with abundant profit. By analogy, it is possible to determine the channel that receives the largest possible number of communications and exploit that by saving spending as much as possible.
High cost and low financial return: I spend a large amount of money to attract customers, but the financial return is low. This is due to several reasons, including that customers do not find their need in my store.
Low cost and low financial return: I spend a very small amount to get customers, but I may be the target of a specific audience who prefers a specific type of my products, whose financial returns are low. To follow the best strategy in this case, it is advisable to create a marketing campaign for preferred products based on statistics on the quantity and types of materials required.
Low cost and high financial return: This case embodies the speed of my access to customers in the shortest possible time, which brings me a large financial profit through marketing tours for this type of customer.
Medium cost and low financial return: I spend money to get customers, but the financial return is low. My store does not have enough materials that customers require. This problem can be solved by conducting some statistics to remedy the defect.
Advertisements
معالجة شاملة لمشروع علم البيانات
Advertisements
سنتناول اليوم المفاهيم الأساسية التي يرتكز عليها محللو البيانات أثناء ممارستهم لوظيفتهم فيما يتعلق بعلم البيانات وسنمضي سوياً لنتعرف على المراحل الرئيسية التي سنمر عليها تباعاً أثناء بحثنا هذا من أمثلة
VBO Bootcamp / Miuul عن العمل في مشروع
1. تكوين فكرة عن ماهية المشكلة المطلوب معالجتها :
أهم ما يبدأ به عالِم البيانات في معالجة أي قضية متعلقة بعمله الوظيفي هو فهم المشكلة التي يتوجب عليه حلها ثم فهم ما ينتج عن ذلك الحل من فوائد تعود على المؤسسة أو الكيان الذي يعمل فيه
يساعد الفهم الصحيح لنوع المشكلة أو ماهية العمل المطلوب على تحديد الآلية الأنسب لمعالجة المشاكل وبالتالي تعزيز الخبرات المكتسبة من خلال التجربة والممارسة , وفي مثالنا سنشاهد حلول مختلفة بآليتين مختلفتين
مجموعة البيانات المستخدمة
تتضمن البيانات التي سنستخدمها في هذا المشروع مخرجات من أجل تحديد الميزانية اللازمة لجذب أكبر عدد ممكن من العملاء وتصنيفهم وتجهيز برامج دعائية حسب متطلباتهم , لذا اتبعنا طريقة الانحدار لتحديد قيمة الميزانية واتبعنا أسلوب التجميع لتصنيف العملاء
تكمن أهمية هذه الاستراتيجية قدرتنا على تحديد مستوى الإنتاج بناءً على معرفتنا بنسب الربح التي سنصل إليها
2- تحديد نوع البيانات التي نتعامل معها
:وللقيام بهذه المرحلة بدقة يتطلب ذلك معرفة عدة نقاط
أ. ما نوع الترابط بين البيانات في مثالنا ؟
ب. ما هو المنشأ الأساسي لهذه البيانات ؟
ج. هل يوجد ضمن هذه البيانات قيم فارغة ؟
د. هل يوجد خلل في البيانات ؟
و. هل يوجد زمن محدد لمنشأ هذه البيانات ؟
ز. ما هي مدلولات الأعمدة في مجموعة البيانات ؟
Kaggle واستخدامك لمجموعة بيانات
سيجعل تحديدك لنوع البيانات أكثر ضرورة للحصول على نتائج دقيقة
* من الضروري التعرف على تعليمات المصدر الرئيسي للبيانات ومن خلال ذلك تتمكن من تحديد القيم المتطرفة والسجلات الخالية إن وجدت
التحقق من جميع المتغيرات ( الفئوية والعددية والرقمية ) التي تتعلق بصفة أساسية بالبيانات الخاصة بمشروعنا *
تدقيق المتغيرات العددية التي تم تحديدها لتعيين القيم الشاذة إن وجدت *
تعيين الفئات المتواجدة بكثرة ضمن البينات والفئات التي بالكاد تكون موجودة وذلك استكشاف أماكن تموضع المتغيرات الفئوية *
* تحليل الترابط بين المتغيرات لمعرفة تأثيرها على بعضها البعض , ويفيدنا هذا الإجراء في الاحتفاظ بالمتغير ذو الارتباط الأعلى مع المتغير التابع أثناء الاختيار
* تكوين فكرة عامة عن خصائص وميزات كل عنصر من عناصر المشروع *
وهذا تطبيق عملي على التجميع الذي أجريناه على المعلومات الدالة العلاقة بين المنتج والمستهلك في وحدة سكانية معينة وأحد المحلات التجارية المتواجدة في تلك المنطقة
: تظهر النتائج أنه يوجد لدينا
STORE_SALES=UNIT_SALES*SRP
بالأحوال العادية لا يمكنك إدراك معنى هذا المفهوم لذا ستضطر للبحث
للتأكد من صحة التجميع Google في
3. استكشاف القيم المتطرفة والسجلات الخالية :
في مثالنا يتضح لنا من خلال المخطط أنه لم تكن هناك قيم متطرفة أو سجلات خالية في البيانات ولكن أزلنا عموداً مكرراً تم اكتشافه في الجدول
من خلال توقعنا لعلاقة الارتباط اتضح لنا أن المعلومات مرتبطة بقوة بين بعضها
Grossy_sqft x Meat_sqft → ارتباط عالي سلبي
Store_sales x Store_cost → ارتباط عالي إيجابي
Store_sales x SRP → ارتباط عالي إيجابي
Gross_weight x Net_weight → ارتباط عالي إيجابي
Salad_bar x Prepared_food x Coffee_bar x Video_store x Florist → ارتباط متوسط إيجابي
Advertisements
4. هندسة البيانات :
من الضروري فهم المشاكل التي تواجهها المؤسسة التي تعمل بها فأنت بحاجة إلى إنشاء القيم المضافة من البيانات وإنشاء مؤشرات الأداة الرئيسية وغيرها من المهام الضرورية الأخرى
والغاية الأساسية في مشروعنا هو تحديد الميزانية اللازمة للحصول على العملاء وهذا ضروري من أجل تقدير قيمة مناسبة للميزانية المفترض صرفها في المستقبل بأقل تكلفة ممكنة
قمنا بإنشاء عدد من المتغيرات الجديدة
Onehot عن طريق تقنية
إذاً نحن بحاجة أولاً إلى تحويل القيم المتغيرة الفئوية إلى قيمة عددية لكي نتمكن من استخدامها في الخوارزميات , وذلك كما على النمطالموضح أدناه
لقد حصلنا على أعمدة جديدة عن طريق فصل الأعمدة بأكثر من قيمة مع العمليات التالية كما هو الحال في عمود الوسائط
هنا نلاحظ القنوات الإعلامية التي تُستعمل كثيراً والتي تؤثر تأثيراً مباشراً على متغير التكلفة
تم طرح ألفاظ تحفيزية تجذب الزبائن كعروض ترويجية أضيفت للعمود المرتبط بفئة الترويج تحوي كلمات مثل ” اليوم ” و” عطلة نهاية الأسبوع ” وغيرها من ألفاظ التي تُشعِر المستخدم بضرورة الحصول على منتج ما خلال فترة معينة
Onehot نلاحظ أيضاً أن الأعمدة التي مرت عبر
موجودة ضمن أعمدة حازت على عدد قليل من القيم المختلفة مثل : البلد , المهنة
5. التوحيد :
دراسة ضرورية لكي لا يقوم أي متغير بالتأثير على البيانات وللحصول على تدريب فعال خلال أقصر فترة ممكنة
StandardScaler نلاحظ أننا استخدمنا نموذج
لأن بياناتنا لم تحتوي على استثناء
وإن حدث واحتوت البيانات على استثناء فعندها يوصى
RobustScaler باستخدام نموذج
6. التقدير :
, بالفعل نستطيع القول بأننا نجحنا في تخمين كل نموذج عن طريق تنوع المهارات المختلفة للتعلم الآلي
Hyperparameter وعملنا على ضبط
وقبل ذلك كنا قد استثنينا المتغيرات ضعيفة الترابط , والغاية من ذلك إزالة علاقة الارتباط للحصول على تدريب في وقت أقل
7. التجميع :
الخطة الثانية التي نعمل عليها في مشروعنا هي الحصول على الزبائن والمحافظة عليهم كعملاء دائمين لذا صنفنا العملاء وعملنا على تقدير القيمة اللازمة لذلك
: وهذه الصورة توضح المقصود
8. التمثيل البياني :
تفقد البيانات قيمتها إن لم نكن نحسن التعامل معها كما يجب فالأساس الذي يبنى عليه التحليل الناجح هو الوصف الصحيح للبيانات وأفضل طريقة لتحقيق ذلك هو تصور البيانات
Microstrategy في مشروعنا قمنا بصنع لوحة تحكم بواسطة
:عناصر المشروع
مبيعات المتجر قياساً إلى نوعه وتكلفته : الغاية هي تحديد قيمة المبيعات والتكلفة على أساس نوع المتجر
خريطة تموضع المتاجر : تظهر هذه الخريطة توزع المتاجر ضمن المدينة
مخطط العملاء : عبارة عن خريطة توضح تصنيف العملاء حسب البلد
:توزيع العملاء حسب العلامة التجارية
WORD-CLOUD بالاعتماد على نموذج
يمكننا إحصاء العلامات التجارية الخاصة بالعملاء
كادر القناة الإعلامية و AVG السنوي : بعد قيامنا بالعروض التسويقية استطعنا تحديد العضوية المناسبة والجمهور الذي يكسب أرباح من تلك العضوية
تصنيف العملاء : باستخدام مخطط التشتت
استناداً إلى تقسيم المجموعات الخمسة الناتجة أصبح بمقدورك التعامل معها عن قرب وتكوين استراتيجيات مناسبة للعمل وفق خطط الشركة التي تعمل بها
: إليك نماذج عن الخطط التي أنشأناها مبنية على النسب بين الإنفاق والعائد المادي
تكلفة مرتفعة وعائد مادي مرتفع : تتمثل في إنفاق مبالغ كبيرة من المال مقابل جذب العملاء ثم يعود ما أنفقت علي بالربح الوفير , يمكن قياساً إلى ذلك تحديد القناة التي تستقبل أكبر من عدد ممكن من اتصالات واستغلال ذلك بتوفير الإنفاق أكبر قدر ممكن
تكلفة مرتفعة وعائد مادي منخفض : أقوم بإنفاق مبلغ مالي كبير لجذب العملاء ولكن المردود المادي منخفض , يعود هذا لعدة أسباب منها أن الزبائن لا يجدون حاجتهم في متجري
تكلفة قليلة وعائد مادي منخفض : أقوم بإنفاق مبلغ قليل جداً للحصول على العملاء ولكن قد أكون مقصد لجمهور معين يفضل نوع محدد من منتجاتي عوائدها المادية قليلة ولاتباع أفضل استراتيجية حول هذه الحالة يُنصح بإنشاء حملة تسويقية للمنتجات المفضلة استناداً إلى إحصائيات بمكية وأنواع المواد المطلوبة
تكلفة قليلة وعائد مادي مرتفع : تجسد هذه الحالة سرعة وصولي إلى العملاء بأقل وقت ممكن مما يعود علي بربح مادي كبير عن طريق جولات تسويقية لهذا النوع من العملاء
تكلفة متوسطة وعائد مادي منخفض : أنفق المال للحصول على العملاء ولكن المردود المادي قليل , لا تتوفر في متجري المواد التي يطلبها العملاء بشكل كافي , يمكن حل هذه المشكلة بإجراء بعض الإحصائيات لتدارك الخلل


You must be logged in to post a comment.