Eighth Tool

The ideal tool for creating dashboards, interactive charts, and master data cleaning
Experience Level : Beginner to Intermediate.
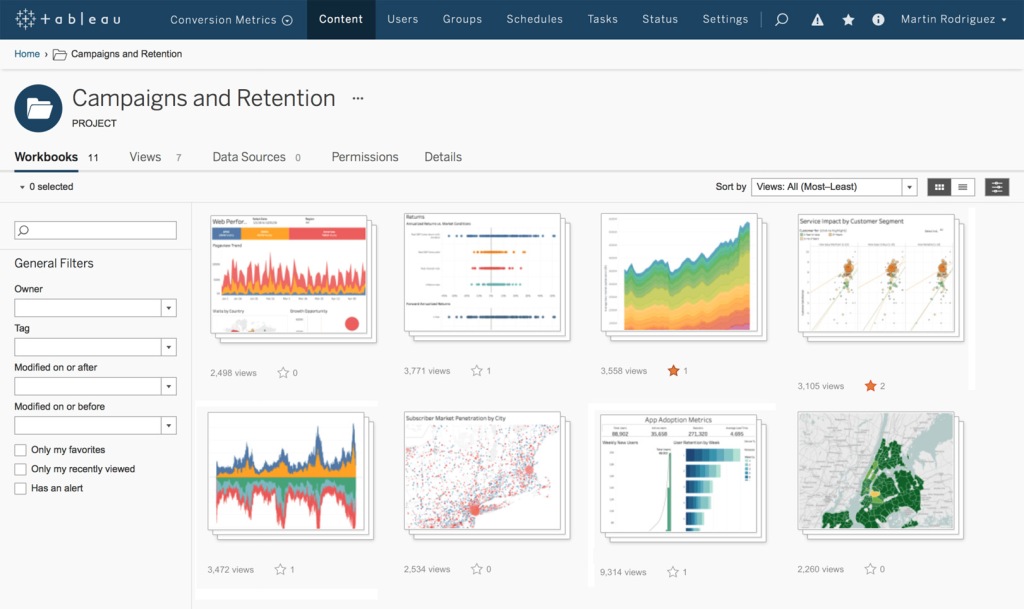
Tableau is the perfect choice for designing elegant, high-tech infographics and is characterized by its ability to create information control panels without the need to use codes. It allows data analysts to send that data to people who are inexperienced in dealing with technology. It also allows them, through interactive control panels, to easily follow that information. complete.
The disadvantages of this program are that, despite its ability to analyze data, it does not have the efficiency to process random data that requires a thorough cleaning, which is often Python and R are the most appropriate options for this task, in addition, it often targets large companies, as its prices start from 70 dollars per month.
To illustrate the use of Tableau features in work, for example, every data analyst or data scientist in general sends results and reports to executives, and those reports must be attractive, interactive, customizable, and have the flexibility of access to others, and with the BI feature, you can create charts and visualizations with its ability to easily Join multiple tables, detail and analyze data with complete flexibility by dragging and dropping.
Tableau saves a lot of time and effort in creating interactive control panels, thus avoiding dealing with complex programming and wasting time as in Matplotlib / Seaborn / Plotly to get accurate results quickly.