

tenth tool

The ideal tool for text finding and sentiment analysis
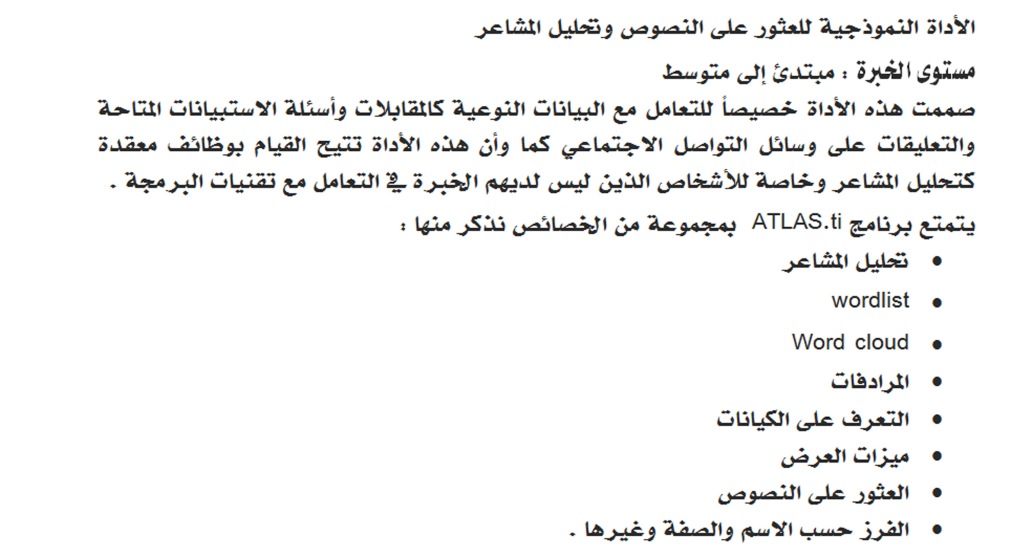
Experience Level : Beginner to Intermediate

This tool is specifically designed to deal with qualitative data such as interviews, available survey questions and comments on social media. This tool also allows to perform complex functions such as sentiment analysis, especially for people who do not have experience in dealing with programming techniques.
ATLAS.ti program has a number of features, including:
• Sentiment Analysis
• wordlist
• Word cloud
• Synonyms
• Entity recognition
• Display Features
• Find texts
• Sorting by name, adjective, and others.
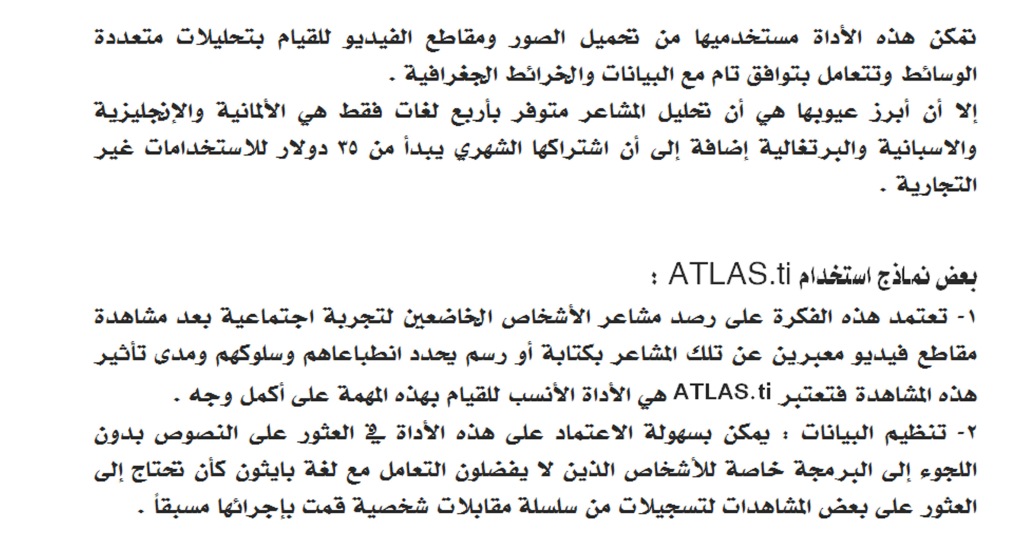
This tool enables its users to upload images and videos for multimedia analytics and works in full compliance with geo-data and maps.
However, its main drawback is that sentiment analysis is available in only four languages: German, English, Spanish and Portuguese, in addition to its monthly subscription starting at $35 for non-commercial use.
Some examples of ATLAS.ti usage:
1- This idea is based on observing the feelings of people who are subject to a social experience after watching videos expressing those feelings by writing or drawing that determines their impression and behavior and the extent of the impact of this viewing, so ATLAS.ti is the most appropriate tool to do this task to the fullest.
2- Organizing data: This tool can easily be relied on to find texts without resorting to programming, especially for people who do not prefer dealing with the Python language, as if you need to find some views of recordings from a series of personal interviews you have previously conducted.
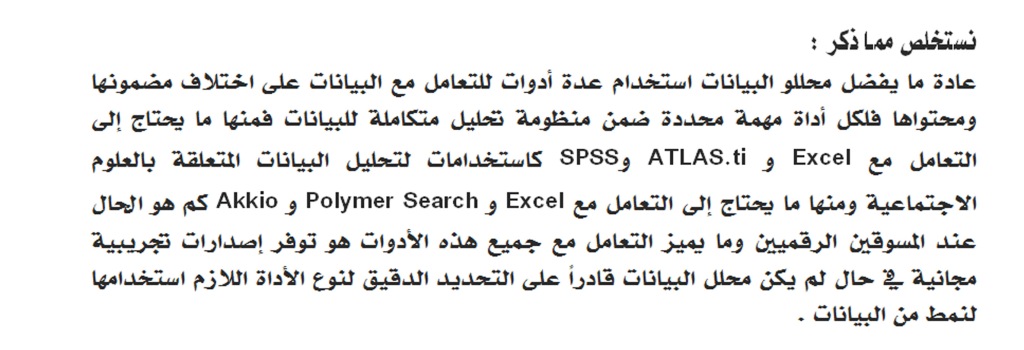
We conclude from the above:
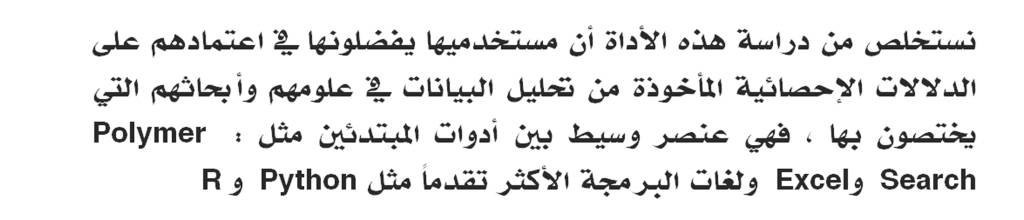
Data analysts usually prefer to use several tools to deal with data of different content and content. Each tool has a specific task within an integrated data analysis system, some of which need to deal with Excel, ATLAS.ti and SPSS as uses for data analysis related to social sciences, and some need to deal with Excel Polymer Search and Akkio, as is the case with digital marketers and what distinguishes dealing with all these tools is the availability of free trial versions in case the data analyst is not able to accurately determine the type of tool to use for a pattern of data.


You must be logged in to post a comment.