Best For Advanced Statistical Analysis: R

Sixth tool

Advertisements

The ideal tool in advanced academic statistical analysis, big data and machine learning

Experience Level: Advanced

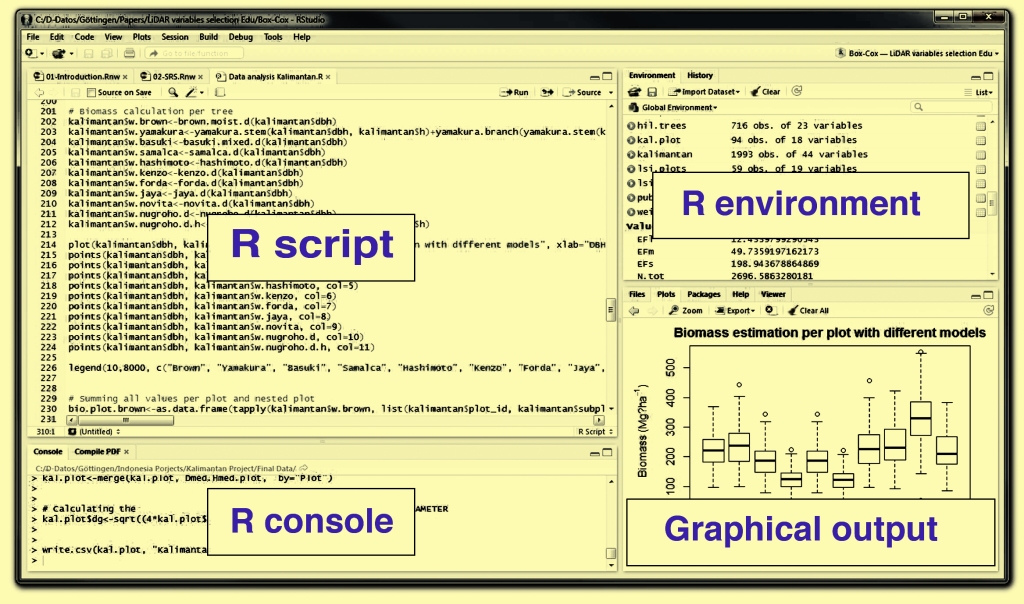
R program is characterized by its efficiency in conducting very advanced statistical analysis (academic level stuff), especially exploratory data analysis (EDA), and this is what makes it superior to Python, although they have almost the same functional characteristics, especially in the processing of large data

R tool is designed to perform advanced-level statistical analysis with high accuracy. It is known that tools that are specific to specific functions can perform those tasks more accurately than those tools that perform general functions.

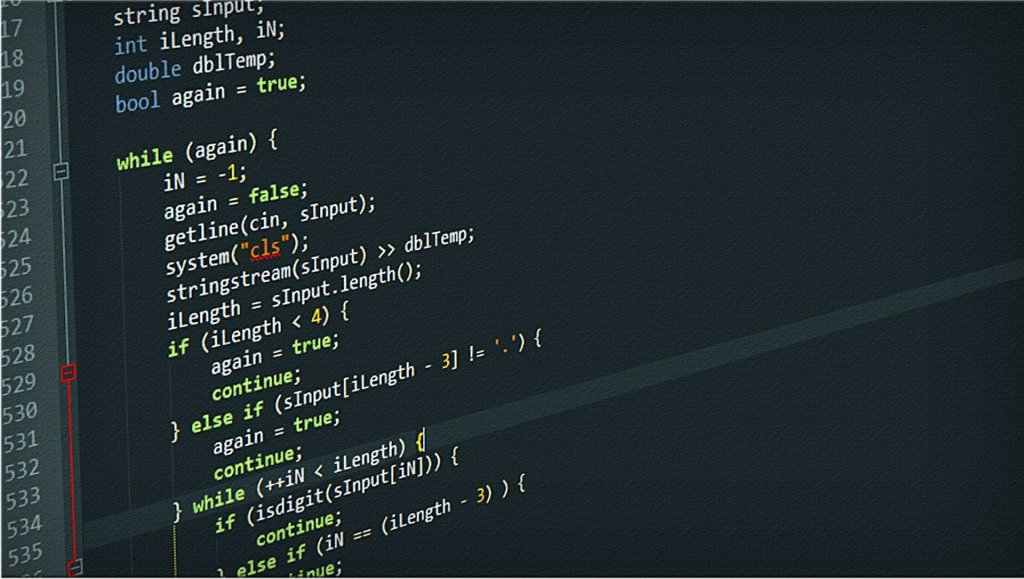
Compared to Python, for example, doing a common analysis for R is simple and easy. As for Python, this task needs to find the right library and know how it works, then write codes and waste time and effort doing actions that you don’t need to do in R.

In the end, we conclude that the R and Python tools share almost the same functional characteristics with the advantage of Python in building production applications, but it does not have the efficiency in doing advanced academic computations compared to R .

Advertisements
Advertisements
Advertisements

Python : Best For Machine Learning & Automation – Fifth tool

Advertisements

Optimized tool: for dealing with big data, machine learning, automation and application development.

Experience Level: Advanced

Python is the most widely used programming language among data scientists and analysts because it is open source, contains multiple and diverse libraries, is characterized by its speed of performance, and is written in C. This means that it is possible to store and process bytes and bits that require a lot of time faster and easier.

As we mentioned earlier, the Python language is open source and contains 200,000 packages that include packages used for data analysis such as Plotly, Seaborn and Matplotlib. You can also call libraries in any field of data analysis.

Key Features of Python in Data Analysis, Machine Learning, and Automation:

• Great ease in dealing with small data and in performing complex calculations.

• Super speed in the processing of huge data.

• Save a lot of time in automating information.

Despite all these advantages that Python has, it is not without some drawbacks, most notably its ineffectiveness for mobile applications on the one hand, and its learning period to serve the purpose for which it is used, which is considered long compared to other tools on the other hand.

Python application examples:

Automation : You can do the analysis of several groups of data using several analysis tools such as Excel, but this requires a great deal of time and effort. The analysis then will be manually for each group separately, but the analysis of the same groups using Python will be more flexible and fast, and with 15 lines of code that will accomplish the task perfectly. Face .

Cleaning data : If you lose a sponsored link from a TV show, for example, you can restore those links by discovering those links in the first stage and then writing code to restore links as a second stage.

Exploratory data analysis :

You can understand the visualization and distribution of data by building an interactive model of your data in simple code in a short time using the Python module Pandas Profiling.

Thus, we conclude that these characteristics of the Python language made it the most widely used and desired language by data analysts and the best in dealing with data science and its branches of science and technology.

Advertisements
Advertisements
Advertisements

Best For Querying Big Data: SQL

Fourth tool

Advertisements

The ultimate tool for checking and processing big data

Experience Level: Intermediate

SQL is a programming language for querying and manipulating data

It performs almost the same tasks as Excel, but it is superior to it in its ability to deal with large data, and thus shortens a great deal of data processing time compared to Excel, in addition to its ability to store data in small files.

However, the only aspect in which Excel excels over SQL is the ease of learning and handling of the main tasks.

The main function of SQL tool is to edit big data

For example, you have a very large number of posts on Instagram and you want to make edits or sort those posts with easy procedures and simple instructions.

It has an effective role in joining data sets together. You can rely on SQL to combine several spreadsheet files containing a number of fields in one file with the utmost smoothness and flexibility, avoiding complications, difficulties and wasting time that you face to perform this task in Excel.

Advertisements
Advertisements
Advertisements

Third Tool: Building Prediction Models: Akkio

Advertisements

The ideal tool for predictive analytics, sales and marketing

The principle of this tool is based on artificial intelligence. After you enter your data on Akkio, select the variable you want to predict, and Akkio will build a neural network around this variable, using 80% as training data and 20% for validation.

The most important thing about Akkio is that it is not limited to prediction but also classifies the results accurately and with a few clicks in simple steps you can publish the model in a web application.

However, its disadvantages are that it is limited to dealing with table data and does not support the discovery of image and audio files, and its price starts at $50 per month.

To illustrate how to invest this tool to serve your business and projects, let’s say for example that you run an online store and email promotions, you use Akkio to create forecast models that you sell to customers so it can be said that this tool is good for users who do not have technical experience to get started with predictive analytics.

Advertisements
Advertisements
Advertisements