The Second Tool:

This tool is considered one of the easiest data analysis tools but the best for analyzing and displaying sales and marketing data and practical in business intelligence techniques
Experience Level: Beginner
You can perform a set of tasks in the analysis by entering your data on the site of the tool, which in turn will convert that data into an interactive web application, and these tasks include:
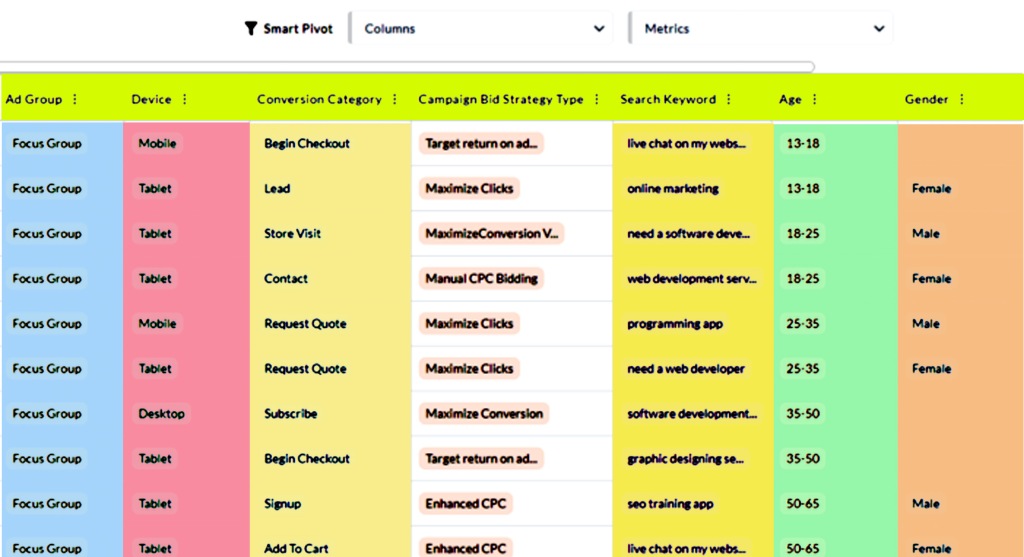
1- interactive pivot tables:
You can get questions about the data in a smooth and fast way and sort the entered data and output by clicking on click on the instructions for this process.
2- Automatic explanation:
Several options are presented to you about the data to ensure that you get the best results, such as suggesting summaries and showing anomalies, such as providing the optimal options for an effective digital marketing strategy according to certain data that determine the size of the currency, the target group, and others.
3- Interactive visualizations:
This tool allows its users to find several ideas and features about data and create interactive dashboards by presenting many types of charts, whether strip, bubble, scattered and heat maps, and the fact that these visualizations are interactive, which makes dealing with them easier and more accurate, especially in terms of sorting and filtering data.
Among the advantages of this performance is the discovery of matrices and their automatic division, as well as the presence of features and analysis techniques that cannot be performed by other programs such as Excel.
Despite all the advantages of this tool, it is not without some drawbacks, the most prominent of which is its inability to deal with large data and its loss to give more accurate results when dealing with more complex analysis, as it does not provide several types of charts and graphs.
This tool provides digital marketing users with several advantages as mentioned above, for example, this tool can act on your behalf in running Facebook ads or any PPC campaign and finding the most effective groups.
After you enter the data of your search for the target group of the audience, it sorts the search results and reviews them for you from best to worst and provides information on the secondary values resulting from that search process.
Business Intelligence: Polymer turns your spreadsheet into a dashboard where you can create infographics that you share with executives or clients via a URL that’s easy and flexible to access.
Therefore, this tool is simply considered optimal for non-technical people and for beginners because of the features and techniques that it offers with high efficiency in accomplishing the required tasks.