


Let us start with the first
- Excel Tool:

Excel is ideal for processing graphs and charts, and for analyzing and storing data; you can replace it as well if it is not available in your workplace with google spreadsheets because of the great similarity between them. Excel allows you to create charts and graphs very smoothly, providing several types of charts, including pie charts, box charts, bar charts, scatter charts, and other forms of charts, so either you’re a beginner or intermediate could use this program and take advantage of its capabilities.
You can also customize the colors according to what your work requires, in addition to various options such as controlling the size to display the results on the web with appropriate accuracy.
Excel provides a set of capabilities and techniques that allow you to control and change the data as you want, which makes Excel the ideal program for data analysis through several utilities, filters and mathematical operations within the program.
The circle of benefit from the program expands by learning the original programming language of the program, which is VBA, and that is recommended for those who spend a long time working on the program.
However, the main problem of Excel is that it is unable to process and analyze large and more complex data, and it does not favor its use in statistical analysis.
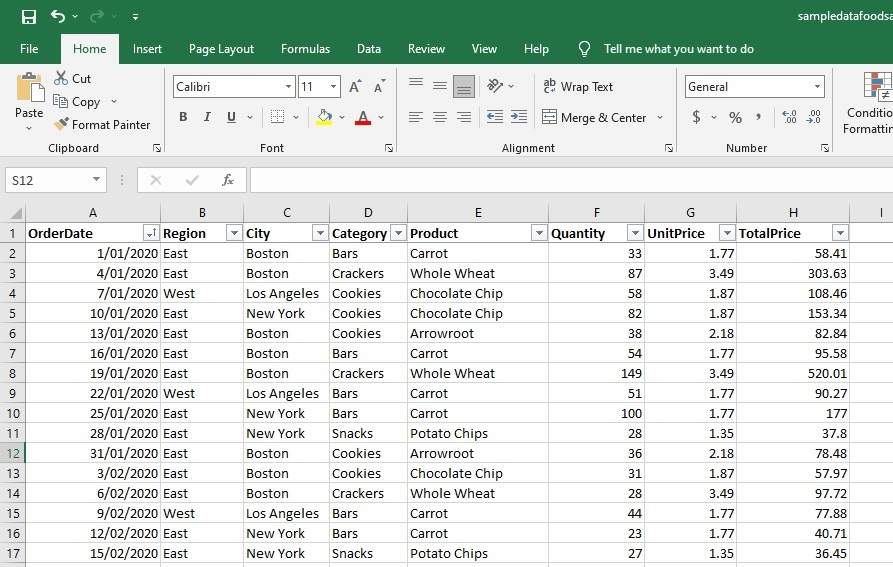
- Here are samples that illustrate some of the features of working on Excel:
Data manipulation:
Excel contains several options for dealing with specific parts of the data, such as deleting specific positions of characters in each cell, or dividing a column into several columns, and so on.
Calculations:
Let’s say you have e-commerce data about sales of certain products and you always in need for calculations. So, Excel gives you several options to perform calculations on that data.
Bivariate Analysis:
Excel could be helpful in that case as it offers all the types of charts you need to analyze univariate or bivariate structured data.
Pivot Tables:
This tool enables you to create quick and easy pivot tables to get answers to common questions.
As a conclusion, Excel is an important tool with techniques and options that serve data analysts in implementing all that is necessary for their projects.


I need it for my research
LikeLiked by 1 person