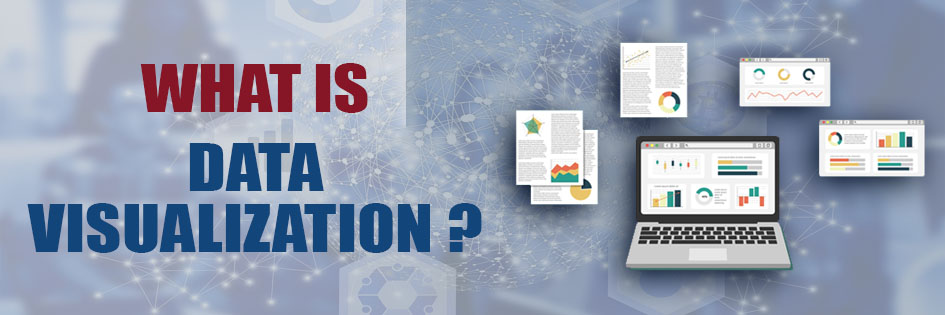
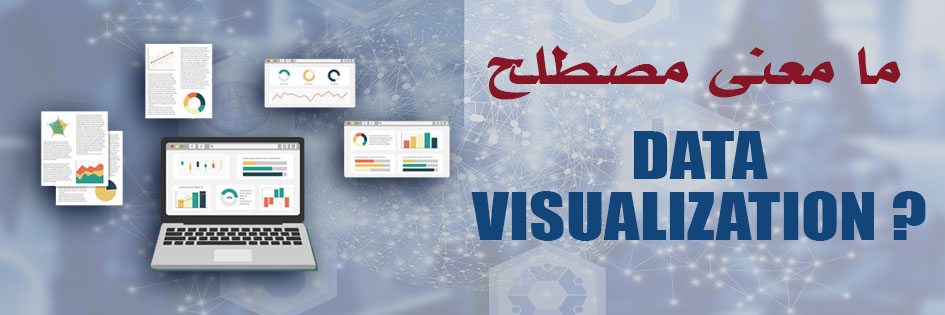
This term refers to the visual figures and symbols that capture information in the form of GEOGRAPHICAL MAPS, CHARTS, SPARKLING, INFOGRAPHICS, HEAT MAPS, OR STATISTICAL GRAPHS.
These graphics represent several factors such as AI integration, information abundance, and interactive exploration to make information simple to understand and study that expands the possibility of obtaining more accurate and effective results.
In this context, we offer 5 tools of data visualization that are flexible and efficient:
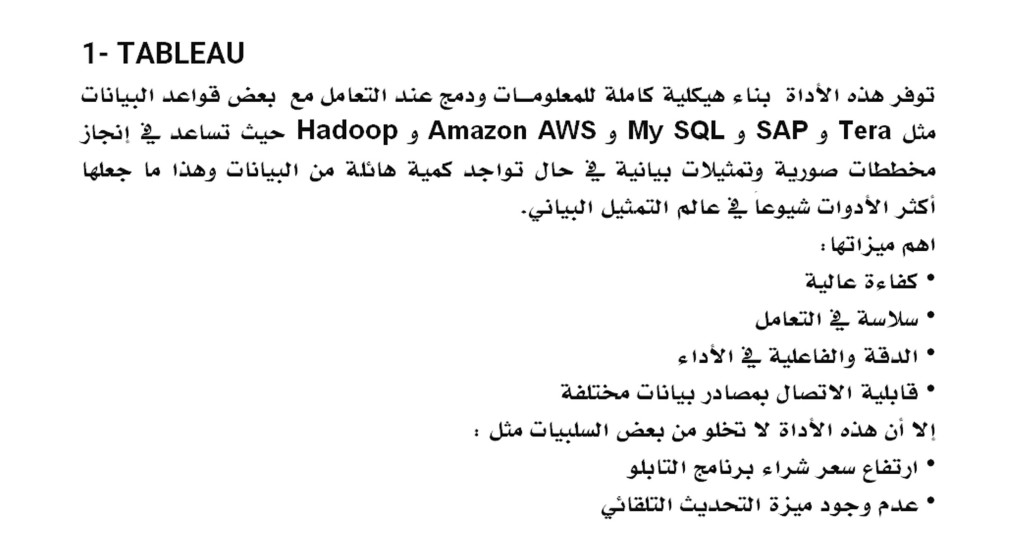
1- Tableau
This tool provides a complete information architecture building, including Tera, SAP, My SQL, Amazon AWS, and Hadoop and helps in creating schematic diagrams for the foundations of information on an ongoing basis, which made it the most popular tool among data visualization users because it has several advantages, including:
• High efficiency of visualization
• Smooth handling
• Accuracy and effectiveness in performance
• The ability to connect to different data sources
• Responsive Mobile
• It has media support
However, this tool is not without some disadvantages, such as:
• Low pricing
• Lack of automatic update feature and scheduling of the report
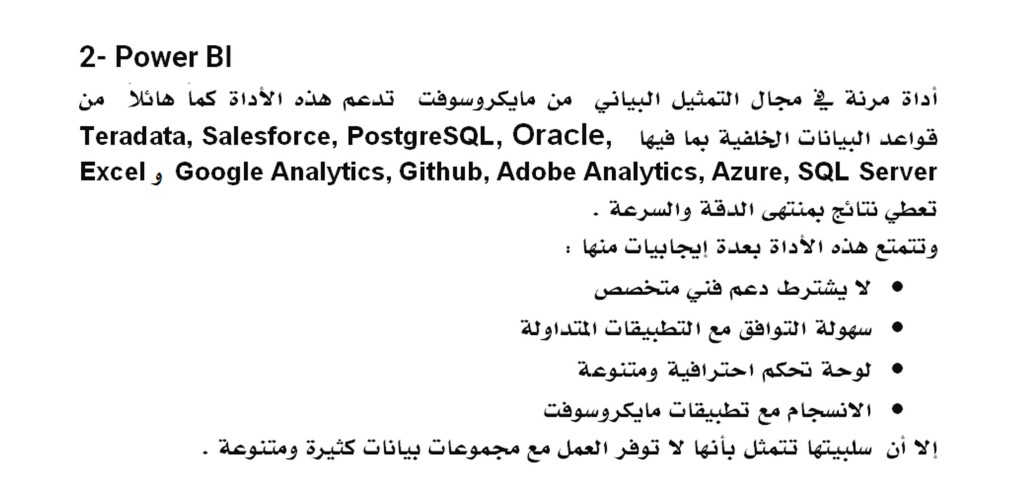
2- Power BI
Flexible tool from Microsoft This tool supports a huge amount of back-end information including Teradata, Salesforce, PostgreSQL, Oracle, Google Analytics, Github, Adobe Analytics, Azure, SQL Server and Excel gives results with the great accuracy and speed.
This tool has the following advantages:
– No specialized technical support required
– Easy compatibility with popular applications
– Professional and diversified control panel
– Unlimited speed and memory
– High level security
– Compatibility with Microsoft applications
However, its disadvantage is that it does not provide an environment to work with many and varied data sets.
3- JupyteR
This tool is characterized as one of the best data visualization tools as it allows its users to create and share files that include multiple visualizations and codes. In addition, it is an ideal tool for:
Data cleansing, transformation, statistical modeling, numerical simulation, interactive computing and machine learning.
Positives :
– Prototyping speed
– Give results in elegant looking shapes
– Share visual results easily
Negatives :
– Difficulty to cooperate
– Reviewing scripts is sometimes difficult
4- Google Charts
This tool has the ability to innovate graphical and graphical representation, as well as its compatibility with the most popular operating systems circulating around the world.
Positives :
– Ease of handling.
– The possibility of merging data with complete flexibility.
– Show graphical results through elegant looking graphics.
– Full compatibility with Google applications.
Negatives :
– Requires accuracy in export procedures.
– Lack of demonstrations on tools.
– Unavailability of customization.
– Required network connection required for visualization.
5- IBM Watson
This tool is highly efficient, as it relies on analytical components and artificial intelligence to create models from regular and random information to reach the optimal visualization.
Positives :
– Neuro Linguistic Programming skills.
– Availability from several devices.
– Predictive studies.
– Self-service control panel.
Negatives :
– Need to develop customer support service.
– High maintenance costs.
At the End, Learning visualization is very important during the data science learning journey based on studies that indicate the rapid growth and development in the use of the Internet and information technology.



Hi there, I found your blog via Google while looking for a related topic, your web site came up, it looks great. I have bookmarked it in my google bookmarks.
LikeLiked by 1 person
It抯 really a great and helpful piece of info. I am glad that you shared this helpful information with us. Please keep us informed like this. Thanks for sharing.
LikeLike
Thanks for your personal marvelous posting! I certainly enjoyed reading it, you’re a great author.I will make sure to bookmark your blog and may come back sometime soon. I want to encourage that you continue your great work, have a nice morning!
LikeLike
Hello There. I found your blog using msn. This is a really well written article. I抣l make sure to bookmark it and come back to read more of your useful info. Thanks for the post. I will definitely comeback.
LikeLike
One thing I would like to say is the fact that car insurance cancellation is a horrible experience and if you’re doing the proper things as a driver you won’t get one. A number of people do have the notice that they have been officially dumped by their insurance company they then have to scramble to get extra insurance following a cancellation. Inexpensive auto insurance rates are often hard to get from a cancellation. Having the main reasons concerning the auto insurance termination can help drivers prevent burning off one of the most crucial privileges obtainable. Thanks for the suggestions shared by your blog.
LikeLike