
CLICK ESSAYS SECTION ThAT YOU WANT AND ENJOY READING!
Advertisements

CLICK ESSAYS SECTION ThAT YOU WANT AND ENJOY READING!
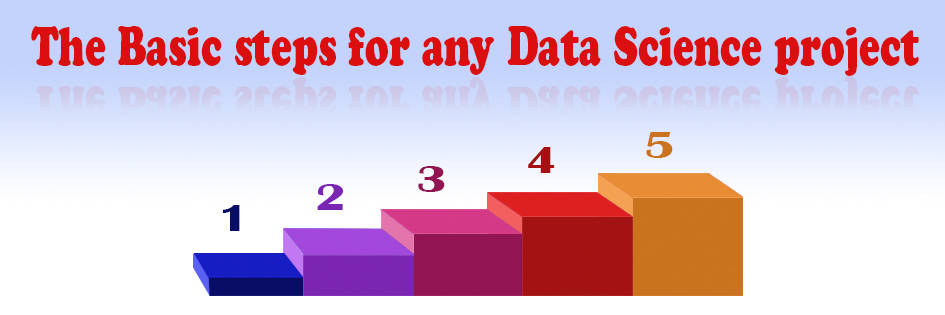
As a beginner, did you ask yourself what are the basic steps for any Data Science project?
The objective of this step is to comprehend the issue by applying a study for the business problem.
For example, let’s say you are trying to predict the obesity rate in certain country. In this case, you need to comprehend the terminology used in the research industry and the main problem, and then collect enough relevant data about that meet your research.
2- Preparing the Data:
A data scientist should first explore the dataset to specify any missing data or data that are useless to our analysis goals. During this process, you must go through several steps, including:
It is used to Resolve any struggles in the dataset and wipe out redundancies.
Normalize, transform and aggregate data using ETL (extract, transform, load) methods
decrease the size of the data without affecting the quality of the results
learning has many steps depending on the data quality and the mess levels. So, in this step, we perform filling in the gaps, transform the data structure from one type to another.
3-Model Planning:
After you have cleaned up the data, you should pick an appropriate model. The model you need should match with the idea of the issue—is it a regression issue, or a classification one? This part of working additionally includes an Exploratory Data Analysis (EDA) to dive more into data to reveal the insights and comprehend the connection between the variables. A few strategies utilized for EDA are histograms, box plots, bar charts, and so on.


After finishing choosing the model, split the data into training and testing data—training data to prepare the model, and testing information to validate the model. On the off chance that the testing isn’t exact, you should re-train another model. but if it is good working, you can place it into production.
The different tools utilized for modeling are:
This tool can be used for normal statistical analysis and visualization
Python has great scientific libraries to apply machine learning and data analysis
It is a great tool to perform full statistical analysis.
4- Model Building:
The following step is to create the model. Utilizing different analytical methods to discover useful information. You can quickly build models using Python packages from libraries like Pandas, Matplotlib, or NumPy.
During this step, the basic goal is to interpret our work to the stakeholders
by including details about steps taken and visualize it to make it easier to read.
6- Finalizing:
When all the team parties approve the discoveries, they get started. In this stage, the partners likewise get the last reports, code, and specialized archives.
:بالعربي
: الخطوات الاساسية اللازمة لتنفيذ مشروع في مجال علم البيانات-
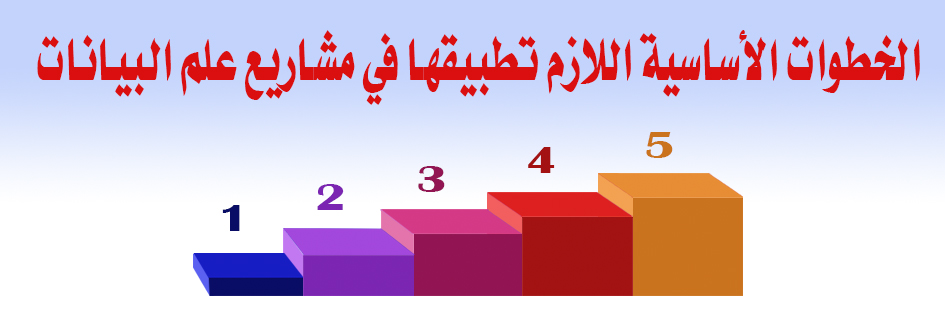
.كمبتدىء في مجال علم البيانات يجب كمرحلة اولى ان يكون لديك دراية بماهية الخطوات المتبعة اثناء تنفيذ مشروع لعلم البيانات
:١- اجراء دراسة اولية لفكرة المشروع
الغاية من هذه الخطوة هو فهم الفكرة الاساسية للمشروع المراد تنفيذه من خلال المعرفة الكافية بالمصطلحات الاساسية الخاصة بالمشروع وما هي الغاية من تنفيذ المشروع
:مثال على ذلك
اذا اردنا التنبؤ بمعدل البدانة ببلد ما , في هذه الحالة يجب فهم المصطلحات الاساسية الخاصة بهذا المجال وماهي البدانة والعوامل المؤثرة في ازدياد معدل البدانة وبالتالي معرفة المتغيرات اللازم ادخالها في عملية التحليل والتي تفيدنا بالحصول على نتائج جيدة
:٢- مرحلة تحضير البيانات
كأي عالم بيانات يجب بداية استكشاف الداتا للتخلص من البيانات الغير مهم ادخالها في عملية التحليل او اذا كانت هناك بيانات مفقودة يجب التعامل معها اما بحذفها او بملئها ببيانات جديدة مشتقة من البيانات الموجودة سابقا
:يعتمد تنفيذ هذه المرحلة على عدة مراحل لاحقة
Data Integration:
تستخدم هذه المرحلة للتخلص من البيانات المكررة
Data Transformation
وهي مرحلة من مراحل معالجة البيانات تعتمد على استخلاص البيانات من قواعد البيانات معالجتهاETLتدعى هذه
واعادة تحميلها
Data Reduction
اذا كان لدينا بيانات هائلة وضخمة فيمكن التخلص من جزء من هذه الداتا او اخذ عينة منها بحيث لايتم التأثير على مدى جودة الداتا
Data Cleaning
كماذكرنا سابقا هذه المرحلة تعتمد على مدى فوضوية البيانات وعشوائيتها لنقوم باتخاذ الخطوات المناسبة لتصحيحها وجعلها جاهزة لاعطاء النتائج
:٤- التخطيط لبناء المودل
بعد عملية تصحصح البيانات عليك البدء باختيار المودل المناسب لحل المشكلة التي تواجهك حسب نوعيتها هل هيه مشكلة لتحليل بيانات متوالية او مشكلة تصنيفية بمعنى النتائج يجب ان تكون اما نعم او لا
اي عملية استكشاف البيانات لايجاد العلاقة بين المتغيرات وماهية البيانات وتوزعها EDAايضا تتصمن هذه المرحلة ويكون ذلك بالتمثيل البياني والمخططات البيانية كمنحني التوزع الطبيعي (الهيستوغرام) او ال(البوكس بلوت) او( الباي تشارت


والغاية منه تدريب Training dataنقوم بتقسيم البيانات الى قسمين الاول يسمى EDAبعد الانتهاء من انتقاء المودل وعملية ال
والغاية منه تطبيق المودل بعد تدريبه للحصول على النتائجtesting dataالمودل على جزء من الداتا والبيانات والقسم التاني هو ال
اذا كانت النتائج مشكوك بدقتها او صحتها فيجب اخيتار داتا اكتر للتدريب واذا استمر الخطأ ممكن ان testing فبعد عملية ال
نقوم باستبدال المودل بمودل اخر
ماهي الادوات المستخدمة في عملية التحليل وما هي ميزاتها
R١- برنامج ال
هو لغة من لغات البرمجة يتم استخدامها من اجل العمليات الاحصائية والتمثيل البياني يتميز بقوته في رياضيات الاحصاء
٢-. البايثون
هو ايضا لغة من اللغات البرمجة والتي تعتبر سهلة جدا بالتعلم للمبتدئين في هذا المجال يتميز بتنوع مكاتبه العلمية المستخدم لرياضيات خوارزميات الماشين ليرنينغ وايضا مكاتب التمثيل البياني
SAS– ٣
من اهم البرامج المستخدمة في عمليات التحليل الاحصائي للبيانات
٤- مرحلة بناء المول
بناء المودل المناسب الهدف منه كما ذكرنا سابقا هو اكتشاف ماوراء الداتا , ففي حالة برنامج البايثون يتم استخدام مكتبات متعددة Matplotlibوايضاpandasوايضا Numpyمثل ال
٥- مرحلة مايسمى بترجمة النتائج
تعتبر هذه المرحلة من اهم مراحل عمل مشاريع الداتا ساينس وهي كتابة التقريرالنهائي بطريقة مبسطة وسهلة الفهم وباستخدام مخططات تمثيلية تسهل وصول الفكرة بشكل بسيط يتم شرح مبسط لما تم تطبيقه سابقا وشرح النتائج التي تم الوصول اليها وتقديم الحلول اذا اقتضى الامر
٦- المرحلة النهائية
وهي المرحلة النهائية التي يتم اعتماد النتائج التي تم الوصول اليها لتطبيقها ومرحلة استلام كودات العمل والتقارير النهائية
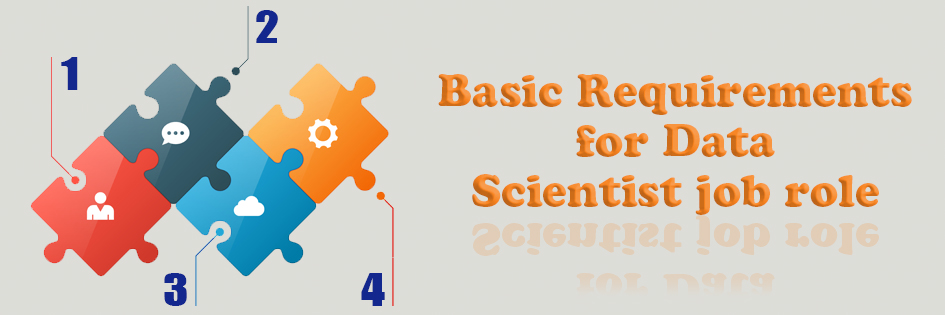
Basic requirements for Data Scientist job role.
What are the technical skills to be learned as a Data Scientist?
What are the basics of machine learning algorithms that any data scientist should know?
The basic of machine learning algorithms that any data scientist should know about are:
:بالعربي

ماهي المهارات التقنية التي يجب ان يتعلمها أي شخص مهتم بمجال علم البيانات؟
١- التعلم الالي: يعتبر التعلم الآلي الحجر الأساس في مجال الداتا ساينس بالإضافة الى معرفة اساسيات علم الإحصاء الرياضي
٢- التصميم الخوارزمي: هو الجزء الأساسي من تعلم الالة نستطيع من خلاله معرفة نوع الخوارزمية المناسب واللازم استخدامها اثناء عملية التحليل والتنبؤ
٣– رياضيات الاحصاء: هي الرياضيات القائمة عليها خوارزميات التعلم الالي حيث تساعد في كشف ما وراء الداتا للوصول لأحسن النتائج.
٤- لغات البرمجة: يجب ان تكون متوسط المستوى في أي لغة من لغات البرمجة من اجل ضمان إمكانية تنفيذ مشاريع جيدة في مجال الداتا ساينس. أسهل لغة برمجة في عصرنا الحالي هي البايثون.٥
– ٥- قواعد البيانات : كعالم بيانات عليك ان تعرف كيفية التعامل مع قواعد البيانات وكيفية الحصول على البيانات منها.
ماهي خوارزميات تعلم الالة الأساسية الواجب معرفتها لدي أي عالم بيانات؟
(سيتم ذكر أسماء الخوارزميات بالإنكليزي نظرا” لعدم توافر ترجمة لها بالعربي)
:Regressionخوارزمية ال
(Supervised)من الخوارزميات الشائعة في عالم الداتا ساينس تعتبر من تقنيات تعلم الالة الرقابية
بحيث تكون النتائج الناجمة عن تطبيق هذه الخوارزمية هي نتائج متوالية مثال عنها مراقبة تغير الوزن بشكل مستمر بالاعتماد على تغير كمية الحريريات الداخلة للجسم
:Decision treeخوارزمية ال
(supervised learning)هي أحد تقنيات تعلم الالة الرقابية أيضا
.وتستخدم لإعطاء نتائج تصنيفية اما نعم او لا.
:Naive Byesخوارزمية ال
(supervised learning)أيضا” هي أحد تقنيات التعلم الالي الرقابية
تعتمد بشكل أساسي على رياضيات الاحتمالات. تستخدم للحصول على نتائج ثنائية التصنيف او متعددة التصنيف
:Logistic regressionخوارزمية ال
(Supervised learning)أيضا” هي أحد تقنيات التعلم الالي الرقابية
وتكون العلاقة غير خطية بين المتغيرات Regressionثنائي التصنيف اما يس او نو وليس متتالي مثل ال Yتستخدم عندما يكون
:Clusteringخوارزمية ال
(un-labeled data) تستخدم للبيانات الغير معنونة (un-supervised learning)هي أحد تقنيات التعلم الالي الرقابية
.حيث تعتمد على جمع البيانات في مجموعات منفصلة
ـ هذا كان شرح مبسط غير مفصل عن خوارزميات تعلم الالة سنقوم لاحقا” بشرح هذه الخوارزميات وخوارزميات غيرها قريبا”.
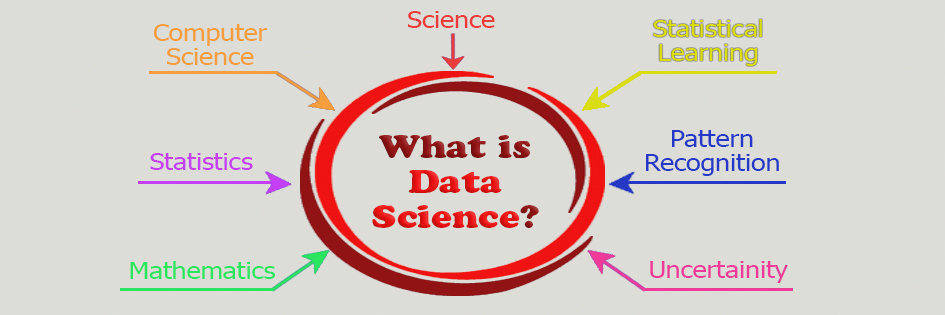
What is Data Science?
Where to get the Data?
Data Science lets you:
LET US TAKE AN EXAMPLE RELATED TO Data Science APPLIANCE:
We all have mobile phones and weather application is installed to know the weather every hour, did you ask yourself before how would that happen?
Data about temperature, humidity, wind speed, and air quality are collected every day to feed the weather applications’ algorithms in order to perform weather forecasting either day by day or for the week.
Do you think the type of algorithm is differ between the day-by-day temperature or by saying the weather sunny today, rainy or even snowy?
The answer is yes absolutely there is a difference.
Can you guess what is the difference ??!, write in comments 🙂
: بالعربي
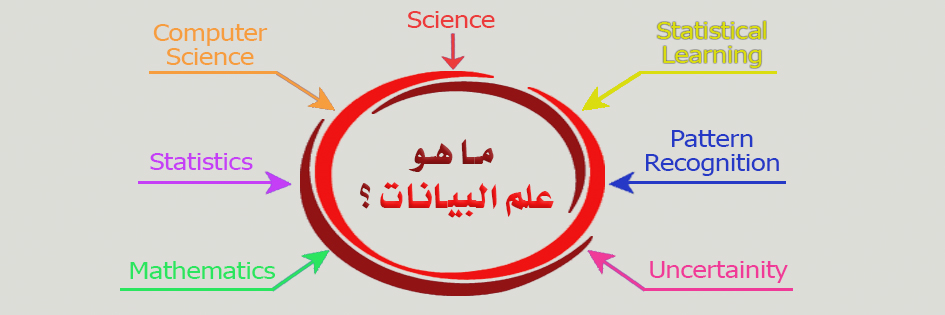
علم البيانات هو علم العصر , يعتمد هذا النوع من العلوم على جمع معلومات وبيانات ضخمة وتطبيق طرق خاصة بهدف الكشف عن ماوراء هذه الداتا وبالتالي اتخاذ القرارات الصائبة
كيف يمكن الحصول على هذه الداتا والبيانات؟
الحصول على هذه البيانات يكون عادة من مصادر مختلفة كالمؤسسات الاحصائية التي تقوم بجمع البيانات فيما يخص حدث معين كجمع معلومات عن اعداد الناس التي تمت اصابتهم بفايروس كورونا ضمن منطقة معينة بحيث تصبح هذه الاحصائية مرجعا فيما بعد لدراسات لاحقة. اما اذا اردت الحصول على بيانات من اجل التدريب وتطبيق خوارزميات تعلم الالة فيمكنك زيارة موقعين .kaggle and githubهما
:نستفيد من هذا المجال بمايلي –
اولا- علم البيانات يتيح المجال باستكشاف الأخطاء واصلاحها والاجابة على كل الأسئلة
٢- هذا المجال يتيح لنا استكشاف الداتا وتحليلها.
٣- استخدام خوارزميات تعلم الالة من اجل معالجة البيانات لاحقا والحصول على نتائج
٤- ترجمة هذه النتائج باستخدام أساليب التمثيل البياني من مخططات وغرافات من اجل سهولة الشرح للمستخدم النهائي
:مثال تطبيقي لمفهوم علم البيانات–
بداية يمكننا ان نرى ان علم البيانات اصبح متاح في كل مناحي حياتنا واكبر مثال على ذلك التطبيقات الموجودة على هواتفنا المحمولة التي تخص حالة الطقس لمعرفة حال الطقس كل ساعة بعد ساعة وممكن لأسبوع كامل, هل سألت نفسك بيوم من الأيام كيف يتم هذا؟
ان بيانات الحرارة والرطوبة وسرعة الرياح تجمع كل يوم لتغذية الخوارزميات القائمة عليها تطبيقات التنبؤ في حالة الطقس بهدف-الحصول على حالة الطقس يوما بع يوم او على مدى أسبوع كامل.
هل باعتقادك هناك فرق في نوعية الخوارزمية المطبقة لمعرفة درجة الحرارة يوميا او لمعرفة ماهي حالة الطقس سواء ماطر او صيفي او حتى مثلج؟
الجواب: طبعا. نعم هناك فرق بين الخوارزميتين المطبقتين.
(إذا عرفتم ما هو الفرق او ماهي الخوارزميات المطبقة في الحالتين السابقتين يرجى الكتابة في التعليقات).

You must be logged in to post a comment.